
53
Financial Statement
Frau
d

54
• Error – u
nintentional misstatements or
omissions of amounts or disclosures on
financial statements
• Fraud is i
ntentional
Errors, Irregularities, and Fraud

55
How errors and manipulations arise
Understated
liabilities and
expenses
Type of financial statement frauds
Overstated
assets or
revenues

56
Financial statement analysis
U
se analytical procedures for high volume transactions
“As each company and project is different, selection of
analytical procedures must be appropriate to the circumstances”
“As each company and project is different, selection of
analytical procedures must be appropriate to the circumstances”
Vertical
trend
analysis
Horizontal
trend
analysis
Ratio
analysis
Source: A Guide to Forensic Accounting Investigation

57
Financial statement analysis (contd.)
V
ertical and Horizontal analysis
1. Vertical analysis
• Compares elements of the financial statement with a
common base item
• Technique for analyzing the relationships between the items on an income
statement, balance sheet, or statement of cash flows by expressing components
as percentages.
• These relationships are compared within each accounting period and then the
period under analysis can be compared with historical periods
2. Horizontal analysis
• Used to understand the percentage of change in indiv
idual financial statement
items over a period of time
• Technique for analyzing the percentage change in individual financial statement
items form one year to the next.
Source: A Guide to Forensic Accounting Investigation

58
3. Ratio analysis
• Assesses and measures the relationships
– among various financial statement items
– with non financial data
• Can be compared with
– Historical data
– Industry data
– Against a benchmark
• For unexpected changes - source documents and related
accounts can be
examined in detail
Financial statement analysis (contd.)
R
atio analysis
Source: A Guide to Forensic Accounting Investigation

59
Illustration
Balance Sheet Vertical Analysis Horizontal Analysis
Assets Year 1 Year 2 Change % Change
Current Assets
Cash 45,000 14% 15,000 4% (30,000) -67%
Accounts
Receivable
150,000 45% 200,000 47% 50,000 33%
Inventory 75,000 23% 150,000 35% 75,000 100%
Fixed Assets 60,000 18% 60,000 14% - -
Total Assets 330,000 100% 425,000 100% 95,000 29%
Accounts Payable 95,000 29% 215,000 51% 120,000 126%
Long-Term Debt 60,000 18% 60,000 14% - -
Stock-Holder’s Equity
Common Stock 25,000 8% 25,000 6% -
Paid – In – Capital 75,000 23% 75,000 18% -
Retained Earnings 75,000 23% 50,000 12% (25,000) -33%
Total 330,000 100% 425,000 100% 95,000 29%

60
Income Statement Vertical Analysis Horizontal Analysis
Year 1 Year 2 Change %
Change
Net Sales 250,000 100% 450,000 100% 200,000 80%
Cost of Goods sold 125,000 50% 300,000 67% 175,000 140%
Gross Margin 125,000 50% 150,000 33% 25,000 20%
Operating
Expenses
Selling Expenses 50,000 20% 75,000 17% 25,000 50%
Administrative
Expenses
60,000 24% 100,000 22% 40,000 67%
Net Income 15,000 6% (25,000) -6% (40,000) -267%
Financial statement analysis (contd.)
V
ertical Analysis v/s Horizontal Analysis - Illustration

61
Types of financial statement frauds
A.
Misreporting
Misrepresentation
B. Misappropriation
of assets

62
Types of financial statement frauds
A.
Misreporting
Misrepresentation
1. Timing differences
2. Fictitious revenues
3. Concealed liabilities and
expenses
4. Incorrect or misleading
disclosures
5. Incorrect or misleading
a
sset valuations

63
1. Embezzlement
2. Stealing
T
ypes of financial statement frauds
B. Misappropriation
of assets

64
Fraudulent financial misreporting
1. Revenue recognition schemes
• Most common type of fraud
• Often use to conceal real numbers of a weak quarter
Excessive number of subsequent period returns of goods,
accompanied by an unusual jump in credits
Sales have been recorded before they
were actually made
Source: Financial Statement Fraud: Detecting the Red Flags

65
2. Fictitious Revenue
• Posting of sales that never occurred
Red Flags
• Unusual increase in assets – mask fictitious revenues
• Missing customer records (e.g., physical address and phone
number)
• Unusual changes in ratio patterns (e.g., spike in re
venue
with no corresponding increase in accounts receivables)
Source: Financial Statement Fraud: Detecting the Red Flags
Fraudulent financial misreporting

66
Red Flags
• Recurring negative cash flows from operations, while
reporting earnings growth
• Invoices and other liabilities go unrecorded in the
company’s
financial records
• Writing off loans to executives or other parties
• Failure to record warranty-related liabilities
Fraudulent financial misreporting
3. Concealed liabilities
• Improper or under-reporting of expenses and other li
abilities
• Shifting expenses from one entity to another or reclassifying liabilities as assets
Source: Financial Statement Fraud: Detecting the Red Flags

67
Red Flags
• Disclosure notes are so complex that it is impossible to
determine the actual nature of the event or transaction
• Discovery of undisclosed legal contingencies
• Nondisclosure of pending litigations or other contin
gent
liabilities
Fraudulent financial misreporting
4. Inadequate disclosure
• Often used after a financial fraud has occurred in a
n attempt to conceal it
Source: Financial Statement Fraud: Detecting the Red Flags

68
Red Flags
• Unusual or unexplained increases in the book value of
assets (e.g., inventory, receivables, long term assets)
• Odd patterns in relationships of assets to other com
ponents
of the financial report (e.g., sudden changes in the ratio of
receivables to revenues)
• GAAP violations in recording expenses as assets
Fraudulent financial misreporting
5. Improper asset valuation
• Common form of profit manipulation
S
ource: Financial Statement Fraud: Detecting the Red Flags

69
1. Misappropriation of assets can be accomplished in a
variety
of ways:
• Embezzlement of receipts
• Stealing physical or intangible assets
• Causing an entity to pay for goods and services n
ot received,
etc.
2. Misappropriation is often accompanied by false or misleading
records or documents in order to conceal the fact that the
assets are missing”
Misappropriation of assets
Misappropriation of assets involves the theft of an entity’s assets and is
often perpetrated by employees in relatively small and immaterial
amounts.
70
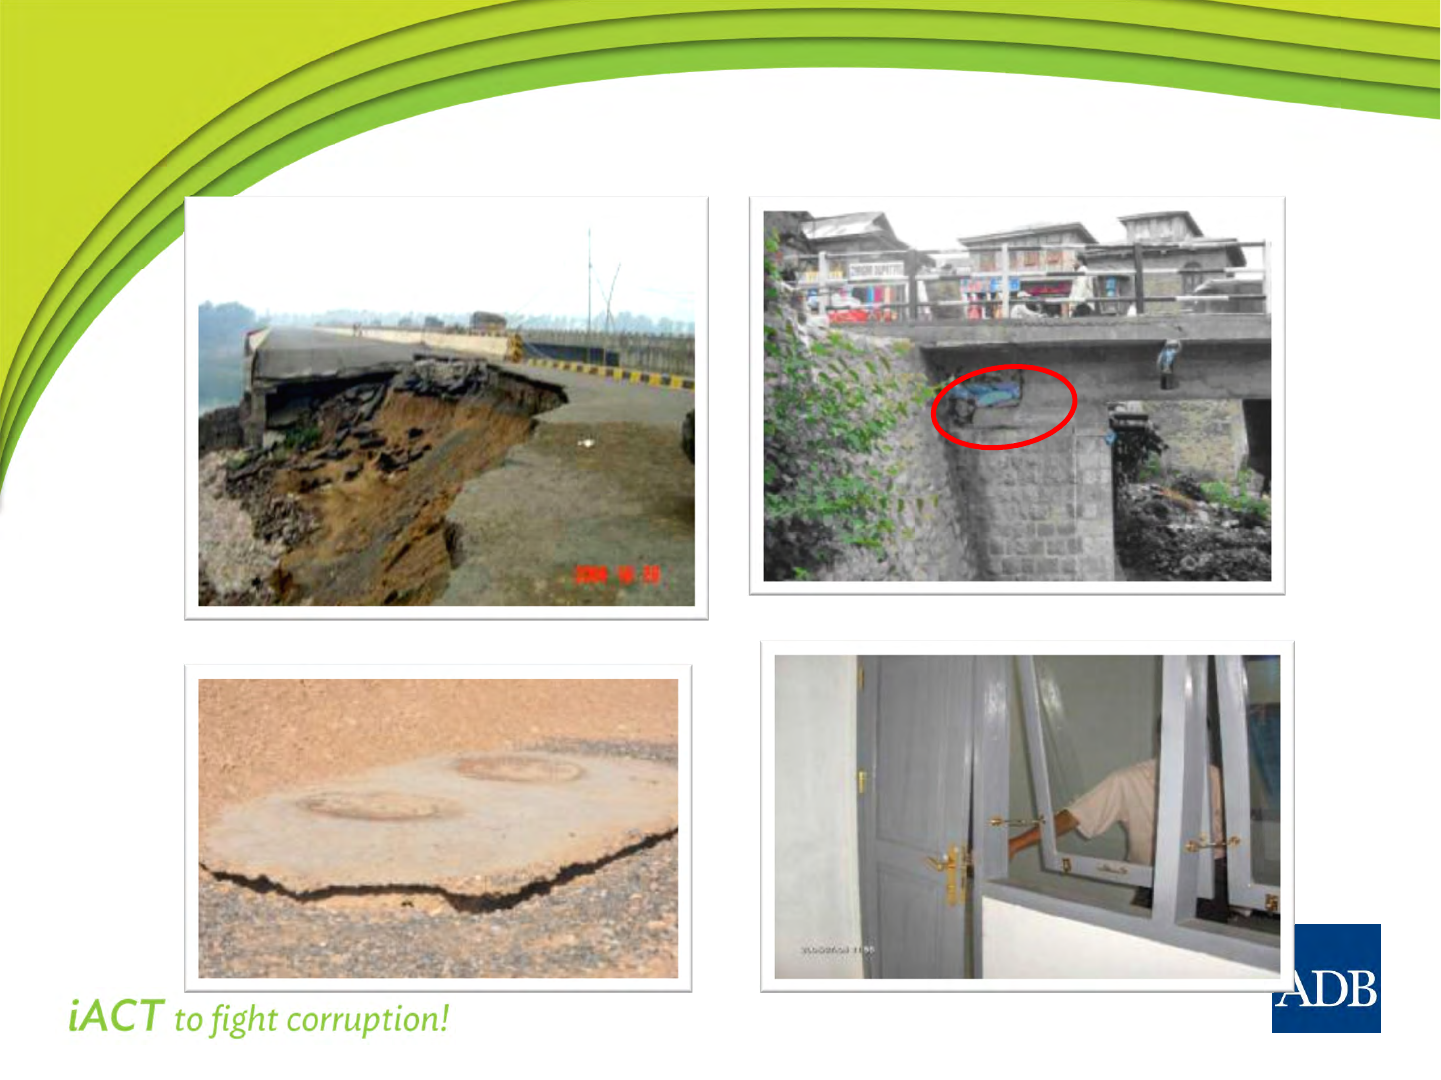
Impact of fraud in the development sector

71
Impact of fraud in the development sector
(
contd.)
