
Agile Critical Chain
LIVE or How to Get
the Foot in the Door
2017-12-14, TOCICO, Webinar

Wolfram Müller
• 20 years experience > 530 projects
• Medical technology > construction + process optimization
+ project management
• Project Office > 1&1 + GMX + web.de > over 500 projects
• CCPM and Advanced Agile implementations
• Deputy head of expert group „Agile Management”
of the Association for Project Management Germany
• Book author:
speed4projects.net/downloads/buecher/

• 2002 first experience with agile methods
(eXtreme Programming in IT Teams)
• 2008/09 first successful big agile projects (USA1, ADSL2+)
• 2010 first hybrid CCPM + Agile single projects (Freenet)
• 2012/13 Advanced Agile methods (beyond scrum/Kanban)
3. Generation (simplified Drum-Buffer-Rope)
• 2013 first hybrid multi project management
implementations (e.g. BOSCH, Festo, E+H, R. Wolf)
• 2014 Optimized speed and sustainability of the
change process using self-organization (QuiStain®)
Why am I here?


additional information …
Where can I get – the excel to manage WIP and
Fevercurve for agile teams?
http://reliable-scrum.de/ and “downloads” here
you’ll find the current version and some more stuff
What CCPM Software supports the concepts of
Agile/Taskboards?
(1) Being Management 3 http://beingmanagement.com/ - here you can
find also the white paper of Koichi Ujigawa – we share the same ideas
(2) Lynx from A-Dato http://www.a-dato.com/tameflow-scrum-kanban/
- they were the first who implemented the full stack like described on
the TOCICO 2013 in Bad-Nauheim

what is this thing called AGILE …?
… literally
… a mind set
• focus on the people they are good and valuable
• focus on the customer value integrate the customer
• focus on delivery often and get feedback
• embrace change use the feedback

… so why this webinar?
• in CCPM there was something missing
the subtask management on team level
• if we come into a company – AGILE is always there
the marketing of AGILE was much better
the customer ask for AGILE, the people want to be agile
to get the foot into the door
it is necessary to add the
subtask management
& and call it agile

How-Tos – the TOC-Templates – The Big Picture
Production
„DBR/sDBR“
Multi Project
„CCPM-VD“
Supply
Chain
„DDMRP“
pull
Distribution
Single
Project
„CCPM-BM“
Agile
Project/
Releses
One Piece
Flow Boards
Tame Flow
Managemnt
Win-Win-
Solutions
QuiStain®-
able Change
Thinking
Processes
Sales „The
Machine“
Throughput-
Accounting
„TA“
Throughput-
Selling
T-Innovation

Template „Production“ DBR, sDBR

• Characteristic
– many - more or less independet well known „work orders“
– touch time / lead time << 10%
• Control Parameter:
Work in Process (WIP) @ a „real“ constraint
• Order Parameter:
Buffer Consumption (BC) = already consumed lead time
The System Production

• Drum-Buffer-Rope (DBR)
– one real constraint, one buffer, release orders triggered by the
constraint
– The constraint capability synchronizes due date
– The signal (priority) is the already consumed lead time
– Lead time divided in three zones – green-yellow-red-(black)
Simple System: Production/Supply-Chain
release
assemblycontraintbuffer
signal =rope
=drum


Template „Single Project Management“ CCPM-BM
• Characteristic
– individual endeavor – high risk – fixed due date
– very hard connected tasks with high deviation
– touch time / lead time >> 20% ideal near 90%
• Control Parameter:
longest critical chain of work packages
• Order Parameter:
Longest Critical Chain Completed (LCC) / Buffer
Consumption (BC)

• Desynchronization and
buffers within every work
package are typical
• Transparent project buffer at
project end; reduce all
durations
• Report remaining time daily
• „Traffic lights“ indicate buffer
consumption
• Traffic lights = operational
priority
• Portfolio should be <10% red
• Result:
– Actual traffic light status
– Synchronised priorities
– >95% due dates met
#2 Synchronisation, operational priority
buffer
50%
Local optimisation
Unclear, changing status
Unclear operational priorities
Everybody plans with buffers
Daily feedback
of open work
Packages through
team/group-leader
Buffer consumption
progress
Portfolio
Tasklist
Traffic lights =
operational
priority for everyone
<10% red

A CCPM Project Plan

Fever Curves – Worst Examples (from the beginnings)


Template „Mulit Project Management“ CCPM-VD
• Characteristic
– many more or less independent initiatives
(projects)
– connected via shared resources or shared
critical project phase
• Control Parameter:
Work in Process (WIP) @ a „virtual“
constraint
• Order Parameter:
percentage of red projects in the portfolio

• Complex systems have
just one control point
- the constraint
• 5 focusing steps
• 4 Bottleneck levels
• Stagger projects
Results:
– Meet due dates
– Transparent capacities
– Lead-time decreases
– Throughput increases
#1 Minimise WIP, Set Strategic Priorities
§1 Identify the constraint
§2 Decide how to use it optimally
§3 Subordinate to the decision
§4 Expand
§5 Next one, back to step 1
Market
Integration/
Concept phase
One team
One employee
Project #1
#2
Project #4
Pipeline Stagger
Project #3
5
10
Team A
Team D
Team F
Team G
100%
Auslastung
10
Team A
Team D
Team F
Team G
100%
Auslastung
10
Team A
Team D
Team F
Team G
100%
Utilised capacity

Common Situation …
100%
project
capacity
Load per Team
Teams
Situation:
• too much Work-in-Progress
• many resource conflicts
* real load distributen of a
real company

If the Constaint is not overloaded – no other team can be
overloaded!
100%
Solution:
• projects were paused until the constraint
is not overloaded any more
• overcapacity is getting transparent
ca. 30% resources
were found

Ressource Management Live

Worse – Better – Best Portfolio (Scatter Plot View)

Focus List – Buffer Consuming Tasks of Red Projects …
Portfolio of about 35-40 projects in parallel,
complex mechatronic innovation projects,
250 developer at three international sites


Template: One Piece Flow Boards

a „typical“ Task Board …
to prevent
him from
beeing
punished
a so
called
kanban
board
with a
lot of
WIP

Daily stand up …
1
2
3
4
The goal is to have fewer open tasks
than developers!
in this case there were 12 tasks open for 8 developer


Template
Agile & Reliable
Releases/
Work Packages
• System Characteristic
– many - more or less independent well
known „work orders“ (stories)
– release with a due date
• Control Parameter:
Work in Process (WIP) @ a „real“
constraint
• Order Parameter:
Burn-Down to Buffer Consumption (BC)

The right questions – the right solutions
• How big is your backlog really?
• How high is your throughput / velocity?
• How high is your probability of success in
reality?
1. 6-10 Sprints = one release
2. Stories assign to the release
3. Add missing stories
4. Catch up missing estimates
5. Split up big Stories (>42)
6. Chase MoSCoW across the Jordan
7. 3 point estimate backlog
8. determine true average velocity
9. 3 point estimate velocity

probabilty of success
worst real best
#2 velocity
*
convolution
operator
time
#3 probability over time
absolute
80%
reasonable
due date
#1 amount of story points
in the backlog
best real worst
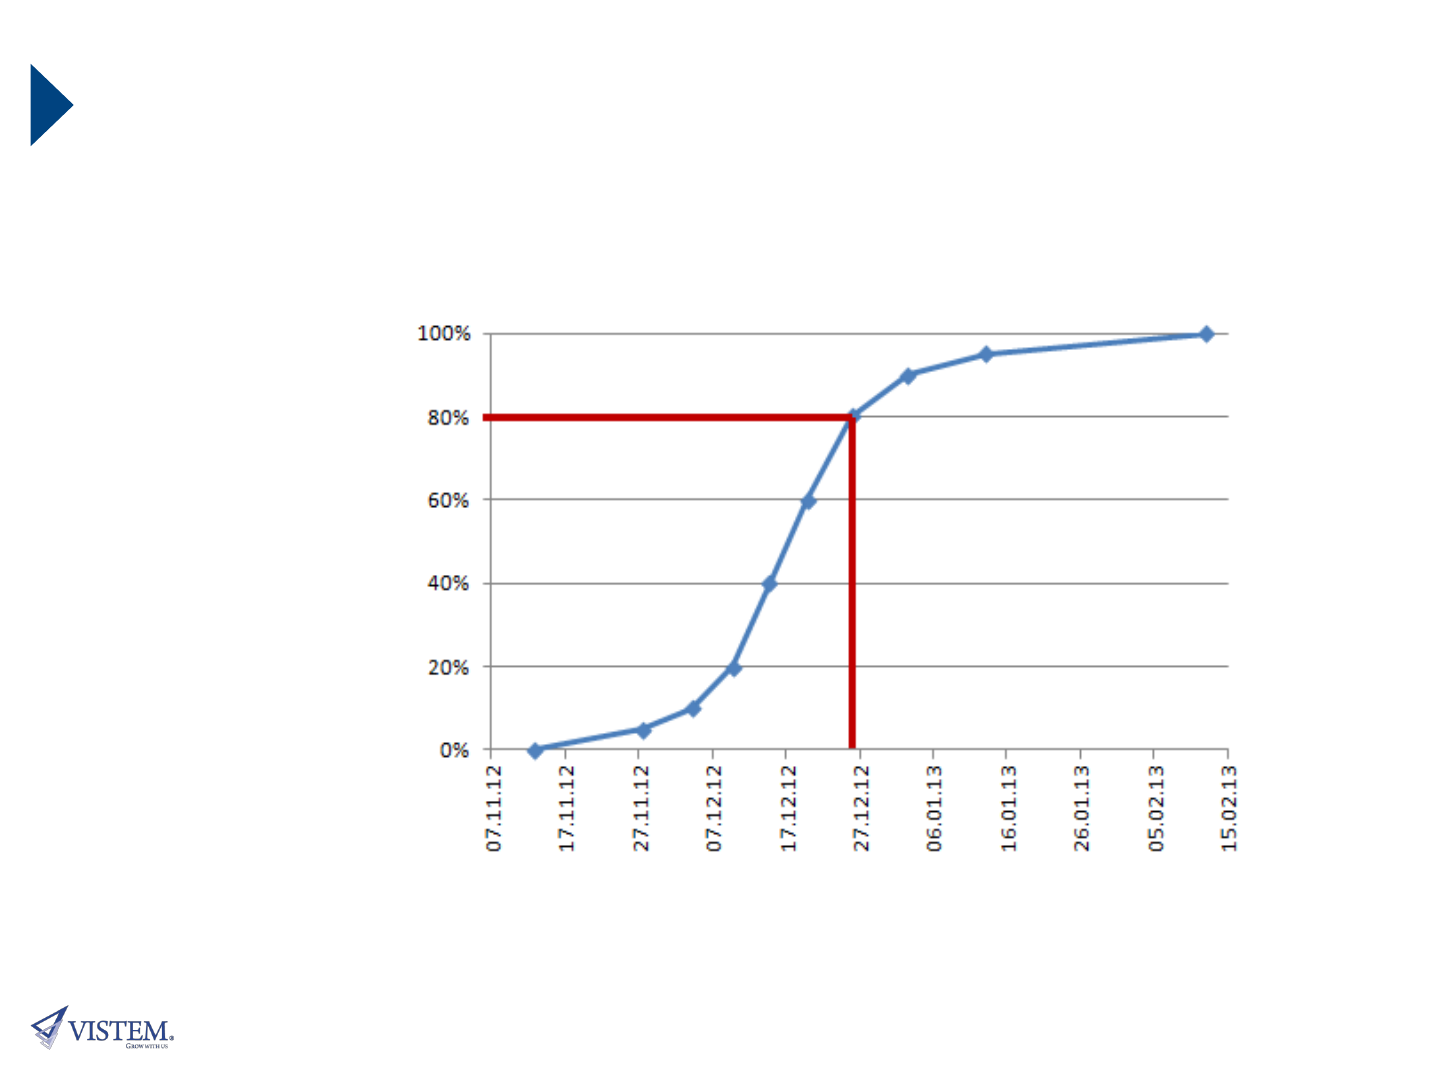
Probability of Success
Variables:
• Backlog
• Time
• Velocity
absolute probability of success

Likelihood of success
• Bring Stories in order according priority
• Keep cutting Backlog until 80% probability is achieved
• Bring stakeholders on board
• Negotiate deadline/resources/scope
until saleable product achieved
Team has sufficient
probability of success
Stakeholders know exactly
what they’re getting –
no ambiguity!

… Well? What‘s the status of your project?
• Watermelon green!

ooops – but there is a buffer!
with real probability of
success
a bit of buffer in the
backlog
a bit of buffer in the
velocity
a real project buffer
=

Progress > buffer consumption > traffic light
Progress >
buffer consumption
= green
Progress <
buffer consumption
= red

Scrum with traffic light …
• Burn-Down-Chart
with buffer
• Traffic light status
via progress
against buffer
consumption
product burn
down chart
56%
37%
estimated time
to completion
due date
progress
today
buffer
consumption

30%
25
%
In process …

35%
85%
In process …..

56%
37%
In process …….
Buffer
consumed
Progress

59%
82%
In process ………

72%
78%
In process ………..

80%
92%
In process ………….

93%
85%
In process ……………

100%
91%
In process ……………..

End result …
• Backlog = project order
clarified
• Stakeholders know what
they’re getting
• Transparency about progress
• Product Owner able to manage
• Fear eliminated – high velocity
0%
10%
20%
30%
40%
50%
60%
70%
80%
90%
100%
0% 20% 40% 60% 80% 100%
Pufferverbrauch
Fortschritt
Fieberkurve das Fallbeispiels
Sprint #5
Sprint #8
example of a fever curve
• in Sprint #5 started with
reliable scrum
• in Sprint #8 buffer reduced
because of too much speed
buffer consumption
progress (burn down)

one more fever chart …
… compared with burn down chart
Which of the diagrams show the urgency better?

Projektstatus nach Critical Chain
▪ Status = Fortschritt* zu
Pufferverbrauch
▪ X-Achse ist der Fortschritt auf
der kritischen Kette
▪ Y-Achse ist der
Pufferverbrauch
▪ die Kurve der zeitliche Verlauf
* anwendbar auf alle Vorgehensmodelle:
klassisches Projektmanagement, Critical Chain, SCRUM,
Kanban, Drum-Buffer-Rope, Burn-Down-Charts,
Controlling von Budgets
Pufferverbrauch
Fertigstellung auf kritischer Kette
0 – 10%
10 – 20%
20 – 30%
30 – 40%
40 – 50%
50 – 60%
60 – 70%
70 – 80%
80 – 90%
90 – 100%
0 – 10%
10 – 20%
20 – 30%
30 – 40%
40 – 50%
50 – 60%
60 – 70%
70 – 80%
80 – 90%
90 – 100%
01.06
17.06
27.08
22.10
Projektstart 01.06.09
Deadline im Projekt 10.11.09
Ende der kritischen
Kette (Plan-0)
12.10.09
Puffer 29 Tage
Länge kritische Kette 133 Tage

Fever Curves of Agile Projects …
The Wire – Android App
1&1 nTLD new Backend
Hip/Rain
STA UFix

more Examples …


Strategy & Tactics … step by step

How to “Build” a Rough Masterplan within a Day
• Simply ask them why will it
not work in your company
• These are the components
for your change plan!
• Help them structure it -
they will appreciate the
order ☺
• Connect it with the overall
(and their) goal
• THEY have developed a
rough masterplan within a
day!
• and did a perfect “build-
in”.
On the glass wall you see the
“Masterplan”


next Steps …
Extended
Analysis
• 1 day preparation and Interviews with key persons, validation of the
online analysis, learn your speech, rough solution design
• 2 days “challenging” of the solution design done by middle
management. “Build-in” of management including “Schulterschluss”
with top management
Business
Alignement
• 1 day preparation and interviews with management, learn about
current strategy/market, check financial figures
• 2 days intensive workshop with top management, knowledge transfer,
ensure 100% fitness to overall strategy, clarify Dos & Don‘ts
Develop
Masterplan
• 1-2 days training in methods and change process
• 3-4 days preparation and adjustment of the change plan
• detailed preparation of the first steps of the change – kick off
• clarification of the concrete project targets - KPIs
Implement-
ation
• support for the preparation of next steps
• audit of the correct implementation
• in case of deviations - support in finding correct root causes and
corrective actions
Stabiliza-
tion
• start of continuous improvement process
• audit of effective implementation
• fine tuning of the control mechanisms
• envision further improvement potential
Buy-In of middle management
and preparation of a valid decision
base to go further
individual and executable change
plan supported by all key players
after 6-12 weeks: significant
increase (approx. 20%-60%) of the
task completion rate
stable high performing multi
-project support system
certainty that the change will
effectively support the overall
growth strategy of the company


agile CCPM Product & Project Framework
Projekt #1
#2
Projekt #4
PIPELINE
Projekt #3
5
Stakeholder
„Priority Board“
Team
• Schnelles Feedback
zur Situation
• Im roten Bereich –
Fokus auf Puffer-
Wiedergewinn
• Befähigung zur
Eigenverantwortung u.
Selbstmanagement
• schnelle lokale
Verbesserung
Neue Projekte
today
56%
37%
Layer 1
Multiprojekt
Layer 2
Einzelprojekt
Layer 3
Agiles Team
Puffer Verbrauch
pro Team
fokussierter Kaizen
auf die
„Pufferfresser“
KVP
• Stakeholder
transparent
informiert
• schnelle Übersicht
• echter operativer
Status
• Vertrauen im Team
wird gestärkt

Richard Wolf
+80% more throughput
and full due date reliability
VISTEM Success Stories
Otto Fuchs
+60%
throughput
in two weeks!
“The performance of CCPM is already
visible after a few weeks. It shows better
results than the invest in project
management we did for 26 years.”
refurbishing of a big plant –
planned for 8 month, done
in just 4!
throughput in the
hosting area
increased by factor 3!
packaging machines
+33% more sales
with same costs!
project throughput doubles
and lead time reduced by
25% – with same costs!
Wire Swiss
+50% throughput in 2 weeks
– due date saved!
and more …

More Prominent Examples from Colleagues …
• Skype (Chris Matts)
• Haufe Lexware (Olaf Klöppel)
https://www.infoq.com/presentations/theory
-constraints-scale
http://www.apiacademy.co/resources/api36
0-microservices-summit-the-automated-
monolith/

Jeff Bezos … his favorite books …
Quelle: http://www.businessinsider.com/jeff-bezos-
favorite-business-books-2013-9

The VISTEAM (since 2008)
We learned to use the tools and ideas of the theory of
constraints in our daily business and we realized that they are
very powerful. Now we want to provide these knowledge to
others to be successful with it too.
Based on the invests of the past…
… with just a few ideas – making all the difference.
