
East Tennessee State University East Tennessee State University
Digital Commons @ East Digital Commons @ East
Tennessee State University Tennessee State University
Electronic Theses and Dissertations Student Works
8-2020
ACT Scores and High School Cumulative Grade Point Average as ACT Scores and High School Cumulative Grade Point Average as
Indicators of College Graduation at one High School in East Indicators of College Graduation at one High School in East
Tennessee Tennessee
Ariane Day
East Tennessee State University
Follow this and additional works at: https://dc.etsu.edu/etd
Part of the Educational Leadership Commons
Recommended Citation Recommended Citation
Day, Ariane, "ACT Scores and High School Cumulative Grade Point Average as Indicators of College
Graduation at one High School in East Tennessee" (2020).
Electronic Theses and Dissertations.
Paper
3791. https://dc.etsu.edu/etd/3791
This Dissertation - unrestricted is brought to you for free and open access by the Student Works at Digital
Commons @ East Tennessee State University. It has been accepted for inclusion in Electronic Theses and
Dissertations by an authorized administrator of Digital Commons @ East Tennessee State University. For more
information, please contact [email protected].
ACT Scores and High School Cumulative Grade Point Average as Indicators of College
Graduation at one High School in East Tennessee
________________________
A dissertation
presented to
the faculty of the Department of Educational Leadership and Policy Analysis
East Tennessee State University
In partial fulfillment
of the requirements for the degree
Doctor of Education in Educational Leadership, School Leadership
______________________
by
Ariane Sonia Day
August 2020
_____________________
Dr. Virginia Foley, Chair
Dr. Stephanie Barham
Dr. William Flora
Dr. Donald Good
Keywords: ACT, Bachelor’s Degree Attainment, College Readiness, High School GPA
2
ABSTRACT
ACT Scores and High School Cumulative Grade Point Average as Indicators of College
Graduation at one High School in East Tennessee
by
Ariane Sonia Day
The purpose of this quantitative study was to see if there was a significant difference in the mean
American College Test (ACT) scores and high school grade point average (HSGPA) between
students who attained a bachelor’s degree within 6 years of starting college and those who did
not attain a bachelor’s degree within 6 years of starting college. Data from 2005-2013 high
school graduates from one high school with only academic course choices were used. A series of
independent t-tests were used to compare the mean ACT scores and HSGPA of students from
both groups.
The goal was to find out whether high school educators can use existing high school data to
know whether students who intend to continue their postsecondary studies at degree granting
postsecondary institutions have the necessary preparation not just to be admitted to a
postsecondary institution, but to attain a bachelor’s degree. The results showed that for this group
of participants, the mean ACT scores and HSGPA were significantly different between students
who attained a bachelor’s degree within 6 years and those who did not. Using Cohen’s d to
calculate the effect size for the results, ACT Composite, ACT English, ACT Science, and
HSGPA were found to have a large effect size, and ACT Math and ACT Reading were found to
have a medium effect size. HSGPA had the largest effect size.
3
The implications from the results are that high school personnel at all high schools should
examine available data to see if it can be used as indicators of bachelor’s degree attainment with
the purpose of providing additional support to students who intend to pursue a bachelor’s degree,
but whose data indicate that they may not have the necessary preparation to successfully
complete a degree.
4
Copyright 2020 by Ariane Sonia Day
All Rights Reserved
5
DEDICATION
This work would not have been possible without the sacrifices of the people closest to
me:
• To my children Matthias, Janine, Kirsten and Luke, for picking up the slack while I was
pursuing this goal.
• To my husband Nathan, for loving me for the past 28 years, for believing in me, and for
supporting me always.
And in addition, it would not have been possible without the help, support, and
encouragement of many:
• To my parents, Edgar and Monika Affolter, for loving me and raising me to work hard
and not give up.
• To my uncle, Dr. Rolf Sutter, for being an inspiration in reaching this level of education.
• To Pat, for mentoring me and being my dear friend for the past 19 years.
• To the many extended family members, friends and colleagues who have encouraged me
on this journey by reminding me that I could do it when I struggled to believe in myself
and to find the motivation to keep going.
6
ACKNOWLEDGEMENTS
I would like to sincerely thank the members of my committee for their help and support
along the way. Thank you for your time and invaluable feedback throughout this process. Thank
you, Dr. Foley, for nagging me to finish and answering my many questions. Thank you, Dr.
Flora, for helping me brainstorm and refining ideas. Thank you, Dr. Good, for helping me with
the statistics and for your feedback. Thank you, Dr. Barham, for your feedback, kindness and
encouragement.
7
TABLE OF CONTENTS
ABSTRACT .................................................................................................................................... 2
DEDICATION ................................................................................................................................ 5
ACKNOWLEDGEMENTS ............................................................................................................ 6
LIST OF TABLES ........................................................................................................................ 10
LIST OF FIGURES ...................................................................................................................... 11
Chapter 1. Introduction ............................................................................................................. 12
Statement of the Problem ...................................................................................................... 13
Research Questions ............................................................................................................... 15
Significance of the Study ...................................................................................................... 16
Limitations ............................................................................................................................ 17
Delimitations ......................................................................................................................... 18
Definitions of Terms ............................................................................................................. 18
Chapter Summary ................................................................................................................. 20
Chapter 2. Review of Related Literature ................................................................................... 21
American College Test ......................................................................................................... 21
Grade Point Average ............................................................................................................. 23
High School Credits .......................................................................................................... 23
Quality Points ................................................................................................................... 25
8
Cumulative Grade Point Average Calculation .................................................................. 25
Importance of the ACT Score and HSGPA .......................................................................... 26
Bachelor’s Degree Attainment .............................................................................................. 32
Importance for Society ...................................................................................................... 32
Importance for Postsecondary Institutions ....................................................................... 33
Importance for Students .................................................................................................... 35
Importance for High Schools. ........................................................................................... 39
Purpose of High School and High School Accountability ........................................... 39
Recommended Areas of Improvement for High Schools ............................................. 41
Predictors of College Success ............................................................................................... 45
Chapter Summary ................................................................................................................. 53
Chapter 3. Methodology ............................................................................................................ 55
Research Questions and Corresponding Null Hypotheses ................................................... 56
Population ............................................................................................................................. 58
Instrumentation ..................................................................................................................... 60
Data Collection ..................................................................................................................... 60
Data Analysis ........................................................................................................................ 61
Chapter Summary ................................................................................................................. 61
Chapter 4. Findings ................................................................................................................... 63
Research Question 1 ............................................................................................................. 63
9
Research Question 2 ............................................................................................................. 65
Research Question 3 ............................................................................................................. 67
Research Question 4 ............................................................................................................. 69
Research Question 5 ............................................................................................................. 71
Research Question 6 ............................................................................................................. 73
Chapter Summary ................................................................................................................. 75
Chapter 5. Summary, Conclusions, and Recommendations ..................................................... 77
Discussion and Conclusions ................................................................................................. 80
Implications for Practice ....................................................................................................... 84
Implications for Further Research ........................................................................................ 87
Summary ............................................................................................................................... 88
References ................................................................................................................................. 90
VITA ........................................................................................................................................... 103
10
LIST OF TABLES
Table 1. Effect Size, Means and Standard Deviations for ACT Composite and Subscores for the
Two Groups ................................................................................................................... 83
Table 2. HSGPA Effect Size, Means and Standard Deviations for the Two Groups ................... 84
11
LIST OF FIGURES
Figure 1. ACT Composite Scores Distribution Between the Two Groups ................................... 64
Figure 2. ACT Math Scores Distribution Between the Two Groups ............................................ 66
Figure 3. ACT Reading Scores Distribution Between the Two Groups ....................................... 68
Figure 4. ACT English Scores Distribution Between the Two Groups ........................................ 70
Figure 5. ACT Science Scores Distribution Between the Two Groups ........................................ 72
Figure 6. HSGPA Distribution Between the Two Groups ............................................................ 74
Figure 7. Bachelor’s Degree Attainment Within 6 Years of Starting College ............................. 79
Figure 8. Years to Bachelor’s Degree Attainment for the Participants of the Study .................... 80
Figure 9. Distribution of ACT Score Means Between the Two Groups ....................................... 82
12
Chapter 1. Introduction
High school teachers prepare students for their postsecondary and professional endeavors
(ACT, 2005b; Barth, 2003; Cohen, 2001). High school graduation requirement are established at
the state level by members of the Tennessee State Board of Education (2017). Aside from
prescribed requirements, students may explore course options offered at their school from
vocational, Early Postsecondary Opportunities (EPSO) such as dual-enrollment and State Dual
Credit (SDC) courses, and elective courses among other offerings. Depending on the mission and
the location of the high school, students will have more or fewer choices and opportunities. For
the purpose of this study, the researcher looked specifically at students from one high school in
east Tennessee where only an academic completion pathway is offered. The expectation for
students attending this school is enrollment in a college or university after graduating high school
and complete a bachelor’s degree. Administrators and teachers of high school students who
desire to earn a bachelor’s degree need to be able to determine if students who satisfy the
requirements to earn a high school diploma are both ready to be admitted to college and able to
successfully complete a bachelor’s degree. Ideally, there should be a way for high school
educators to know with certitude that students are ready to pursue a bachelor’s degree and have
the background necessary to complete a bachelor’s degree based on data that are available when
students are in high school. The data most often used in Tennessee to determine college
readiness are the students’ cumulative High School GPA (HSGPA) and their ACT scores.
This is a study of all students who graduated from a small publicly funded college
preparatory high school in east Tennessee between 2005 and 2013, in total about 540 students.
Students who graduated from this school in May 2013 had 6 years to complete their bachelor’s
degree at a postsecondary institution by the time the researcher examined the data. In order to
13
only examine data from students who had up to 6 years to complete a bachelor’s degree, data
from the high school class of 2014 and subsequent classes were not used in this study. The
purpose of this study was to examine whether students who participated in a college preparatory
high school program of study earned a bachelor’s degree within 6 years of beginning
postsecondary studies. Six years represents 150% of the expected time it takes to complete a
bachelor’s degree from the time a student enrolls at a postsecondary institution and it is a
measure of accountability for postsecondary institutions in Tennessee (Tennessee Higher
Education Commission, n.d. a). In this study, the researcher used a series of independent t-tests
to determine if there was a significant relationship between the attainment of a bachelor’s degree
within 6 years and the data available for each student: ACT scores (both composite and
individual subscores) and HSGPA.
Statement of the Problem
High school educators of students who plan to attend college are preparing students with
the goal that they will be successful in college and obtain a bachelor’s degree as a result of
successful completion of bachelor’s degree requirements. Postsecondary success is measured by
completing the required program of study thereby earning a bachelor’s degree from a
postsecondary institution. Students who have earned a bachelor’s degree have been found to earn
a significantly higher income than students who did not earn a college degree (Barth, 2003;
Carey, 2005; Mayhew et al., 2016). Because of this gap in lifetime earning potential, there is a
need for high school teachers and administrators at all high schools to know whether students
who intend to complete a bachelor’s degree are adequately prepared while in high school to
successfully complete postsecondary programs of study and earn a bachelor’s degree. While not
all students intend to pursue a bachelor’s degree, the preparation needed to be ready for college
14
success will benefit students who chose alternative paths after high school (Barth, 2003). High
school graduation requirements and course standards in Tennessee public schools are set by state
lawmakers and in theory are implemented equally across all high schools in Tennessee. The
delivery of the content is in the hands of licensed teachers. Rigor and content, however, vary
from school to school and from classroom to classroom despite having set standards (ACT,
2005b; Adelman, 1999). Because of this discrepancy, there is a need for secondary school
teachers, counselors and administrators to have tools that measure how well students who want
to go to college are prepared for success at the postsecondary level. Students need to be prepared
not just to be admitted, but also to complete a bachelor’s degree. Two important student data
points that are available to teachers, counselors, and administrators in Tennessee at the secondary
level are student ACT scores and subscores as well as student GPA. Educators in the United
States consider those two data points important in determining postsecondary readiness. In an
effort to increase student college readiness, lawmakers in Tennessee enacted a law to provide
one free ACT administration to high school juniors starting with the 2007-2008 school year
(Tennessee Department of Education, 2018a). More recently, it became law that, beginning with
the 2018 high school graduation cohort, high school students in Tennessee were required to take
the ACT in order to earn a high school diploma (Tennessee State Board of Education, 2017;
Tennessee Department of Education, 2018a). The ACT test is administered during the school day
to all juniors at their respective high schools. In an effort to improve college readiness for
Tennessee high school students, the Tennessee State Board of Education added a second
administration of the ACT to all seniors in 2016, essentially giving students two opportunities to
take the ACT test at no cost to them (Tennessee Department of Education, 2018a). Taking the
test several times is recommended as research shows that 40% of students improve their score
15
when taking the ACT a second time (ACT, 2017b; Tennessee Department of Education, 2018a).
Student ACT scores are part of school accountability in Tennessee, but when students take the
ACT more than once, only the highest scores are taken into consideration in the calculation for
school accountability (Tennessee Department of Education, 2018b).
The HSGPA is a calculation where the weight of a course, the credit, is the divisor and
the success value, the quality points earned in that course, is the dividend. It is an easily
interpreted value that is almost universally used by secondary and postsecondary education
institutions in the United States (Volwerk & Tindal, 2012). Student HSGPA and ACT scores are
used at postsecondary institutions to determine admission to the institution, acceptance into more
competitive college programs, and eligibility for scholarships (Barth, 2003; Cimetta et al., 2010;
Volwek & Tindal, 2012). The researcher wanted to know whether these data points, ACT scores
and subscores and HSGPA, can be used by high school personnel as an indicator of whether
students are prepared to be successful at the postsecondary level as measured by the completion
of a bachelor’s degree.
Research Questions
The following research questions were designed to frame the analysis of data for
determining differences between bachelor’s degree attainment and the following high school
student data: ACT Composite scores, ACT Math subscores, ACT Reading subscores, ACT
English subscores, ACT Science subscores, and HSGPA.
RQ1: Is there a significant difference in the ACT Composite scores between students
who completed a bachelor’s degree within 6 years of starting college and students
who did not complete a bachelor’s degree within 6 years of starting college?
16
RQ2: Is there a significant difference in the ACT Math subscores between students who
completed a bachelor’s degree within 6 years of starting college and students who
did not complete a bachelor’s degree within 6 years of starting college?
RQ3: Is there a significant difference in the ACT Reading subscores between students
who completed a bachelor’s degree within 6 years of starting college and students
who did not complete a bachelor’s degree within 6 years of starting college?
RQ4: Is there a significant difference in the ACT English subscores between students
who completed a bachelor’s degree within 6 years of starting college and students
who did not complete a bachelor’s degree within 6 years of starting college?
RQ5: Is there a significant difference in the ACT Science subscores between students
who completed a bachelor’s degree within 6 years of starting college and students
who did not complete a bachelor’s degree within 6 years of starting college?
RQ6: Is there a significant difference in HSGPA between students who completed a
bachelor’s degree within 6 years of starting college and students who did not
complete a bachelor’s degree within 6 years of starting college?
Significance of the Study
Many studies have compared ACT Composite scores, ACT subscores, and HSGPA with
student success in college at various levels as well as with the ultimate earning of a college
degree (ACT, 2008b; Hein et al., 2013; Noble & Sawyer, 2002). However, the focus of many
researchers was not on the completion of postsecondary studies as measured by attainment of a
bachelor’s degree. Few studies have examined the relationship between high school student data
and attainment of a bachelor’s degree from a specific high school perspective and with the intent
to improve postsecondary preparation at the secondary level. While many students go to college

17
after finishing high school and complete one year or even more, not all students who begin
college do so with the intent to earn a degree (Bradburn, 2002). In this study, the researcher
examined students who graduated from one college preparatory high school that is a school of
choice, not the students’ designated Local Education Agency (LEA). Parents or guardians of
students had to apply for students to attend this high school and understood that the goal of this
high school is to prepare students to continue their studies at the postsecondary level. The goal
for students to complete a bachelor’s degree was evident by the lack of vocational class offerings
that would allow students to explore career choices that do not require pursuing a bachelor’s
degree. Based on this information, the assumption was made that the expectation was for
students to enroll in a college or university after graduating from high school with the intent to
complete a bachelor’s degree.
Tennessee’s high school graduation requirements were revised in 2017 (Tennessee State
Board of Education, 2017). The revised requirements match recommendations from ACT of the
high school coursework necessary for students to have an increased probability of completing
college with a bachelor’s degree. According to Barth (2003), 80% of high school students plan to
go on to college after high school. High school teachers, counselors and administrators need
indicators to determine if they are preparing students to be successful in college.
Limitations
This study was limited to examining student HSGPA, highest ACT Composite score and
highest ACT subscores, and bachelor’s degree attainment within 6 years of high school
graduation. In this study, the researcher did not take into account other student factors that are
known to improve or diminish bachelor’s degree attainment rates. Because the ACT is a
nationally normed test, academic exposure factors that affect student postsecondary preparation
18
before college would be reflected in their scores. The better the academic preparation in and out
of the classroom, the better the ACT scores. Another factor that is not considered is the
graduation rate of each postsecondary institution. Joy (2017) compared predicted bachelor
attainment rates to actual bachelor attainment rates and found that some postsecondary
institutions have better success graduating students than others regardless of students’ prior
preparation. According to the National Center for Educational Statistics (2019) and the U.S.
Department of Education (2019), the overall rate of bachelor attainment for full-time students
was 60%. However, there were many variations depending on the institution. Private for-profit
institutions had the lowest graduation rates with 20% for women and 22% for men. Institutions
with the lowest acceptance rates and the highest selectivity had the highest graduation rates with
87%. Non-selective institutions also had a low graduation rate at 31%.
Delimitations
For this study, data from students attending one small high school in east Tennessee were
used. Factors that affected college graduation rates that may have only been present at this one
high school are inevitable.
Definitions of Terms
In this study, specialized educational vocabulary for secondary and postsecondary levels
were used. It is important to understand the following terms as they related to this study:
• ACT Composite score: The American College Test, or ACT as it is now called, is a
college admission’s test that is accepted by all 4-year colleges and universities in the
United States (ACT, 2018). The ACT test is not an IQ or aptitude-based test. Instead it
measures what students have learned in high school in the areas of math, English, reading
19
and science. The highest possible ACT Composite score is a 36, and it is an average of
the 4 tested areas.
• ACT subscores: the ACT measures students’ knowledge in 4 areas: math, English,
reading, and science. Each area receives an individual score, which are called subscores,
with the highest possible score being a 36.
• Bachelor’s degree: a bachelor’s degree is a postsecondary degree awarded for successful
completion of undergraduate studies in postsecondary institutions, specifically colleges
and universities, and it is the difference between being enrolled as an undergraduate
student or a graduate student (Wallace, 2009). A bachelor’s degree typically takes about
4 years to complete but can be completed faster or slower depending on how many
credits a student completes during a semester among other factors.
• High school cumulative unweighted grade point average: a number on a scale of 4 that
represents students’ overall success in their high school classes over the span of their high
school career. In courses where students earn credits, a letter grade from A to F is
assigned to quantify how well students have learned the material of the course (U.S.
Department of Education, 2008). Tennessee has set a grade scale for secondary schools
where an A represents a percentage grade of 93%-100%, a B is 85%- 92%, a C is 75%-
85%, a D is 70-74% and an F is 69% or below (Tennessee State Board of Education,
2017). To calculate a grade point average, each letter is assigned points on a four-point
scale: a grade of A equals 4 points, B equals 3 points, C equals 2 points, D equals 1 point,
and F equals 0 points. The points are then added, and the total is divided by the total
number of attempted credits (a failed course is still an attempted credit) resulting in a
cumulative unweighted grade point average (U.S. Department of Education, 2009).
20
Chapter Summary
There is a need for teachers, counselors and administrators at secondary schools to know
how well they prepare students for their next step after graduating from high school, whether
they plan on continuing their studies at a postsecondary institution or not. ACT (2005a; 2005b;
2008b) has identified what courses have the best results in preparing students for college and
work, and the Tennessee State Board of Education (2017) has increased the high school
graduation requirements to included many of those recommended courses. ACT scores and
HSGPA are two data points that are available statewide in Tennessee. The researcher wanted to
know if these data points can be used by teachers, counselors and administrators to determine
student readiness to complete a bachelor’s degree, especially in a school that offers only a
college preparatory path. This study is significant because while many studies have examined
ACT scores and HSGPA in relation to college success, that success was most often measured in
terms of year to year retention and not bachelor’s degree attainment. The participants of this
study were graduates from a small college preparatory high school in east Tennessee.
21
Chapter 2. Review of Related Literature
In order to understand this study, one must first gain an understanding of what the ACT
and HSGPA are, how they came to be, how they are calculated, and their current relevance. It is
also noteworthy to highlight the importance of the ACT and HSGPA when it comes to admission
to postsecondary institutions, scholarship eligibility, and other placement decisions based on
those scores. Looking at the reasons why attaining a bachelor’s degree is important and also
provides information for the relevance of this study. Finally, looking at the predictive abilities of
the ACT and the HSGPA as found in the literature provided the basis for this research.
American College Test
The American College Test (ACT) is a college admission test that is typically accepted
by 4-year colleges and universities in the United States (ACT, 2018). According to the U.S.
Department of Education (2016), the ACT was introduced in the 1950s as an alternative to the
Scholastic Aptitude Test (SAT) which was widely used as a college admission tool in the 1940s.
The SAT had begun being used in 1926 as a way to improve the objectivity of the college
admission process (Beale, 2012). Both the ACT and the SAT were commonly used since their
inception to the present day, and both have undergone changes since their inception. Beale
(1970) found that the importance of college entrance exams like the ACT and SAT grew
tremendously in the 1950s in an effort to make college admissions more efficient and based on
the idea that standardized entrance exams were more reliable than previous methods of
admission. Previous to this, the typical college admission was based on a review of high school
records, available test scores, recommendations, and interviews with the applicants.
22
According to ACT (2018), the ACT test is not an Intelligence Quotient (IQ) or aptitude-
based test. Instead, the ACT measures what students have learned in high school. The Tennessee
Department of Education (2018a) considers the ACT to be a national measure of student
readiness for postsecondary work and employment. Students are encouraged to choose more
challenging courses throughout their high school career to be better prepared for college (ACT,
2018). Critics of the ACT however, argued that it should not be used as a national measure of
student readiness because it assesses student mastery of a specific curriculum even though there
are no national standards and because the test is norm-referenced and does compare student
performances against other students (Atkinson & Geiser, 2009).
The ACT test is comprised of four areas that each receive a score, which are called
subscores. The four subscores are averaged into a composite score. The highest possible score
for any subscore and for the composite is a 36. There is also an optional writing portion of the
ACT test that receives a score between a 2 and a 12 which is not taken into consideration in the
composite score (ACT, 2018). For the purpose of this study, the optional writing test was not
considered because it was not consistently taken by students and because it was not factored into
the composite score.
The ACT is designed to give students and colleges a nationally normed score that can be
utilized to interpret a student’s level of readiness to meet the requirements for college readiness
(ACT, 2008a). The scores do not rank the students against one another, although students can
find state averages and national averages to which scores may be compared. The subscore
benchmarks indicating college success are currently set at 18 for ACT English, 22 for ACT
Reading, 22 for ACT Math and 23 for ACT Science (ACT, 2017a). Small variations in the
benchmark scores have happened due to renorming, as ACT sets those benchmarks based on
23
student performance in college classes (ACT, 2010). In 2010 for example, the benchmark for the
science subscore was 24 instead of the current 23, and the benchmark for the reading subscore
was 21 instead of the current 22 (ACT, 2010). A student meeting the benchmarks in each area
has a 50% probability of earning a B or higher and about a 75% probability of earning a C or
higher in the corresponding college course (ACT, 2010).
Grade Point Average
The HSGPA is the result of a division of earned quality points divided by attempted
credits. In order to understand what the HSGPA is, one must gain an understanding of what
credits and quality points are.
High School Credits
In the United States, the accepted measure of educational progress at the high school
level and at postsecondary institutions is the Carnegie Unit which is called “credit” (Silva et al.,
2015). In 1905, Andrew Carnegie donated $10,000,000 to create a pension fund for college
professors. This resulted in the creation of the Carnegie Unit so that the work of college
professors could be quantified, and it could be established who qualified for the pension. It
indirectly resulted in defining high school and college graduation expectations as a measure of
how much time students spent on a subject with the quality of students’ time being measured by
grades assigned by teachers and professors. At the high school level, one credit translates to 120
hours of instruction over the length of one school year (U.S. Department of Education, 2009;
Silva et al., 2015). At the postsecondary level, credit definitions vary from institution to
institution, but the U.S. Department of Education established a guideline to help accredited
institutions define what a credit is (East Tennessee State University, 2017a; Schulte, 2016). The
24
credit measure is used in the calculation of the Grade Point Average (GPA) and has become a
fundamental measure of the American educational system. At the postsecondary level, federal
financial aid can only be granted to students who attend institutions that use the Carnegie Unit
system of measurement of educational achievement (Schulte, 2016; Silva et al., 2015).
Standardization of expectations allowed high schools and colleges to have a workable measure
that facilitated recognizable achievement, but there is still much variation in student achievement
due to rigor differences and professional freedom from one professor to another and from one
institution to another. According to Silva et al. (2015), postsecondary institutions often reject
transfer credits from other institutions, which reflects that the credit is not a good measure of
achievement and lacks details of the actual achievements of the student. The Carnegie Unit is a
measure of time investment and does not have a standard measure of the outcome in terms of
achievement or student competency.
Postsecondary institutions set graduation requirements for their undergraduate and
graduate programs based on successful completion of required courses and the completions of a
set number of credits. At the secondary level, states implemented requirements for high school
graduation. The U.S. Department of Education (2009) reported that from 1990 to 2009, the
average total of credits earned by high school students rose from 23.6 to 27.2. Tennessee for
example requires a minimum of 22 credits to graduate, with specific requirements: 4 credits of
English, 4 credits of math with at least one above the Algebra 2 level, 3 credits of science, 3
credits of science, 3 credits of social studies, 0.5 credit of personal finance, 1 credit of Wellness,
0.5 credit of physical education, 2 credits of the same foreign language, 1 credit of fine arts, and
3 credits of elective focus courses (Tennessee State Board of Education, 2017). In 2009, the U.S.
Department of Education defined three levels of high school curricula and discussed the
25
preparations required at the different levels. A curriculum requiring four credits of English, three
credits of mathematics, science, and social studies respectively is considered standard. A
midlevel curriculum requires four credits of English, three credits of mathematics which include
Algebra 1 and Geometry, three credits of science which include two of either Biology,
Chemistry, or Physics, three credits of social studies, and one credit of a foreign language. A
rigorous curriculum requires four credits of English, four credits of mathematics which include
Pre-calculus or a higher level, three credits of science which include Biology, Chemistry and
Physics, three credits of social studies, and three credits of a foreign language. In 2009, 75% of
high school graduates completed a curriculum that was at the standard level or above (U.S.
Department of Education, 2009).
Quality Points
In courses where students earn credits, a letter grade is assigned to quantify how well
students have learned the material of the course (criterion-referenced) or how the students rank
against either other in the course (norm-referenced) (U.S. Department of Education, 2008). With
either norm-referenced or criterion-referenced, it is common knowledge that letter grades from A
to D signify that the students have passed the course and earned the credit. A grade of F signifies
that the students did not pass the course, and that no credit was earned.
Cumulative Grade Point Average Calculation
To calculate a grade point average, each letter is assigned quality points on a four-point
scale for unweighted GPA calculations and on a five-point scale for weighted GPA calculations:
a grade of A equals four points (five points for weighted calculations), B equals three points
(four points for weighted calculations), C equals two points (three points for weighted
calculations, D equals one point (or two points for weighted calculations), and F equals zero
26
points for both weighted and unweighted calculations since no credit is earned with an F. The
points are then added together, and the total is divided by the total number of attempted credits (a
failed course is still an attempted credit) resulting in a cumulative grade point average (Uribe &
Garcia, 2012; U.S. Department of Education, 2009).
Importance of the ACT Score and HSGPA
For college admission purposes, prestigious postsecondary institutions relied heavily on
high school performance as reported by the HSGPA and class ranking (Uribe & Garcia, 2012).
High school students aspiring to attend postsecondary institutions took college entrance exams,
either the ACT or the SAT (Southern Regional Education Board, 2014; U.S. Department of
Education, 2016). For students, parents, secondary and postsecondary institutions, the ACT was
an easily understood number that corresponded to the likeliness of students performing well in
basic college courses (ACT, 2005b; Southern Regional Education Board, 2014; Tennessee
Department of Education, 2018a). According to Barth (2003), in order to make admission
decisions many postsecondary institutions want to see nationally normed student data such as
ACT scores in addition to class ranking and grade point average. More recently, many public and
private postsecondary institutions have changed their admission policies to no longer requiring
minimum scores on the ACT or SAT for college admission (Furuta, 2017; Southern Regional
Education Board, 2014). For postsecondary institutions that were less selective and that may not
have required a minimum entrance exam for general admission, these data points were still used
for admission into selective programs such as nursing and physical therapy for example (Cimetta
et al., 2010). In stark contrast to postsecondary institutions stepping away from college
admission testing, the state of Tennessee made taking the ACT a graduation requirement for high
school students (Tennessee Department of Education, 2018a, 2018b). Of the 16 states who were
27
members of the Southern Regional Education Board, Tennessee and five other states added ACT
or SAT scores as a part of school accountability formula in the area of college readiness
(Southern Regional Education Board, 2014). The Tennessee Department of Education’s (2018a)
goal was to increase the number of students who graduated from high school ready for their next
step, whether it be more education or employment, and the ACT was the chosen measure to
determine that readiness.
Entrance exam scores such as the ACT and SAT are not only used to determine
admission, they are also used to determine eligibility for scholarships and scholarship retention
(U.S. Department of Education, 2016). To understand how this affects students from the eastern
Tennessee region, admission requirements and scholarship criteria for 13 local public and private
postsecondary institutions awarding bachelor’s degrees were examined. The following
institutions both inside and outside of the state of Tennessee were researched: East Tennessee
State University, Lincoln Memorial University, Milligan College, Tusculum University, King
University, Lipscomb University, Belmont University, Vanderbilt University, Appalachian State
University, Middle Tennessee State University, The University of Tennessee, Knoxville,
University of North Carolina, Ashville, and Western Carolina University. While these
institutions were not necessarily representative of all postsecondary institutions across the United
State, they were examples of small and large institutions, public and private, and were
representative of institutions that students from eastern Tennessee were likely to attend.
The following information pertaining to admission and scholarship requirements was
gathered:
28
• All 13 postsecondary institutions researched required students to submit an ACT or SAT
score for admission whether the use of the score (admission, scholarship, remedial
placement) was specified or not.
• Four out of the 13 institutions required a minimum ACT and HSGPA for regular
admission (East Tennessee State University, 2017b; Lincoln Memorial University, 2020;
Milligan College, 2020a; Tusculum University, n.d.).
• Nine of the 13 institutions did not have minimum admission requirements in terms of
benchmark ACT scores and HSGPA. The following institutions did reference ACT
and/or GPA in their admission information:
o A preference in terms of ACT score and HSGPA for admission as a first-time
college student was listed for admission to King University while not required
(King University, 2020).
o Lipscomb University (2020) displayed an average HSGPA of 3.78 for freshmen
admissions.
o Belmont University (n.d.) explained that applicants rank in the top half of their
graduating class and that there needed to be a strong correlation between
standardized test scores and high school grades.
o Vanderbilt University (2020) listed profile information for the Fall 2019 freshmen
admissions. The admission rate of all first-time freshmen applicants was 9.1% and
the admitted students had an ACT middle 50% range of 33 to 35 score for the
2019 freshman class.
29
o Appalachian State University (2020) also listed profile information for the Fall
2019 freshmen admissions. The middle 50% range of admitted freshmen were an
ACT of 23-28 and a weighted HSGPA of 3.94-4.48.
• Three of the 13 institutions noted that the scores on the ACT and SAT would be used to
determine placements in classes. East Tennessee State University and Middle Tennessee
State University use the ACT score for placement in Learning Support Classes for math
and English courses (East Tennessee State University, 2017b; Middle Tennessee State
University, 2020a). Students with scores below an 18 on their ACT English subscore, or
below a 19 on their ACT Reading or ACT Math subscores are required to enroll in
learning support courses. At East Tennessee State University, these classes are regular
education classes but are designed to provide additional support to students in their area
of identified deficiency and require participation in a learning lab (East Tennessee State
University, 2020a). At Middle Tennessee State University, the prescribed classes are
additional classes that count as elective classes or count as general education requirement
(Middle Tennessee State University, 2020b). The University of Tennessee, Knoxville,
uses students’ ACT Math scores to determine math prerequisites. If a student’s program
requires a specific math course, but the student’s placement level is below that class, they
will need to take their identified prerequisite before being able to take the required math
(The University of Tennessee, 2020c).
• The University of Tennessee (2020b) and the University of North Carolina Asheville
(2020) listed no benchmark requirements for regular admission in terms of ACT score or
HSGPA and did not list average demographics of their incoming freshmen in terms of
ACT Composite score averages or HSGPA averages.
30
• Western Carolina University (2020) did not list benchmark score requirements but had
benchmark requirements of 4.0 HSGPA and 30 ACT score to be admitted to the honors
college.
Scholarships were merit-based by the fact that they use ACT or SAT scores as well as
HSGPA for initial eligibility. Duffourc (2006) reviewed state-funded scholarships that were
available at the time of her publication. Of the 14 state-funded scholarships, 11 had a minimum
ACT or SAT requirement for eligibility and 10 had a minimum HSGPA requirement. In
Tennessee, the Hope Scholarship was a state operated merit-based scholarship that was first
awarded in the fall semester of 2004 (Tennessee Higher Education Commission, 2013). High
school graduates were eligible for the Tennessee Hope Scholarship if they had either a 21 ACT
Composite score, or a 3.0 HSGPA (Tennessee Higher Education Commission, n.d. b). In
addition to the Hope Scholarship, students who had a 3.75 or higher HSGPA and a 29 or higher
ACT Composite score were eligible for the General Assembly Merit Scholarship (GAMS).
Individual institutions also offered a range of scholarships, merit based and need based. Some
examples of merit-based scholarship were:
• East Tennessee State University (2020b, 2020c) offered the Academic Performance
Scholarship with varying levels of award depending on eligibility based on ACT
Composite scores and HSGPA.
• East Tennessee State University (2020d) offered a selective Honors College Scholarship
with a minimum ACT Composite score requirement of 29 and a 3.5 or above unweighted
HSGPA.
31
• The University of Tennessee (2020d) offered the Volunteer Scholarship with varying
levels of award depending on ACT/SAT Composite scores, beginning with an ACT score
of 28.
• Milligan College (2020b) offered Academic Merit Scholarships of varying award
amounts depending on eligibility based on ACT Composite scores and HSGPA.
As highlighted by these examples, student ACT scores and HSGPA were found to be of high
importance at many colleges and universities for admission purposes and for scholarship
eligibility. Fields and Parsad (2012) found that postsecondary institutions solely use college
readiness test scores to determine placement in remedial classes. This was evident in 3 out of the
13 postsecondary institutions researched and referenced above. East Tennessee State University
used the ACT English, ACT Reading and ACT Math subscores for placement in Learning
Support courses (East Tennessee State University, 2020a). The University of Tennessee (2020a)
determined students’ mathematical level using the ACT Math subscore and mandates
prerequisite courses based on the identified level. While only three listed the use of ACT scores
to determine course placement, all required ACT or SAT scores for admission, and more could
be using these scores for placements while not actually publishing this on their admission
information pages. The reliance on a single data point to make the determination for remedial
placement increases the likelihood of student being placed in remedial classes when they did not
need to be, thereby potentially adding time and cost to students’ attainment of a bachelor’s
degree. Hodara and Lewis (2017) reported that community colleges are changing their policy on
remedial course assignments to include multiple data points.
32
Bachelor’s Degree Attainment
The research outlined in this section supports that the attainment of a bachelor’s degree
makes a significant difference in an individual’s qualify of life. The benefits do not stop there:
having more educated citizens has benefits for society as a whole. Postsecondary institutions also
benefit from students completing their programs of study and earning a degree.
Importance for Society
Stewart (2012) and Rolfhus et al. (2017) made the argument that earning a degree is
important not just for the student, but also for society as a whole. For society, having uneducated
citizens results in higher unemployment rates, which in turn results in a slower economy and
higher costs of law enforcement, prisons, and welfare. Educated citizens are more likely to be
employed, contribute more to the economy and pay more taxes, and raise healthier children
(Stewart, 2012). Carnevale and Desrochers (2002) reported that 60% of jobs are filled with
workers with some postsecondary training. Workers with a high school education or less
therefore have fewer opportunities at being hired for a job where they can make a living wage.
According to a policy report completed by ACT (2005a) in 2005, the prediction for 2008 was
that there would not be enough postsecondary graduates to fill the available jobs. The cost of
having uneducated citizens is more than the cost of investing in education to improve the
outcomes (Greene, 2000). Barth (2003) also argued that normal everyday life has gotten more
complicated and requires citizens to be able to reason at an increased intellectual level than
previously needed. Barth furthermore made the point that the preparation needed for college has
become more and more similar to the preparation needed to be successful in the workplace.
Additionally, education has been found to be an equalizer that closes the income gaps between
citizens of various ethnic backgrounds (Barth, 2003; Finn et al., 2015; French et al., 2015).
33
According to Barth (2003), 73% of African American students who begin postsecondary studies
with a strong high school preparation earn a bachelor’s degree. Conversely, less than half of all
African American students who begin postsecondary studies earn a bachelor’s degree. For Latino
students, 61% who begin postsecondary studies earn a bachelor’s degree, but for those who enter
college with an adequate preparation, 79% of them earn a bachelor’s degree. French et al. (2015)
found that when compared to white students with the same HSGPA scores, same school
characteristics and background characteristics, African American students do better in the formal
educational system as measured by degree completion.
Importance for Postsecondary Institutions
The importance of degree completion for higher education institutions has increased
recently with a shift toward a performance-based funding model and accountability based on
output such as degree completion (ACT, 2008b). Banta and Fisher (1984) found that the 1980s
saw a shift of evaluation of higher education institutions from input to an evaluation based on
output. Before this shift, universities’ success was evaluated by such factors as the number of
faculty members holding a terminal degree, library collection size, and money spent per student
among others, all of which are measures of how much an institution invests into its students. In
1979, the Tennessee Higher Education Commission began experimenting with funding based on
performance standards, which measure the impact that institution has on students. Tennessee
higher education institutions could earn an additional 5% of their state allocation for meeting set
performance standards (Banta & Fisher, 1984; Dougherty & Reddy, 2011). While the new focus
was not based on graduation rates, it was mostly based on program quality, student learning, and
the presence of a mechanism for stakeholder feedback and consistent improvement (Banta &
Fisher, 1984). Dougherty and Reddy (2011) established that there were two rounds of
34
performance-based funding, which they called Performance Funding (PF) 1.0 and 2.0. PF 1.0
funding models were established in the 1980s and 1990s in Tennessee, Florida, Ohio and
Washington. These programs were set up as incentives available in addition to the state
allocations already in place. Dougherty and Reddy (2011) established that what they call PF 2.0
funding models are different from the earlier versions. PF 2.0 funding models have performance
requirements that are a part of the state funding formula and are no longer a supplement to the
base funding. Increased accountability on 2-year and 4-year institutions have resulted in more
importance being placed on degree completion (Radunzel & Noble, 2012). Lawmakers across
the country are demanding justification of the public resource investments in higher education
resulting in an increased importance of graduation rates and other output measures rather than
enrollment numbers and other input measures (Dougherty & Reddy, 2011; Radunzel, 2012).
Tennessee implemented the first performance funding policy in 1979, and several states
followed this example (Dougherty & Reddy, 2011). Dougherty and Reddy reported there was an
initial implementation of performance funding policy which was recently replaced by revised
performance funding policies in each respective state. The initial policies have in common the
fact that they reward higher education institutions based on performance indicators with
additional funding. The updated and more recent policies include performance funding into
higher education funding policies and have actually resulted in reduction of overall funding in
some cases. In Tennessee, the revised performance-based funding policy was implemented in
2010 as the Complete College Tennessee Act. Since then, higher education funding is no longer
predominantly based on enrollment numbers. The new funding focus is on performance with
emphasis on course and degree completion (Dougherty & Reddy, 2011). Dougherty and Reddy
determined that there was not a significant increase in graduation rates stemming from
35
performance funding. However, performance funding did have impacts on higher education
institution policies. Braxton (2001) found that a high percentage of students who begin
postsecondary studies but leave before completing a bachelor’s degree caused problems for
institution budgets and public perceptions of the institution. Dougherty and Reddy (2011)
described several examples of policy changes attempting to alleviate the loss of students prior to
degree completion. These policies mostly fit into two categories. Some institutions pass students
through the programs whether they meet the standards or not, thereby weakening their academic
standards. Other institutions developed more selective admission policies in order to select only
students who met the qualifications necessary to be successful allowing the institutions to
maintain program quality but becoming more selective.
Importance for Students
It is general knowledge that it has become a necessity for students to earn some sort of
credentials beyond the high school diploma in order to compete for middle-class jobs that
provide a stable income (Carnevale & Desrochers, 2002; Jimenez et al., 2016; Joy, 2017; Kuh et
al., 2008; Rolfhus et al., 2017; Trusty & Niles, 2004). Barth (2003) found that a majority of high
school students planned on attending a postsecondary institution and earn a degree. ACT (2019)
found that for the 2019 high school cohort, 73% of graduates planned to continue their studies
past high school. For students, earning a bachelor’s degree increased the probability of
significantly higher income over their lifetime. According to Carey (2005), ACT (2005a), and
Carnevale and Desrochers (2002), individuals whose highest education level was a high school
diploma earned about half of what individuals who earned a bachelor’s degree earn. Individuals
who completed an advanced degree earned even more than individuals whose highest education
level was a bachelor’s degree (Carey, 2005). Mayhew et al. (2016) reported that individuals with
36
a bachelor’s degree earned 15% to 27% more than individuals without postsecondary education.
According to Barth (2003), students who did not complete high school earned $2,000 less
annually than high school graduates. High school graduates earned $4,000 less than students who
completed an associate degree, but about $18,000 less than students who earned a bachelor’s
degree. For every unemployed individual with a bachelor’s degree, there are two unemployed
high school graduates. Barth (2003) found that workers with a bachelor’s degree earned on
average $2.1 million over their careers compared to $1.2 million for workers whose highest
education level is a high school diploma. While there was a time when high school graduates
could find a job and work their way up internally to a better pay, today’s higher paying jobs
required additional education and training past the high school diploma from the get-go (Barth,
2003). Carnevale and Desrochers (2002) found that while in 1959, 20% of jobs were filled with
workers who had some postsecondary education, that number was up to 60% in 2002.
According to Tinto (1993, as cited in Braxton, 2001) about 25% of students attending a
4-year institution left during their first year. Bradburn (2002) reported that almost 20% of
students attending a 4-year institution left without completing a bachelor’s degree, more so
during the first year than during their second or third year. Bradburn (2002) found that not all
students who begin postsecondary studies at a 4-year institution were planning on attaining a
bachelor’s degree upon beginning their postsecondary studies which influenced whether they
completed a degree. Of the students who did not complete a degree, 40% did not plan on getting
a degree initially, but 16% did plan on completing a bachelor’s degree. Bradburn found that
students who did not have a regular high school diploma, did not have standardized test scores
(ACT or SAT), delayed their studies after graduating from high school, were part time students,
worked full time while attending college, had to take remedial courses, or had a GPA lower than
37
2.75 were significantly less likely to complete a bachelor’s degree. Trusty and Niles (2004)
studied a group of 3,116 students who were eighth graders in 1988, and who had academic
promise and planned to attain a bachelor’s degree after high school. Of the total participants,
64% attained a bachelor’s degree within eight years after graduating from high school. Trusty
and Niles found that the three most important factors that affected students attaining a bachelor’s
degree were the intensity of the high school preparation, the students' behavior while in high
school, and their socio-economic status.
When looking at the numbers of students not completing a degree, one must keep in mind
that other factors may affect the numbers. For example, Adelman (2006) made the argument that
researchers have not taken into account students who leave one postsecondary institution and
enroll in another. Adelman studied data from a national sample representative of the high school
class of 1992. He observed that of the 1992 graduating cohort, about 60% attended more than
one institution thereby questioning the validity of using college dropout rates as a valid measure
since students leaving one institution to attend another were not taken into account in the data.
Witteveen and Attewell (2017) studied data from almost 9,000 students who began
postsecondary studies at a 4-year institution in the fall of 2004 and accounted for students
changing institutions. They found that students who attained a bachelor’s degree within six years
had certain criteria in common: they varied the intensity of the course work from semester to
semester, and they also took less courses while taking more challenging classes. The students
who did not attain a bachelor’s degree did not show any variation in intensity from semester to
semester or lighter loads while taking more challenging courses.
There are many reasons students do not complete a degree (Kuh et al., 2008). One reason
is that they may graduate from high school underprepared for the expectations of postsecondary
38
work (Barth, 2003; Cohen, 2001; Jimenez et al., 2016; Kuh et al., 2008). Bradburn (2002) found
evidence that lack of preparation affects students completing a bachelor’s degree. Trusty and
Niles (2004) found that math preparation of at least Algebra 2 increased the potential of students
to meet their goal of attaining a bachelor’s degree by 73%. ACT (2005a) and Cohen (2001)
reported that of the 75% of high school graduates who enroll in postsecondary institutions,
almost 30% needed remedial courses (one or more) in math, reading and writing, before being
able to enroll in classes that count toward a degree. From the 1990s to the early 2000s, high
numbers of students enrolled in at least one remedial course (ACT, 2005b). Bailey et al. (2010)
found that 33% of students took remedial English courses and 59% took remedial math classes.
Silva et al. (2015) found that 60% of students attending community colleges take remedial math
classes. Barth (2003) argued that the reason that 25% of first-year college students do not return
for a second year of college is that 50% of college students have to take at least one remedial
course. Taking remedial classes adds more cost and time to the pursuit of a degree since those
classes do not count toward the attainment of a degree. Taking remedial classes has an adverse
effect on students completing the coursework necessary to earn a degree (Adelman, 2004; Barth,
2003; Cohen, 2009; Jimenez et al., 2016). Witteveen and Attewell (2017) found that the
percentage of students who took remedial English, math or other courses was higher for students
who did not complete a bachelor’s degree than for those who did. ACT (2005a) reported that of
the students who took remedial courses in reading, 70% did not earn a postsecondary degree.
For students who took remedial courses in math, 58% did not earn a postsecondary degree.
These statistics are even worse for some subgroups. According to Jimenez et al. (2016), while
35% of white students take remedial courses, the percentages for African American (56%) and
Latino (45%) students are higher, thereby reducing their likelihood of completing a college
39
degree. Jimenez et al. calculated the financial impact of remedial classes to be $1.3 billion per
year, a staggering cost that could be greatly reduced by increasing the college readiness of high
school students.
According to ACT (2005b; 2019) and Barth (2003), the reasons why students do not
complete a college degree can be synthesized into one main reason: the education students
received prior to entering a postsecondary institution did not prepare them for the demands and
expectations of postsecondary work. More than 70% of students graduating from high school
intended at one point or another to go on to college, but the reality is that they were not
adequately prepared to do so (ACT, 2005b; ACT, 2019; Barth, 2003).
Importance for High Schools
To understand the importance of this study for high school teachers, counselors and
administrators, it is important to understand the purpose of high schools. Barth (2003) found that
one of the problems for high school students and their parents is that many assumed that earning
a high school diploma equated with being ready for postsecondary expectations, which was not
always the case.
Purpose of High School and High School Accountability. The purpose of high school
is to prepare students for both the workplace and postsecondary educational opportunities
without the need for remediation (ACT, 2005b; Barth, 2003; Cohen, 2001). More and more, it is
becoming evident that graduates entering the workplace after high school need to be exposed to
similar curriculum and expectations as those entering postsecondary institutions so that they are
successful and enjoy a higher quality of life than less prepared high school graduates (ACT,
2005b; Barth, 2003; Cohen, 2001). Despite this need, many high school graduates lack the
preparation necessary for college as well as the skill necessary to succeed in the workplace
40
(Barth, 2003; Cohen, 2001). One of the problems leading to the lack of preparation, is that while
high schools offer the courses providing adequate preparation for postsecondary work and
continuing studies, these courses are not required to graduate from high school. As a result,
between 30% to 50% of students attending a postsecondary institution after high school did not
take these courses (Barth, 2003). According to Barth, failure to expose students who are not
college bound to foundations that prepare them for postsecondary training and learning is closing
the door to future opportunities. High school graduates might not immediately want to pursue
additional education and training, but as circumstances change and they want to better their lives,
the opportunities would be non-existent without strong foundational knowledge and skills. How
high school preparation is measured is also important because many postsecondary institutions
use both nationally normed tests such as the ACT or SAT for admission and scholarship
determination in addition to high school data such as transcript of coursework, grade point
average, and class ranking. Carnevale and Desrochers (2002) argued that there was a missing
link between secondary school preparation and what was needed to successfully complete
postsecondary education and enter the workforce. They found that this gap began in high school.
High school students preparing for college are taught disconnected academic subjects without an
understanding of the relevance and importance or the connections to postsecondary education
and employment. Students preparing for the work force are not exposed to the academic
background necessary to complete postsecondary education and training thereby closing the door
to future opportunities. Carnevale and Desrochers argued that there is a disconnect between
secondary and postsecondary education that negatively impacts students in their transition from
secondary school to postsecondary institutions or employment.
41
Recommended Areas of Improvement for High Schools. Finding out what high school
administrators, counselors and teachers can do to better prepare students to complete a bachelor’s
degree is important foremost for students. The benefits do not stop there, however. Society as a
whole, secondary and postsecondary education institutions benefit as well. Below are several
areas that secondary institutions can improve upon as discussed in the literature.
Barth (2003) found that while almost 80% of high school students expressed that they
wanted to attend a postsecondary institution after graduating from high school, high school
teachers thought that only about 50% of the students planned on continuing their studies. Barth
argued that there is a lack of communication to high school students and their parents about the
preparation necessary to be successful at the postsecondary level, resulting in students relying on
the high school diploma requirements as adequate preparation for postsecondary work. Barth
(2003) and Venezia et al. (2003) make the point that parents do not have a clear understanding
about the preparation needed to be successful in postsecondary institutions. Parents and students
mistakenly assume that graduating from high school equates to being ready for postsecondary
studies which is not always the case. High school teachers and counselors need to communicate
better with parents and students to inform them of the difference between high school graduation
requirements and college readiness. Trusty and Niles (2004) found that counselors have a crucial
role of helping individual students determine and plan for further education or career paths. ACT
(2008b) found that students who took both the PLANâ test in 10
th
grade and the ACTâ test in
11
th
and 12
th
grades have a high probability of enrolling in a higher education institution (ACT,
2008b).
According to ACT (2005a; 2005b; 2008b; 2017a; 2019), the more rigorous the
curriculum all students are exposed to, the higher their achievement on the ACT test, which
42
reflects their preparation for postsecondary expectations. ACT (2008b) also found that when
students take a more rigorous path, the gender and racial gaps for enrollment and success at
higher education institution are greatly reduced. ACT (2019) recommends a sequence of courses
that best prepares students for college level curriculum and leads to higher ACT subscores and
composite scores. The courses identified by ACT (2005a, 2005b) are: 9
th
, 10
th
, 11
th
and 12
th
grade English, Algebra 1, Geometry, Algebra 2 and at least one more math above the Algebra 2
level, Biology, Chemistry, Physics. Learning at least one foreign language and taking upper-level
math and science courses also benefit postsecondary preparation and result in higher ACT scores
(ACT, 2005a, 2005b). Taking Biology, Chemistry, Physics, and mathematics courses beyond the
Algebra 2 level give students the needed preparation to transition to postsecondary coursework
without needing to take remedial courses (ACT, 2005b). Getting students to take a college
preparatory course sequence while in high school is important. However, it is equally important
to examine the rigor of those courses. Even if students take these courses, the variation in rigor
from one school to another and even one teacher to another cause the outcomes in terms of
college readiness to greatly vary (ACT, 2005b; Adelman, 1999). The quality and rigor of high
school coursework directly affects college success (Adelman, 1999; Barth, 2003). Adelman
(1999) found that high school students who completed at least one math beyond the Algebra 2
level had a much better odds of earning a bachelor’s degree. The American curriculum is too
broad and disconnected compared to other countries scoring better than the United States on the
worldwide Trends in International Mathematics and Science Study (TIMSS) assessment (ACT,
2005a; Schmidt et al., 2002; Schmidt, 2005). Other countries like Japan and Germany teach
fewer topics but teach these more in depth allowing for a thorough understanding of the most
important topics rather than a shallow familiarity of important and less important topics alike as
43
is the norm in the United States (Schmidt et al., 2002; Schmidt, 2005). Barth (2003) also argued
that in the United States, there is a tendency to not believe that all students can master more
rigorous coursework. This is another reason why not all students take a rigorous set of courses
that would prepare them for postsecondary work. Research shows that this belief is flawed: low
achieving students perform better in higher level courses than they do in lower level courses.
The transition from secondary to postsecondary has been found to be difficult due to the
disconnect between what students learn in high school and what postsecondary institutions
expect students to know (ACT, 2019; Barth, 2003; Stewart, 2012; Venezia et al., 2003). Trusty
and Niles (2008) recommended collaboration between high school and college counselors in
order to help students prepare adequately for their chosen paths. Radford and Ifill (2016) found
that secondary school counselors have influence on high school students’ postsecondary plans,
and it is important that counselors work with students and their parents on postsecondary plans,
especially at-risk students such as underrepresented students and first-generation college-going
students. There is a need for alignment between what is taught in high school and what is
required for admission to postsecondary institutions and for program completion (ACT, 2008b;
Barth, 2003; Carey, 2005; Cohen, 2001; Venezia et al., 2003).
There is also a need to increase rigor at the high school level (Cohen, 2001). According to
Greene (2000), basic study skills and expectations are lacking in K-12 schools. The expectations
can be set at an adequate level meant to prepare students for postsecondary studies, but if
students are not held to those expectations, they will not learn what is needed. According to
Greene, postsecondary professors list the following complaints about high school education: high
schools do not prepare students to handle homework, high schools have lax standards, and high
school inflate grades. Kalenkoski and Pabilonia (2014) studied the effects of homework and
44
whether it increases academic achievement at the high school level. They concluded that
homework for boys does have a significant effect on HSGPA and on the likeliness of students
going on to college by age 20. Yet many high schools do not impart basic study skills to their
students, such as homework completion (Greene, 2000). According to the U.S. Department of
Education (2009), high school students completing a rigorous curriculum showed to be proficient
on fundamental knowledge and skills based on their results on the National Assessment of
Educational Progress (NAEP), whereas students who completed a midlevel or below curriculum
showed only partial mastery of fundamental knowledge and skills. The U.S. Department of
Education found that the percentage of students completing Algebra 2 increased almost 25%
from 1990 to 2009 to 76%. While this is a positive change in terms of rigor, for students to be
adequately prepared for postsecondary work or workforce expectations, they need to complete at
least Pre-calculus to complete a rigorous curriculum in math. The U.S. Department of Education
(2009) found that a portion of students who completed a midlevel to rigorous curriculum
completed credits during the summer, presumably additional credits and not remedial credits. In
2009, 64% of students who completed a rigorous curriculum completed Algebra 1 while in
middle school. Allowing students to complete high school courses such as Algebra 1, Geometry,
Biology, and foreign languages, while in middle school is an option for increasing the rigor of
the high school curriculum (U.S. Department of Education, 2009). In 2005, over half of
secondary schools also provided access to online course options, giving students access to
options that could increase the rigor of the curriculum offered at the school (U.S. Department of
Education, 2009). Radford and Ifill (2016) found that offering dual-enrollment and Advanced
Placement (AP) course options is related to the rate of student going on to college after high
school. While offering a more rigorous curriculum is important, ensuring appropriate supports
45
for populations of students who are normally found to be less successful is also an area that high
schools need to strengthen. According to the U.S. Department of Education (2009) in 2009, 8%
of high school graduates were students with disabilities who qualified for an Individualized
Education Plan (IEP) or 504 plan who were not in the gifted category. About half completed a
standard curriculum with a small portion completing a midlevel curriculum, but the other half
completed a curriculum that was below standard.
Predictors of College Success
The ACT test and GPA calculations have been around for many years. There have been
many studies completed examining the results of standardized college placement tests and high
school data among other factors to determine what factors affect student degree completion and
which can be used as predictors. First of all, it is important to note that college success has been
measured differently from one researcher to another. The following indicators of college success
were in the cited literature:
• College GPA at the end of the first year (Allen et al., 2008; Kuh et al., 2008; Noble &
Sawyer, 2002; Syverson et al., 2018).
• College success at end of first year including criteria such as number of credits completed
and college GPA (Radunzel & Noble, 2012).
• College GPA at the end of the fourth year (Geiser & Santelices, 2007).
• Cumulative college GPA (Radunzel & Noble, 2012; Syverson et al., 2018).
• Graduation in four years (Geiser & Santelices, 2007; Pike et al., 2014).
• Graduation in five years (Pike et al., 2014).
46
• Graduation in six years (French et al., 2015; Radunzel, 2012; Pike et al., 2014; Radunzel
& Noble, 2012).
• Graduation rates (Syverson et al., 2018).
• Retention of students to the second year of college (Kuh et al., 2008).
• Retention of student to the third year of college (Allen et al., 2008).
• Student transfer and dropout behaviors (Allen et al. 2008; Radunzel, 2012).
• And performance in college English and math courses (Hodara & Lewis, 2017).
It was evident that there was not consensus among researchers as to the definition of college
success.
It was also evident from the literature that not all researchers came to the same
conclusion on what constituted the best predictor of postsecondary success. Most of the variation
came from the different ways of defining “college success.” Overwhelmingly studies found that
HSGPA is the best predictor of college success. Noble and Sawyer (2002) completed a study of
ACT scores and HSGPA and compared them to the college GPA of students after one year of
college. They used data from two years, 1996 and 1997, and included almost 220,000
participants. The results showed that HSGPA was a better predictor of obtaining a first-year
college GPA of 2.5 or 3.0 than ACT Composite scores, but for obtaining a first-year college
GPA above 3.0, ACT Composite was a better predictor. A HSGPA below 3.0 was not accurate in
predicting first-year college GPA. Noble and Sawyer found that predictions based on both the
ACT Composite and the HSGPA were more accurate than either one alone. It is important to
note that the HSGPA for this research was calculated using student self-reported grades when
completing the demographic portion of the ACT before testing and may not be completely
accurate.
47
Geiser and Santelices (2007) studied almost 80,000 entering freshmen into the University
of California (UC) system and examined the predictive validity of the SAT and HSGPA. They
found that the SAT was more correlated to student socioeconomic status than HSGPA. They also
argued that proponents of using the SAT are the College Board, owner of the SAT, and other
testing agencies. Their findings showed that HSGPA was consistently the best predictor by itself
of fourth-year cumulative college GPA and when looking at individual institutions in the UC
system or chosen majors. When looking at college GPA by each year independent from the other
years, however, the HSGPA lost its predictive ability with each additional college year.
Surprisingly, when looking at a cumulative college GPA, Geiser and Santelices found that
HSGPA had the best predictive ability. They also found that using HSGPA in combination with
SAT scores provided a more accurate prediction of fourth-year college GPA. Examining
graduation rates in four years, Geiser and Santelices yet again found that HSGPA had the best
predictive ability of predicting degree attainment in four years, and again using HSGPA in
combination with SAT improved predictions.
Geiser and Santelices (2007) cautioned that the predictive ability of high school data was
limited to explaining 30% of the variance in fourth-year college GPA. When looking at student
admission, Geiser and Santelices did argue that using HSGPA was less likely to adversely
impact students than using standardized scores which have a documented bias against students
from lower socioeconomic backgrounds. Kuh et al. (2008) had similar findings to Geiser and
Santelices (2007), with the exception that they found the predictive ability of pre-college
academic achievement declined with each additional year in college. Kuh et al. studied almost
6,200 students from 18 four-year bachelor granting institutions. They examined student
background, self-reported pre-college academic achievement collected during ACT or SAT
48
registration, student responses on the National Survey of Student Engagement (NSSE) given in
2000 and 2003, and student academic and financial aid information collected by colleges. The
findings showed that pre-college experiences and academic achievement accounted for 29% of
the variance for first-year college grades. After the first year, however, pre-college experiences
and academic achievement were still statistically significant, but they lost some of their
predictive validity as other factors such as study habits and engagement affected student success.
It is important to note that pre-college academic achievement was represented by ACT and SAT
scores for the purpose of this study.
Allen et al. (2008) conducted a study with approximately 8,500 participants who were
entering freshmen at 48 four-year institutions across 25 states in the Midwest and southeast.
They looked at the differences between students who stayed at their original institutions, students
who transferred to another institution, and students who dropped out of college. Allen et al.
found that ACT scores and HSGPA were highly intercorrelated with first-year college GPA. Pre-
college education and academic performance had the highest effect on first-year college GPA
and that it also had an indirect contribution to students staying through their third year or
dropping out. Radunzel (2012) also completed a study of HSGPA and ACT Composite scores
and their relationship to students staying, transferring, or dropping out. She found that the
average HSGPA (3.59) and ACT Composite score (24.5) of students who complete a bachelor’s
degree within four years is higher than students who took longer to complete (3.39 average
HSGPA; 22.3 average ACT Composite score). Radunzel also found that the average ACT
Composite of students who stayed at their original institution or transferred to another four-year
institution was almost 2 points higher than the average ACT Composite score of students who
49
dropped out or transferred to a two-year institution. The difference in average HSGPA was 0.15
points.
Radunzel and Noble (2012) had similar findings from Allen et al. (2008) and Radunzel
(2012). Radunzel and Noble (2012) found that both the HSGPA and ACT Composite scores
were predictors of college success. Using data from close to 125,000 students who enrolled in 61
four-year institutions between 2000 and 2006, they examined the predictive properties of ACT
Composite scores and HSGPA against first-year college GPA, year-to-year progress measured
by credits earned, degree attainment within six years, and cumulative college GPA at
completion. The results indicated that HSGPA and ACT Composite scores were both direct
predictors of first-year college GPA, but subsequent college success was more reliant on first-
year college GPA than pre-college data. HSGPA did have a small but significant direct effect on
bachelor’s degree attainment. First-year college GPA was found to have the largest effect on
bachelor’s degree attainment. It is important to note that HSGPA data for this study came from
student self-reported high school grades on the demographic questions of the ACT registration
rather than provided by secondary or postsecondary institutions and may not be completely
accurate.
Pike et al. (2014) used data from about 4,000 students enrolled in 2004-2005 at one four-
year university in the Midwest to examine the relationship between bachelor’s degree attainment
in four, five, and six years, against several demographic factors, but also including preparation
factors such as standardized test scores (SAT), high school percentile rank, intensity of high
school coursework and comprehension of reading material at the high school level. They found
that high school percentile rank and comprehension of high school reading material were
significantly related to graduating in four, five, and six years. SAT scores and intensity of high
50
school coursework were significantly related to graduating in four and five years, but not six
years. Although there were differences in the regression coefficient indicating to which degree
factors were related to bachelor’s degree attainment, Pike et al. did not weight one factor as
being more important than another.
French et al. (2015) studied the relationship between HSGPA, educational attainment and
subsequent earnings using data from almost 21,000 students from 80 high schools and middle
schools. This was a longitudinal study started in 1994 and completed in 2009. The HSGPA data
was collected from high school records instead of from self-reported student data, which made
the data in this study more accurate than other studies relying on student self-reported grades.
French et al. found that HSGPA had a positive and significant relationship with not just
bachelor’s degree attainment, but also higher levels of education attainment up to and including
doctorate level studies for both men and women. French et al. estimated that an increase of one
point on the HSGPA increased the likelihood for men and women to complete a bachelor’s from
21% to 42%. The results also showed a significant relationship between annual earning and
HSGPA for both men and women. French et al. calculated that an increase in one point on the
HSGPA resulted in a salary increase of 11.85% for men and 13.77% for women. In addition to
the effects of HSGPA, French et al. also found significant gaps between men and woman as well
as between racial subgroups.
Syverson et al. (2018) found two different kinds of results based on the populations
examined. They studied first-year and cumulative college GPA and college graduation rates
using application records from almost one million applicants to participating institution with test-
optional policies. One quarter of the applicants studied chose to opt out of submitting
standardized test scores. The results showed that applicants without test scores were admitted at
51
lower rates that those who submitted test scores. Their HSGPA and first-year college GPA were
lower than applicants who submitted test scores, but they were more likely to enroll after being
admitted, and they had the same or slightly higher college graduation rates than applicants who
did not submit standardized test scores. Syverson et al. also found that the HSGPA of students
who did not submit standardized test scores when they applied was more predictive of their
college cumulative GPA and probability of graduation than their standardized test scores. They
found that standardized test scores and family socio-economic background are highly correlated
and concluded that for some students, standardized test-scores provide negative and false
predictive information. Among students who submitted standardized test scores with their
college application, test scores were found to have a stronger correlation with college GPA.
Another interesting finding from the study is that students who did not submit standardized test
scores were found to need more resources to support them during their studies which required a
financial commitment from the postsecondary institution.
Hodara and Lewis (2017) also found different results with a different population. Hodara
and Lewis examined the predictability of success in college English and math courses based on
standardized admission test scores and HSGPA. They used data from students who enrolled at
the University of Alaska between 2008 and 2012. Students who enrolled immediately after
graduating from high school were separated from the ones who waited at least one year to enroll.
For students who enrolled at the university the fall after they graduated from high school, the
results overwhelmingly showed that HSGPA was the best predictor of success in English and
math college courses. For students who delayed enrollment by at least one year, their HSGPA
was the best predictor of success in their English courses with the exception of the students who
took the ACCUPLACER admission test. ACCUPLACER results showed to have almost the
52
same predictability as HSGPA. ACT and ACCUPLACER were better predictors for success in
math courses, and SAT scores showed to have almost the same predictability as HSGPA.
Based on the overwhelming amount of studies concluding that HSGPA was a predictor of
college success, it can be implied that pre-college academic preparation affected college success.
Three of the studies cited explicitly mentioned the importance of secondary preparation. Allen et
al. (2008) concluded from their study that high school preparation had a significant impact on
college success and that it affected whether students stay at one postsecondary institution
(thereby increasing their probability of completing a degree), transferred institutions, or dropped
out. They recommended that academic preparation be a priority for secondary schools, such as
providing access to rigorous coursework, and teaching of academic self-discipline and
commitment to education. Pike et al. (2014) made the argument that their research demonstrated
the importance of pre-college academic preparation and its effects on college graduation rates.
They recommended that secondary and postsecondary schools work together to better align
secondary preparation with postsecondary expectations to provide access to a rigorous
curriculum and get students to understand the impact of academic excellence at the secondary
school level. They also advocated for programs designed to improve student success and
mitigate risk factors such as being a first-generation student or an underrepresented minority
student. Hodara and Lewis (2017) discussed the possibility of identifying a HSGPA benchmark
of college success, suggesting that secondary schools provide supports for students who fall
below that benchmark point. Hodara and Lewis also argued that postsecondary course placement
could be decided based on HSGPA.
53
Chapter Summary
Research shows that the purpose of high school is to adequately prepare all students for
postsecondary educational opportunities as well as to enter the workforce (ACT, 2005b; Barth,
2003; Cohen, 2001). Research also shows that the preparation required for both has actually
become the same (ACT, 2005b; Barth, 2003; Cohen, 2001). Even though this is the purpose of
high school, unfortunately many students have been found to graduate from high school without
the necessary preparation to be successful at the postsecondary level (Barth, 2003; Cohen, 2001).
There are several areas as discussed in the literature where high schools can improve student
postsecondary preparation. Two major high school data points are the ACT scores and the
cumulative HSGPA. Both of these are explained in this chapter and are instrumental for high
school graduates’ postsecondary planning. Student ACT scores and cumulative HSGPA are used
for postsecondary admission determination as described in this chapter because of their
documented reliability in predicting success at the postsecondary level. ACT scores are also used
to determine placement in learning support courses or prerequisite courses by some
postsecondary institutions as described by the examples in this chapter. Merit-based scholarships
offered by the state of Tennessee as well as by various institution use ACT scores, or cumulative
HSGPA, or both, to determine eligibility. Student ACT scores are also used by the state of
Tennessee for secondary school accountability (Tennessee Department of Education, 2018b).
As has been evident in the literature, many factors affect students' success at
postsecondary institutions and there are many studies that examine college success. The
indicators of college success vary from study to study, which makes it difficult to pinpoint one
particular factor over another. Year-to-year retention, college GPA at various points, and
bachelor’s degree attainment in a set amount of time (4-years, 5-years or 6-years) have been
54
examined by many researchers using smaller or larger groups of participants at one or multiple
institutions. Overall, the literature does indicate that HSGPA has the best predictive ability of
college success, indicating that secondary preparation plays an important role for students’
postsecondary success.
55
Chapter 3. Methodology
High school administrators only have a few measures to evaluate student preparedness
for college: college entrance exams and student cumulative grade point average. The goal of
attending college is to complete a degree, which leads to higher wages and quality of life (Barth,
2003; Cary, 2005; Mayhew et al., 2016). For society investing in education has a lesser cost than
dealing with the negative consequences of having a large population of uneducated citizens
(Greene, 2000). Moreover, everyday life requires a higher education level to effectively navigate
it, and the preparation needed to successfully complete a postsecondary degree is the same that
one needs to successfully transition into the workplace after high school (Barth, 2003).
Education is also the equalizer between people of different ethnic backgrounds (Barth, 2003;
Finn et al., 2015). The preparation students receive in high school is an important factor in
postsecondary success (Carnevale & Desrochers, 2002). The purpose of this study is to see if the
college preparedness measures that are available to high school administrators and counselors
(ACT and HSGPA) can also be used as a measure to determine if students are prepared to
complete college, not just begin college.
An ex post facto correlational design quantitative study was used to establish if there is a
significant difference in the ACT scores and unweighted high school grade point average of
students who have earned a bachelor’s degree vs. the scores of students who have not earned a
bachelor’s degree. For the purpose of this study, the highest ACT Composite and highest
subscores as well as the cumulative unweighted grade point average were used for each
participant.
56
Research Questions and Corresponding Null Hypotheses
An independent-sample t test was chosen for research questions 1 through 6. According
to Green and Salkind (2011), “with an independent-samples t test, each case must have scores on
two variables, the grouping variable and the test variable” (p.175). In the case of this study, the
grouping variable is whether or not students earned a bachelor’s degree, and the test variable is
their ACT Composite score (0-36), ACT Math score (0-36), ACT Science score (0-36), ACT
Reading score (0-36), ACT English score (0-36), and their cumulative unweighted HSGPA (0-
4).
RQ1: Is there a significant difference in the ACT Composite scores between students
who completed a bachelor’s degree within 6 years of starting college and students
who did not complete a bachelor’s degree within 6 years of starting college?
H
0
1: There is no significant difference in the ACT Composite scores between
students who completed a bachelor’s degree within 6 years of starting college and
students who did not complete a bachelor’s degree within 6 years of starting
college.
RQ2: Is there a significant difference in the ACT Math subscores between students who
completed a bachelor’s degree within 6 years of starting college and students who
did not complete a bachelor’s degree within 6 years of starting college?
H
0
2: There is no significant difference in the ACT Math subscores between
students who completed a bachelor’s degree within 6 years of starting college and
students who did not complete a bachelor’s degree within 6 years of starting
college.
57
RQ3: Is there a significant difference in the ACT Reading subscores between students
who completed a bachelor’s degree within 6 years of starting college and students
who did not complete a bachelor’s degree within 6 years of starting college?
H
0
3: There is no significant difference in the ACT Reading subscores between
students who completed a bachelor’s degree within 6 years of starting college and
students who did not complete a bachelor’s degree within 6 years of starting
college.
RQ4: Is there a significant difference in the ACT English subscores between students
who completed a bachelor’s degree within 6 years of starting college and students
who did not complete a bachelor’s degree within 6 years of starting college?
H
0
4: There is no significant difference in the ACT English subscores between
students who completed a bachelor’s degree within 6 years of starting college and
students who did not complete a bachelor’s degree within 6 years of starting
college.
RQ5: Is there a significant difference in the ACT Science subscores between students
who completed a bachelor’s degree within 6 years of starting college and students
who did not complete a bachelor’s degree within 6 years of starting college?
H
0
5: There is no significant difference in the ACT Science subscores between
students who completed a bachelor’s degree within 6 years of starting college and
students who did not complete a bachelor’s degree within 6 years of starting
college.
RQ6: Is there a significant difference in the final unweighted cumulative HSGPA
between students who completed a bachelor’s degree within 6 years of starting
58
college and students who did not complete a bachelor’s degree within 6 years of
starting college?
H
0
6: There is no significant difference in the final unweighted cumulative
HSGPA between students who completed a bachelor’s degree within 6 years of
starting college and students who did not complete a bachelor’s degree within 6
years of starting college.
Population
Participants in this study included students who have graduated from a small high school
in east Tennessee. First of all, this high school is a school of choice, meaning that parents and
students choose to attend this school instead of their assigned school. Students go through a
lottery selection process due to limited space. Transportation at this school is not provided, so in
choosing for their children to attend this high school, parents commit to providing transportation
to and from school which inevitably prevented those students dependent on school-provided
transportation from attending the school. Additionally, the population of this high school has had
a lower percentage of students who were economically disadvantaged. For the 2012-2013 school
year, the school’s student population was 13.9% economically disadvantaged, while the 4 nearest
high schools in the area had economically disadvantaged school populations of 36.7%, 51.9%,
36.7%, and 40% (Tennessee Department of Education, n.d.). The socioeconomic background of
students was not taken into consideration in this research.
The number of students in a graduation cohort has varied from 50 to 70 students over the
years. At this high school, students can earn six credits every year for a total of 24 credits in 4
years. Students who take online classes or dual-enrollment classes may earn more credits than
24. The online and dual-enrollment options have become more popular in the last 5 years and
59
would not affect the participants of the study since the last cohort considered is the 2013
graduating class. At this school, the classes that are offered are academic and there are not any
career technical options. Students who only take classes that are offered at this school complete
their graduation requirement by earning 4 credits of math (Algebra 1, Geometry, Algebra 2, and
either Pre-Calculus or Advanced Algebra & Trigonometry), 4 credits of science (Biology,
Physical Science, Chemistry, and an advanced science beyond Chemistry), 4 credits of English
(English 9, 10, 11 and 12), 3.5 credits of social studies (World History, U.S. History, and a half
credit each of U.S. Government, Economics, and Personal Finance), 2 credits of a foreign
language, either Spanish, French, or German, 1 credit of a fine arts class, 1.5 credits of physical
activity and health (Wellness and a PE course), and 1 credit of Technology. That is a total of 20
credits, leaving room for 4 classes that the students can choose, but 3 of which need to follow a
focused elective series as required by the Tennessee graduation requirements (Tennessee State
Board of Education, 2017). The elective offerings at this school are either arts, literature, social
studies, advanced foreign language, advanced technology, or physical activity courses. With only
4 credits that are not prescribed a and limited choice of classes, students do not have many
options to explore career and interests.
Participants are students who graduated from this high school, beginning with the
graduation cohort of May 2005 and ending with the high school graduation cohort of May 2013.
The school in this study had graduation cohorts of about 60 students on average, resulting in a
total of about 540 participants in the study. For each participant, the following data were
available: cumulative unweighted HSGPA, highest ACT Composite score, highest ACT Math
subscore, highest ACT Science subscore, highest ACT English subscore, highest ACT Reading
subscore, and postsecondary bachelor’s degree completion at postsecondary institutions in the
60
United States. For the students where there were multiple ACT scores, the highest score in each
category was used. The participants were grouped into one of two categories:
1. Student who did not complete a bachelor’s degree from a postsecondary institution in
the United States.
2. Students who completed a bachelor’s degree from a postsecondary institution in the
United States.
For the purpose of this study, participants who are counted in the category of having earned a
bachelor’s degree must have done so within 6 years of beginning their studies at a postsecondary
institution. Six years is a commonly accepted maximum length of time for students to complete a
bachelor’s degree from the time they began and is one of the criteria used by the Tennessee
Higher Education Commission when determining institutional success and funding since the
passage of the Complete College Tennessee ACT of 2010 (Tennessee Higher Education
Commission, n.d. a).
Instrumentation
Students’ cumulative unweighted HSGPA, ACT Composite score, ACT Math subscore,
ACT Science subscore, ACT English subscore, ACT Reading subscore were used in this study to
determine if there was a significant difference between students who graduated with a bachelor’s
degree and students who did not graduate with a bachelor’s degree. For students who took the
ACT more than once, only the highest scores were used for the purpose of this study.
Data Collection
Administrators of the college preparatory high school in east Tennessee provided the data
for analysis after the dissertation committee and the East Tennessee State University Institutional
61
Review Board (IRB) approved the research. Administrators from the high school under study
collected this data for informational purposes. The intent for collecting the data was to establish
how successful the high school was in preparing students to be successful at the postsecondary
level, as measured by attainment of a bachelor’s degree. Personnel at the high school removed all
personal identifiers from the data before it was made available to the researcher. The researcher
created a dataset in SPSS with the data received from the administrators of the school. In all, 545
students had HSGPA data, and 525 of those had ACT data.
Data Analysis
The researcher used a series of independent t tests to test for significant differences in
ACT Composite and subscores and in cumulative unweighted HSGPA between students who
graduated with a bachelor’s degree within six years of beginning postsecondary studies and
students who did not graduate with a bachelor’s degree within that timeframe.
Chapter Summary
In order to explore the relationship between students completing a bachelor’s degree
within six years and their cumulative unweighted HSGPA and ACT scores, an ex post facto
study was designed. The cumulative unweighted HSGPA and ACT scores were chosen as the
focus for this study because these are the measures available to high school counselors, teachers
and administrators to determine student readiness for postsecondary institutions’ expectations.
The study population included high school graduates from a small college preparatory
high school in east Tennessee beginning with the 2005 graduation cohort and ending with the
2013 graduation cohort. Independent t-tests were used to investigate the relationship between
62
participants’ ACT scores (composite and subscores) as well as their cumulative unweighted
HSGPA and whether or not they completed a bachelor’s degree within a 6-year period of time.
63
Chapter 4. Findings
An ex post facto quantitative study was used to establish if there was a significant
difference in the ACT scores and unweighted high school grade point average of students who
have earned a bachelor’s degree within 6 years of starting college vs. the scores of students who
have not earned a bachelor’s degree within 6 years of starting college. For the purpose of this
study, the highest ACT Composite and highest subscores as well as the cumulative unweighted
grade point average were used for each participant. Since the ACT was not required for high
school students to graduate in Tennessee before 2008, there were 20 students who graduated
between 2005 and 2007 who did not have ACT scores. This resulted in 20 fewer participants for
the research questions involving ACT scores and subscores than the question involving HSGPA.
In all, there were 547 students who graduated between 2005 and 2013 who had HSGPA data. Of
those 547 high school graduates, 329 completed a bachelor’s degree within 6 years of starting
college, which is a bachelor’s degree attainment rate of 60% for students who graduated from
this high school between 2005 and 2013.
Research Question 1
RQ1: Is there a significant difference in the ACT Composite scores between students
who completed a bachelor’s degree within 6 years of starting college and students
who did not complete a bachelor’s degree?
H
0
1: There is no significant difference in the ACT Composite scores between
students who completed a bachelor’s degree within 6 years of starting college and
students who did not complete a bachelor’s degree.
64
An independent sample t-test was conducted to evaluate whether the mean ACT Composite
score differs significantly between students who completed a bachelor’s degree within 6 years of
starting college and students who did not completed a bachelor’s degree within 6 years of starting
college. The grouping variable was the completion of a bachelor’s degree within 6 years of starting
college and the test variable was the ACT Composite score. The test was significant, t(525) =
9.051, p < .001. Therefore, the null hypothesis was rejected. Participants who completed a
bachelor’s degree within 6 years of starting college (M = 25.03, SD = 4.181) tended to have
significantly higher ACT Composite scores than those who did not complete a bachelor’s degree
within 6 years of starting college (M = 21.84, SD = 3.537). The 95% confidence interval for the
difference in means ranged from 2.497 to 3.881. Cohen’s d test for effect size was 0.82, which
indicated a large effect size. Figure 1 shows the distribution for ACT Composite scores for students
who attained a bachelor’s degree within 6 years of starting college and for students who did not
attain a bachelor’s degree within 6 years of starting college.

65
Figure 1
ACT Composite Scores Distribution Between the Two Groups
Research Question 2
RQ2: Is there a significant difference in the ACT Math subscores between students who
completed a bachelor’s degree within 6 years of starting college and students who
did not complete a bachelor’s degree?
H
0
2: There is no significant difference in the ACT Math subscores between
students who completed a bachelor’s degree within 6 years of starting college and
students who did not complete a bachelor’s degree within 6 years of starting
college.
An independent sample t-test was conducted to evaluate whether the mean ACT Math score
differs significantly between students who completed a bachelor’s degree within 6 years of
starting college and students who did not completed a bachelor’s degree within 6 years of
66
starting college. The grouping variable was the completion of a bachelor’s degree within 6 years
of starting college and the test variable was the ACT Math score. The test was significant, t(525)
= 8.352, p < .001. Therefore, the null hypothesis was rejected. Participants who completed a
bachelor’s degree within 6 years of starting college (M = 24.78, SD = 4.432) tended to have
significantly higher ACT Math scores than those who did not complete a bachelor’s degree
within 6 years of starting college (M = 21.66, SD = 3.744). The 95% confidence interval for the
difference in means ranged from 2.385 to 3.851. Cohen’s d test for effect size was 0.76, which
indicated a medium effect size. Figure 2 shows the distribution for ACT Math scores for students
who attained a bachelor’s degree within 6 years of starting college and for students who did not
attain a bachelor’s degree within 6 years of starting college.

67
Figure 2
ACT Math Scores Distribution Between the Two Groups
Research Question 3
RQ3: Is there a significant difference in the ACT Reading subscores between students
who completed a bachelor’s degree within 6 years of starting college and students
who did not complete a bachelor’s degree?
H
0
3: There is no significant difference in the ACT Reading subscores between
students who completed a bachelor’s degree within 6 years of starting college and
students who did not complete a bachelor’s degree within 6 years of starting
college.
An independent sample t-test was conducted to evaluate whether the mean ACT Reading score
differs significantly between students who completed a bachelor’s degree within 6 years of
68
starting college and students who did not completed a bachelor’s degree within 6 years of
starting college. The grouping variable was the completion of a bachelor’s degree within 6 years
of starting college and the test variable was the ACT Reading score. The test was significant,
t(525) = 7.329, p < .001. Therefore, the null hypothesis was rejected. Participants who
completed a bachelor’s degree within 6 years of starting college (M = 26.11, SD = 5.165) tended
to have significantly higher ACT Reading scores than those who did not complete a bachelor’s
degree within 6 years of starting college (M = 22.80, SD = 4.858). The 95% confidence interval
for the difference in means ranged from 2.420 to 4.192. Cohen’s d test for effect size was 0.66,
which indicated a medium effect size. Figure 3 shows the distribution for ACT Reading scores
for students who attained a bachelor’s degree within 6 years of starting college and for students
who did not attain a bachelor’s degree within 6 years of starting college.

69
Figure 3
ACT Reading Scores Distribution Between the Two Groups
Research Question 4
RQ4: Is there a significant difference in the ACT English subscores between students
who completed a bachelor’s degree within 6 years of starting college and students
who did not complete a bachelor’s degree?
H
0
4: There is no significant difference in the ACT English subscores between
students who completed a bachelor’s degree within 6 years of starting college and
students who did not complete a bachelor’s degree?
An independent sample t-test was conducted to evaluate whether the mean ACT English score
differs significantly between students who completed a bachelor’s degree within 6 years of
starting college and students who did not completed a bachelor’s degree within 6 years of
70
starting college. The grouping variable was the completion of a bachelor’s degree within 6 years
of starting college and the test variable was the ACT English score. The test was significant,
t(525) = 8.791, p < .001. Therefore, the null hypothesis was rejected. Participants who
completed a bachelor’s degree within 6 years of starting college (M = 25.44, SD = 4.901) tended
to have significantly higher ACT English scores than those who did not complete a bachelor’s
degree within 6 years of starting college (M = 21.63, SD = 4.775). The 95% confidence interval
for the difference in means ranged from 2.960 to 4.664. Cohen’s d test for effect size was 0.79,
which indicated a large effect size. Figure 4 shows the distribution for ACT English scores for
students who attained a bachelor’s degree within 6 years of starting college and for students who
did not attain a bachelor’s degree within 6 years of starting college.

71
Figure 4
ACT English Scores Distribution Between the Two Groups
Research Question 5
RQ5: Is there a significant difference in the ACT Science subscores between students
who completed a bachelor’s degree within 6 years of starting college and students
who did not complete a bachelor’s degree?
H
0
5: There is no significant difference in the ACT Science subscores between
students who completed a bachelor’s degree within 6 years of starting college and
students who did not complete a bachelor’s degree.
An independent sample t-test was conducted to evaluate whether the mean ACT Science score
differs significantly between students who completed a bachelor’s degree within 6 years of
starting college and students who did not completed a bachelor’s degree within 6 years of
72
starting college. The grouping variable was the completion of a bachelor’s degree within 6 years
of starting college and the test variable was the ACT Science score. The test was significant,
t(525) = 8.697, p < .001. Therefore, the null hypothesis was rejected. Participants who
completed a bachelor’s degree within 6 years of starting college (M = 24.95, SD = 4.240) tended
to have significantly higher ACT Science scores than those who did not complete a bachelor’s
degree within 6 years of starting college (M = 21.87, SD = 3.481). The 95% confidence interval
for the difference in means ranged from 2.383 to 3.774. Cohen’s d test for effect size was 0.79,
which indicated a large effect size. Figure 5 shows the distribution for ACT Science scores for
students who attained a bachelor’s degree within 6 years of starting college and for students who
did not attain a bachelor’s degree within 6 years of starting college.

73
Figure 5
ACT Science Scores Distribution Between the Two Groups
Research Question 6
RQ6: Is there a significant difference in the final unweighted cumulative HSGPA
between students who completed a bachelor’s degree within 6 years of starting
college and students who did not complete a bachelor’s degree?
H
0
6: There is no significant difference in the final unweighted cumulative
HSGPA between students who completed a bachelor’s degree within 6 years of
starting college and students who did not complete a bachelor’s degree.
An independent sample t-test was conducted to evaluate whether the mean HSGPA differs
significantly between students who completed a bachelor’s degree within 6 years of starting
college and students who did not completed a bachelor’s degree within 6 years of starting
74
college. The grouping variable was the completion of a bachelor’s degree within 6 years of
starting college and the test variable was the HSGPA. The test was significant, t(545) = 11.923, p
< .001. Therefore, the null hypothesis was rejected. Participants who completed a bachelor’s
degree within 6 years of starting college (M = 3.34542, SD = .487345) tended to have
significantly higher final unweighted cumulative HSGPAs than those who did not complete a
bachelor’s degree within 6 years of starting college (M = 2.82302, SD = .524193). The 95%
confidence interval for the difference in means ranged from .436 to .608. Cohen’s d test for
effect size was 1.03, which indicated a large effect size. Figure 6 shows the distribution for
HSGPA for students who attained a bachelor’s degree within 6 years of starting college and for
students who did not attain a bachelor’s degree within 6 years of starting college.

75
Figure 6
HSGPA Distribution Between the Two Groups
Chapter Summary
An independent sample t-test was used for each research question to see if there were
significant differences between students who attained a bachelor’s degree within 6 years of
starting college and those who did not. The following data were analyzed: ACT Composite, ACT
Math, ACT English, ACT Reading, ACT Science, cumulative unweighted HSGPA. High school
students who graduated between 2005 and 2013 from a small public high school in East
Tennessee with only an academic program were used and the data was de-identified and
provided to the researcher by the high school. In all, 547 graduates had HSGPA data and 525 of
those had ACT data. In all cases, students who earned a bachelor’s degree within 6 years of
starting college had significantly higher ACT scores and HSGPAs than students who did not earn
76
a bachelor’s degree within 6 years of starting college. Cohen’s d indicated that ACT Composite
(Cohen’s d = 0.82), ACT English (Cohen’s d = 0.79), ACT Science (Cohen’s d = 0.79), and
HSGPA (Cohen’s d = 1.03) had a large effect on bachelor’s degree attainment, with HSGPA
having the largest effect size. ACT Math (Cohen’s d = 0.76) and ACT Reading (Cohen’s d =
0.66) had a medium effect size according to the results of Cohen’s d.
77
Chapter 5. Summary, Conclusions, and Recommendations
Secondary school educators need indicators to help determine whether students who plan
to continue their studies at degree granting postsecondary institutions have been adequately
prepared and have the knowledge and tools necessary to successfully complete a bachelor’s
degree. Completing a bachelor’s degree has been shown to significantly increase a person’s
quality of life (Carnevale & Desrochers, 2002). Four-year degree granting institutions are
evaluated on degree completion for funding purposes (Banta & Fisher, 1984; Dougherty &
Reddy, 2011; Radunzel, 2012; Radunzel & Noble, 2012). Society as a whole needs more
educated citizens to function adequately in everyday life as well as to fill the increasingly
complicated jobs that are more and more the norm (Barth, 2003; Greene, 2000; Rolfhus et al.,
2017; Stewart, 2012) and that require postsecondary education. College admission and
scholarship mostly require submission of HSGPA as well as standardized test scores. Recently,
there is a movement for postsecondary institutions to move away from the use of minimum
standardized score requirements for admission due to a documented racial bias in the scores
(French et al., 2015; Geiser & Santelices, 2007; Toldson & McGee, 2014). While some colleges
no longer require standardized test scores, states like Tennessee include taking standardized tests
as a high school graduation requirement (Tennessee Department of Education, 2018b). This may
be due to the fact that states are looking at gaps in student subgroups in an effort to close them,
and standardized scores have shown gaps among racial and socioeconomic subgroups.
Success at the postsecondary level is quantified in the literature using many different
definitions of college success: first year GPA, fourth year GPA, final cumulative college GPA,
number of credits completed after 1 year, bachelor’s degree attainment in 4, 5, and 6 years, year-
to-year retention after 1 year and after 3 years, student transfer rates from one institution to
78
another, and performance in specific courses (Allen et al., 2008; French et al., 2015; Geiser &
Santelices, 2007; Hodara & Lewis, 2017; Kuh et al., 2008; Noble & Sawyer, 2002; Pike et al.,
2014; Radunzel, 2012; Radunzel & Noble, 2012; Syverson et al., 2018). The results of these
studies were varied due to the many definition of college success. Several of the studies cited
used student self-reported grades to calculate a HSGPA (Kuh et al., 2008; Noble & Sawyer,
2002; Radunzel & Noble, 2012), which may have impacted the accuracy of the results. However,
despite the variations in definition and source of data, HSGPA was found to be the best indicator
of college success overall among all researchers cited. Noble & Sawyer (2002) did find that
ACT was a better predictor for success when looking at first-year college GPA. While the
common thought is that high school preparation only has an impact on the initiation of college
studies, French et al. (2015) found not only a correlation of high school preparation with
bachelor’s completion, but also with income level once the individuals entered the workforce.
This study showed that for the 547 participants of the study who graduated from one college
preparatory high school in East Tennessee from 2005 to 2013, 60% (327) attained a bachelor’s
degree within 6-years of starting college. This is very different from the findings of Rolfhus et al.
(2017) for the Tennessee high school cohort who graduated in 2007 and had a bachelor’s degree
attainment within 6 years of 16%. One must keep in mind that looking at all high school
graduates in Tennessee vs. only those who planned to continue their education at degree granting
postsecondary institutions is not a fair comparison. However, Rolfhus et al. found that 55% of
the class of 2007 did enroll in postsecondary institutions within six years of graduating from high
school, and 69% or those did so the fall following high school graduation. If 55% enrolled in
college, but only 16% completed a bachelor’s degree, there is room for improvement in the
secondary preparation and the transition from high school to college. Even though a 60%
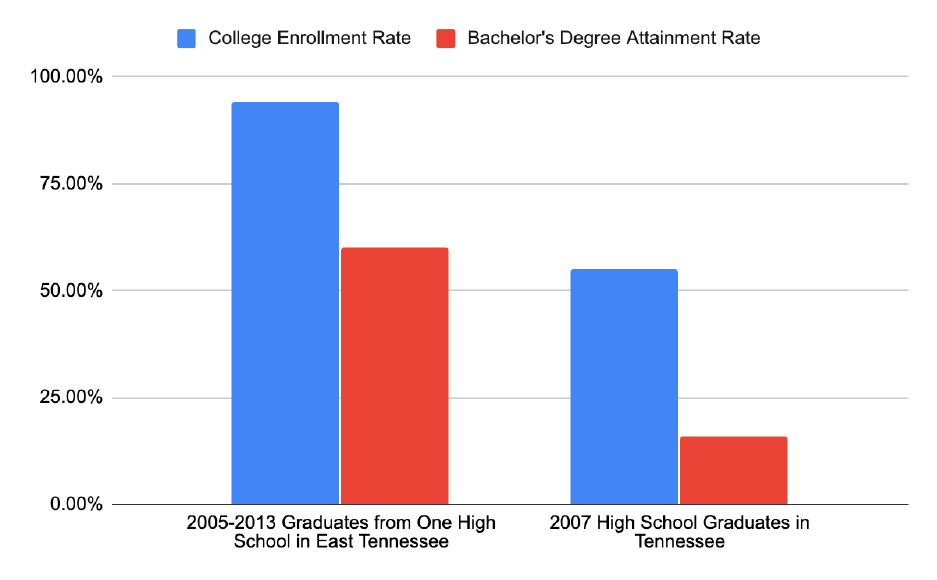
79
bachelor’s degree attainment is impressive compared to a statewide rate of 16%, it also has room
to be improved, especially considering that 94% of the students who graduated from this high
school enrolled at a postsecondary institution after high school. Figure 7 illustrates the bachelor’s
degree attainment within 6 years of the participants of this study compared to the entire
Tennessee 2007 high school graduation cohort.
Figure 7
Bachelor’s Degree Attainment Within 6 Years of Starting College
For the purpose of the study, bachelor’s degree attainment was only counted if it happened
within 6 years of starting college. The data examined showed that 43 students who were counted
as not completing a bachelor’s degree because they took longer than 6 years, did earn a
bachelor’s degree. Figure 8 shows the distribution of years it took students to complete a

80
bachelor’s degree among the participants of this study. When looking at the total number of
participants who did earn a bachelor’s degree without a time limit, the bachelor’s degree
attainment rate increases from 60% to 68%, and it will undoubtedly continue to increase slightly
as a few more students in the later cohorts attain a bachelor’s degree. The data also showed that
the majority of students did graduate within 6 years, but a small group of students graduated
between 6.5 and 8 years.
Figure 8
Years to Bachelor’s Degree Attainment for the Participants of the Study
Discussion and Conclusions
This ex post facto correlational design quantitative study was conducted to examine
specifically students who had access to a college preparatory secondary education and the
possible relationship of the students’ high school data, specifically ACT and HSGPA, and
81
students who attained a bachelor’s degree within 6 years of starting college versus students who
did not attain a bachelor’s degree within 6 years of starting college. For students who intend to
enroll in a postsecondary institution after high school with the goal of attaining a bachelor’s
degree, it is important for high school educators and administrators to have reliable indicators of
how well these students are prepared to be successful beyond high school. This study was
different in that it looked at student preparation for college and college success from the high
school preparation perspective. By using data from students who graduated from one high
school, the researcher was able to determine if ACT and HSGPA are data that can be used by
high school personnel of this school to determine if students are on track with their preparation
for college with the goal of attaining a bachelor’s degree, not just being admitted to the
postsecondary institution. The results of this study indicate that ACT and HSGPA are measures
that, at this high school, can be used to identify students who need more support and those who
are on track with their postsecondary preparation.
Research Questions 1 through 5 examined ACT data specifically to see if there were
significant differences in the mean ACT scores between students who completed a bachelor’s
degree within 6 years of starting college and those who did not complete a bachelor’s degree
within 6 years of starting college. Figure 9 shows the results of ACT Composite and subscores in
comparison with each other for the two groups.

82
Figure 9
Distribution of ACT Score Means Between the Two Groups
It is evident that there is an overlap within the first standard deviations of the two groups
across all ACT scores, which is a reminder that while ACT scores can be used as indicator of
college readiness, they should not be used to close opportunities for students. A student with a 23
ACT Composite scores is just as likely to complete a bachelor’s degree within 6 years as they are
to not complete a bachelor’s degree. Table 1 shows the mean ACT scores and the standard
deviation for both groups as well as the effect size (Cohen’s d) for each score. As a reminder, the
highest ACT score is 36, and the college readiness benchmarks set by ACT are: ACT English,
18; ACT Reading, 22; ACT Math, 22, ACT Science 23 (ACT, 2017a). It is interesting to note
that score means for students who did not complete a bachelor’s degree within 6 years met the
ACT English, and ACT Reading, but not the ACT Science and ACT Math benchmarks set by

83
ACT. These benchmarks are set by examining student success (determined by final grades in the
courses) in basic college course requirements in the areas of math, English and science.
Table 1
Effect Size, Means and Standard Deviations for ACT Composite and Subscores for the Two
Groups
Effect Size
Bachelor’s
No Bachelor’s
Cohen’s d
Mean
Std.
Deviation
Mean
Std.
Deviation
ACT Composite
0.82
25.03
4.181
21.84
3.537
ACT Math
0.76
24.78
4.432
21.66
3.744
ACT Reading
0.66
26.11
5.165
22.80
4.858
ACT English
0.79
25.44
4.901
21.63
4.775
ACT Science
0.79
24.95
4.240
21.87
3.481
While there was a significant difference for all ACT scores, ACT Math and ACT
Reading had a medium effect size while ACT Composite, ACT English and ACT Science had
large effect sizes. The large effect size calculated with Cohen’s d signifies that the group means
are far enough distant from each other that the significance matters. That being said, a student
with a low ACT score may still complete a bachelor’s degree, and someone with a high ACT
score may not. The outliers with high ACT scores that can be seen on Figure 8 in the group of
students who did not complete a bachelor’s degree within 6 years are perfect examples of that.
Research Question 6 examined HSGPA data specifically to see if there was a significant
difference in the mean HSGPA between students who completed a bachelor’s degree within 6

84
years of starting college and HSGPA of students who did not complete a bachelor’s degree
within 6 years of starting college. The results showed that there was a significant difference
between the two groups. Table 2 shows the mean HSGPA, the standard deviation for both
groups, and the effect size (Cohen’s d) for HSGPA. The unweighted HSGPA has a maximum of
4.0 points. The effect size for HSGPA is large (Cohen’s d = 1.03), and the fact that it is larger
than 1 indicates that there is a difference between the means of 1.03 standard deviation which is
notable. The HSGPA effect size is larger than any of the ACT scores effect sizes, indicating that
HSGPA, for this group of participants who graduated from one high school between 2005-2013,
is a better indicator of bachelor’s degree attainment within 6 years of enrolling in college than
any ACT scores.
Table 2
HSGPA Effect Size, Means and Standard Deviations for the Two Groups
Effect Size
Bachelor’s
No Bachelor’s
Cohen’s d
Mean
Std.
Deviation
Mean
Std.
Deviation
HSGPA
1.03
3.34542
0.487345
2.82302
0.524193
Implications for Practice
The data examined in this study show that ACT and HSGPA can be used as indicators of
adequate college preparation for students attending this one high school. The results of this study
show that postsecondary student data can be examined to evaluate student preparation. That
information can then be used to make improvements, as well as support students whose data
85
show they may not be on track to be ready for success at the postsecondary level. The
implications for practice from the results of this study are:
• high school personnel need to examine the available student data and collect student data
beyond high school to understand the effectiveness of the preparation provided at each
high school.
• if the available data are inconclusive, investigating possible new data sources to find an
adequate measure of postsecondary readiness may provide school personnel with the
necessary data.
Examining the data allows educators to determine how they have been preparing students
and what improvement can be made. As a public-school educator, it is easy to get overwhelmed
with the everyday emergencies, adherence to state requirements, and the routines of a school
year. However, for improvements to happen, educational leaders and educators must make time
to examine available data and identify areas that can be improved. It was established that the
purpose of high school is to prepare students for the workplace or for postsecondary education
(ACT, 2005b; Barth, 2003; Cohen, 2001). In recent years, the preparation for both has become
very similar due to the increased knowledge expected of high school graduates who join the
workforce after high school graduation (Barth, 2003; Carnevale & Desrochers, 2002). The
majority of high school students do plan on going to college after they graduate from high school
(ACT, 2019; Barth, 2003). The studies cited in the review of the related literature and the results
of this study show that high school preparation does affect students’ ability to complete a
bachelor’s degree. Therefore it is important for the sake of students and society for high school
personnel to focus beyond high school graduation requirements and readiness for college
admission, and to ensure that the preparation available at the high school level sets students up
86
for success beyond high school. It is a disservice to students and society if schools do not
examine their practices and continue to strive for improvement. It is important for high school
personnel the remember the importance of their impact and the consequences of inadequate
student preparation. High school graduation should be viewed as the springboard for students’
next step in life and not an end point or goal.
There are multiple documented areas where states and secondary school personnel can
focus resources that will bring improvement in student preparation for success beyond high
school:
• Secondary school and postsecondary school need to collaborate and communicate with
each other to minimize the gaps in transitioning students from high school to
postsecondary opportunities (ACT, 2008b; Barth, 2003; Carey, 2005; Cohen, 2001;
Trusty & Niles, 2008; Venezia et al., 2003).
• There is a need to increase counseling resources at the secondary level so that students
and families have accurate expectations of the necessary preparation for students next
steps (Barth, 2003; Cohen 2001; Radford & Ifill, 2016; Trusty & Niles, 2004; Venezia et
al., 2003).
• All students need both access and encouragement to take rigorous classes that prepare
them for postsecondary success (Adelman, 1999; Barth, 2003; Cohen, 2001; Greene,
2000). Secondary schools need to collaborate across districts in order to examine the
level and adequacy of rigor offered.
The bottom line is that secondary schools need to look beyond students successfully
completing the requirements for a high school diploma and must instead work with students and
87
families to ensure that students are aware of their options after high school and get the necessary
preparation while in high school to not just access those options, but successfully complete them.
Implications for Further Research
Following are implications for further research that emerged from the results of this
study.
• Follow up study with the same participants to find out what prevented them from
completing or helped them complete a bachelor’s degree. Looking deeper into students
whose data indicated readiness for college success but who did not complete a bachelor’s
degree within 6 years, and students whose data did not indicate readiness for college
success, but who completed a bachelor’s degree within 6 years.
• Repeating the study at other high schools and comparing the results to see if the results
are similar or different.
• If there are significant differences in results from one high school to another, examining
the impact of smaller specialized high schools and comparing them to large high schools
where multiple paths of study are offered.
While there were significant differences in ACT scores and HSGPA between students
who attained a bachelor’s degree within 6 years of starting college and those who did not, it was
also evident that those indicators are not absolute predictors as there are overlap in the standard
deviations between both groups. It would be interesting to find out more information from the
students who did not attain a bachelor’s degree and from those who did attain a bachelor’s
degree as to what factors came into play to either help them or hinder them in their pursuit of a
bachelor’s degree.
88
Another area of further research is the impact of specific high schools. This study used
graduates from one high school that only offers an academic preparation path, while many high
schools offer multiple paths. The results from this study show that 94% of 2005-2013 graduates
from this high school went on to college and 60% attained a bachelor’s degree within 6 years of
entering college. Data from the 2007 high school graduation cohort in Tennessee show that while
55% of high school graduates entered college, only 16% attained a bachelor’s degree (Rolfhus et
al., 2017). This high school has admittedly a higher bachelor’s degree attainment rate from 2005-
2013 than the state average for 2007 which can mostly be attributed to the fact that students
attending this high school chose to do so knowing it only offers an academic path. Thereby, the
assumption can be made that these are students who intend to continue their studies beyond high
school. Researching whether high schools with multiple graduation paths have similar or
different bachelor’s degree attainment rates with the students who plan on postsecondary studies
would help these schools know how to best prepare college-bound students. Looking at the
impact of specialized high schools vs. large multi-option high schools would also be a research
that would help educators and decision-makers in setting up students for success.
Summary
In this study, ACT and HSGPA data were analyzed for students who graduated between
2005 and 2013 from a small high school in east Tennessee that only offers an academic path. The
students were divided into two groups: those who completed a bachelor’s degree within 6 years
of starting college, and those who did not complete a bachelor’s degree within 6 years of starting
college. The mean ACT scores and HSGPA were compared between the two groups and the
differences were found to be statistically significant. This indicates that for the participants of
this study, ACT scores and HSGPA can be used as indicators of adequate preparation for
89
postsecondary studies leading to bachelor’s degree attainment. This also implies that educators at
the participating school should use HSGPA and ACT among other measures to offer targeted
support to at-risk students as indicated by their data.

90
References
ACT (2005a). Courses count: Preparing students for postsecondary success. Retrieved Oct. 5,
2018, from https://www.achieve.org/files/ACT%20CoursesCount.pdf
ACT (2005b). Crisis at the core: Preparing all students for college and work. Retrieved Nov.
27, 2019, from
https://www.act.org/content/dam/act/unsecured/documents/crisis_report.pdf
ACT (2008a). What kind of interpretations can be made on the basis of ACT scores? Retrieved
February 10, 2018, from
http://www.act.org/content/dam/act/unsecured/documents/ScoreInterpretations.pdf
ACT (2008b). What we know about college success: Using ACT data to inform educational
issues. Retrieved Feb. 10, 2018, from
http://www.act.org/content/dam/act/unsecured/documents/what_we_know.pdf
ACT (2010). What are ACT’s college readiness benchmarks? Retrieved March 17, 2018, from
https://files.eric.ed.gov/fulltext/ED510475.pdf
ACT (2017a). Assess, analyze, achieve: Aligning curriculum for district and student success.
Retrieved Oct. 5, 2018, from
https://www.act.org/content/dam/act/unsecured/documents/helena-case-study.pdf
ACT (2017b). The condition of college & career readiness 2017: Tennessee key findings.
Retrieved Feb. 10, 2018, from
http://www.act.org/content/dam/act/unsecured/documents/cccr2017/Tennessee-CCCR-
2017-Final.pdf
ACT (2018). Help and FAQs. Retrieved Feb. 10, 2018, from
http://www.act.org/content/act/en/products-and-services/the-act/help.html

91
ACT (2019). The condition of college & career readiness 2019. Retrieved November 27, 2019,
from https://www.act.org/content/dam/act/unsecured/documents/cccr-2019/National-
CCCR-2019.pdf
Adelman, C. (1999). Answers in the tool box: Academic intensity, attendance patterns, and
bachelor’s degree attainment. Retrieved Dec. 15, 2019, from
https://files.eric.ed.gov/fulltext/ED431363.pdf
Adelman, C. (2004). Principal indicators of student academic histories in postsecondary
education, 1972-2000. Retrieved Oct. 6, 2018, from
https://files.eric.ed.gov/fulltext/ED483154.pdf
Adelman, C. (2006). The toolbox revisited: Paths to degree completion from high school through
college. Retrieved Feb. 24, 2018, from https://files.eric.ed.gov/fulltext/ED490195.pdf
Allen, J., Robbins, S. B., Casillas, A., & Oh, I.-S. (2008). Third-year college retention and
transfer: Effects of academic performance, motivation, and social connectedness.
Research in Higher Education. 49, 647-664. doi:10.1007/x11162-008-9098-3. Retrieved
Mar. 17, 2018, from https://link.springer.com/article/10.1007/s11162-008-9098-3
Appalachian State University. (2020). The admission process. Retrieved April 18, 2020, from
https://admissions.appstate.edu/admission-process
Atkinson, R. C., & Geiser, S. (2009). Reflection on a century of college admissions test.
Educational Researcher, 38(9), 665-676, doi:10.3102/0013189X09351981. Retrieved
Mar. 24, 2020, from https://journals.sagepub.com/doi/10.3102/0013189X09351981

92
Bailey, T., Jeong, D. W., & Cho, S-W. (2010). Referral, enrollment, and completion in
developmental education sequences in community colleges. Economics or Education
Review, 29(2), 255-270. Retrieved Oct. 27, 2018, from
https://www.sciencedirect.com/science/article/pii/S0272775709001071?via%3Dihub
Banta, T. W., & Fisher, H. S. (1984). Performance funding: Tennessee's experiment. New
Directions for Higher Education, 48, 29-41, doi:10.1002/he.36919844804. Retrieved
Sept. 18, 2018, from https://onlinelibrary.wiley.com/doi/abs/10.1002/he.36919844804
Barth, P. (2003). A common core curriculum for the new century. Journal for Vocational Special
Needs Education, 26(1-2), 17-35. Retrieved Dec. 30, 2019, from
https://files.eric.ed.gov/fulltext/EJ854913.pdf
Beale, A. V. (1970). The evolution of college admission requirements. The National ACAC
Journal, 15(3), 20-22. Retrieved May 24, 2020, from
https://files.eric.ed.gov/fulltext/EJ992666.pdf
Beale, A. V. (2012). The more things change, the more they stay the same. Journal of College
Admission, 214, 23. Retrieved May 24, 2020, from
https://files.eric.ed.gov/fulltext/EJ992667.pdf
Belmont University (n.d.). Admissions FAQ. Retrieved April 18, 2020, from
http://www.belmont.edu/admissions/apply/admissions.html
Bradburn, E. M. (2002). Short-term enrollment in postsecondary education: Student background
and institutional differences in reasons for early departure, 1996-98. Retrieved Sept. 8,
2018, from https://files.eric.ed.gov/fulltext/ED470227.pdf
Braxton, J. M. (2001). Introduction to special issue: Using theory and research to improve
college student retention. Journal of College Student Retention, 3(1), 1-2.

93
Carey, K. (2005). One step from the finish line: higher college graduation rates are within our
reach. Retrieved Jan. 26, 2018, from https://1k9gl1yevnfp2lpq1dhrqe17-
wpengine.netdna-ssl.com/wp-content/uploads/2013/10/one_step_from.pdf
Carnevale, A. P., & Desrochers, D. M. (2002). The missing middle: Aligning education and the
knowledge economy. Retrieved Dec. 14, 2019, from
https://files.eric.ed.gov/fulltext/ED465092.pdf
Cimetta, A. D., D’Agostino, J. V., & Levin, J. R. (2010). Can high school achievement tests
serve to select college students? Educational Measurement: Issues and Practice, 29(2),
3-12, doi:10.111/j.1745-3992.2010.00171.x. Retrieved Nov. 11, 2019, from
https://onlinelibrary.wiley.com/doi/full/10.1111/j.1745-3992.2010.00171.x
Cohen, M. (2001). Transforming the American High School. Retrieved Dec. 30, 2019, from
https://www.my-ecoach.com/online/resources/3865/Mod_1_-_Transforminghs.pdf
Dougherty, K. J., & Reddy, V. (2011). The impact of state performance funding systems on
higher education institutions: Research literature review and policy recommendations.
Community College Research Center. Retrieved Sept. 8, 2018, from
https://files.eric.ed.gov/fulltext/ED527751.pdf
Duffourc, D. (2006). State-funded college scholarships: General definitions and characteristics.
Review of Policy Research, 23(1). Retrieved March 19, 2020, from
https://onlinelibrary.wiley.com/doi/pdf/10.1111/j.1541-1338.2006.00195.x
East Tennessee State University (2017a). Policy: Definition of credit. Retrieved April 14, 2020,
from https://www.etsu.edu/trustees/documents/academic/academic_definition-of-
credit.pdf

94
East Tennessee State University (2017b). Undergraduate admissions. Retrieved April 18, 2020,
from https://www.etsu.edu/trustees/documents/academic/academic_undergraduate-
admissions.pdf
East Tennessee State University (2020a). Learning support programs. Retrieved April 17, 2020,
from https://www.etsu.edu/uac/learningsupport/generalinfo.php
East Tennessee State University (2020b). Scholarships. Retrieved April 18, 2020, from
https://www.etsu.edu/scholarships/
East Tennessee State University (2020c). APS scholarships for Freshmen. Retrieved April 18,
2020, from https://www.etsu.edu/scholarships/aps/aps_freshmen.php
East Tennessee State University (2020d). University honors scholars: Qualification &
application. Retrieved April 18, 2020, from
https://www.etsu.edu/honors/university_scholars/apply.php
Fields, R., & Parsad, B. (2012). Tests and cut scores used for student placement in
postsecondary education: Fall 2011. Retrieved Oct. 27, 2018, from
https://files.eric.ed.gov/fulltext/ED539918.pdf
Finn, C. E., Kahlenberg, R. D., & Kress, S. (2015). Rethinking the high school diploma.
Education Next, 15(1), 48-53. Retrieved Nov. 27, 2019, from
https://www.educationnext.org/files/ednext_XV_1_forum.pdf
French, M. T., Homer, J. F., Popovici, I., & Robins, P. K. (2015). What you do in high school
matters: High school GPA, educational attainment, and labor market earnings as a young
adult. Eastern Economic Journal, 41, 370-386. doi:10.1057/eej.2014.22.

95
Furuta, J. (2017). Rationalization and student/school personhood in U.S. college admissions: The
rise of test-optional policies, 1987 to 2015. Sociology of Education, 90(3), 236-254,
doi:10.1177/0038040717713583. Retrieved Oct. 27, 2018, from
https://journals.sagepub.com/doi/10.1177/0038040717713583
Geiser, S., & Santelices, S. V. (2007). Validity of high-school grades in predicting student
success beyond the freshman year: High-school records vs. standardized tests as
indicators of four-year college outcomes. Retrieved Oct. 27, 2018, from
https://cshe.berkeley.edu/sites/default/files/publications/2007_validity_of_high-
school_grades_in_predicting_student_success_beyond_the_freshman_year_high-
school_record_vs._standardized_tests_as_indicators_of_four-year_college_outcomes.pdf
Green, S. B., & Salkind, N. J. (2011). Using SPSS for Windows and Macintosh: Analyzing and
understanding data (6th ed.). Upper Saddle River, NJ: Prentice Hall.
Greene, J. P. (2000). The cost of remedial education: How much Michigan pays when students
fail to learn basic skills. Midland, MI: the Mackinac Center for Public Policy. Retrieved
Oct. 6, 2018, from https://files.eric.ed.gov/fulltext/ED451288.pdf
Hein, V., Smerdon, B., & Sambolt, M. (2013). Predictors of postsecondary success. Retrieved
Oct. 27, 2018, from https://files.eric.ed.gov/fulltext/ED555671.pdf
Hodara, M., & Lewis, K. (2017). How well does high school grade point average predict college
performance by student urbanicity and timing of college entry? Regional Educational
Laboratory at Education Northwest. Retrieved Sept. 22, 2018, from
https://files.eric.ed.gov/fulltext/ED573041.pdf

96
Jimenez, L., Sargrad, S., Morales, J., & Thompson, M. (2016). Remedial education: The cost of
catching up. Center for American Progress, Washington, DC. Retrieved Oct. 6, 2018,
from https://files.eric.ed.gov/fulltext/ED586241.pdf
Joy, S. P. (2017). College graduation rates depend mainly on the students – but colleges matter
too. Here’s how much. Retrieved Feb. 10, 2018, from
https://files.eric.ed.gov/fulltext/ED571993.pdf
Kalenkoski, C. M., & Pabilonia, S. W. (2014). Does high school homework increase academic
achievement? Education Economics, 25:1, 45-59, doi:10.1080/09645292.2016.1178213.
Retrieved Sept. 22, 2018, from http://ftp.iza.org/dp8142.pdf
King University (2020). Admission process and requirements. Retrieved April 18, 2020, from
https://www.king.edu/admissions/undergraduate/admissions-process-and-requirements/
Kuh, G.D., Cruce, T.M., Shoup, R., Kinzie, J., & Gonyea, R.M. (2008). Unmasking the effects
of student engagement on first-year college grades and persistence. The Journal of
Higher Education, 79(5), p. 540-563. Retrieved Nov. 23, 2018, from
https://www.jstor.org/stable/pdf/25144692.pdf
Lincoln Memorial University (2020). Admission criteria. Retrieved April 18, 2020, from
https://www.lmunet.edu/undergraduate-admissions/admission-criteria.php
Lipscomb University (2020). Freshmen admissions. Retrieved April 18, 2020, from
https://www.lipscomb.edu/admissions/freshmen-admissions
Mayhew, M. J., Rockenbach, A. B., Bowman, N. A., Seifert, T. A., Wolniak, G. C., Pascarella,
E. T., & Terenzini, P. T. (2016). How college affects students. 21
st
century evidence that
higher education works (3
rd
ed.). Jossey-Ball.

97
Middle Tennessee State University. (2020a). How to apply. Retrieved April 18, 2020, from
https://www.mtsu.edu/how-to-apply/index.php
Middle Tennessee State University. (2020b). Prescribed courses. Retrieved April 18, 2020, from
https://www.mtsu.edu/university-college/university-studies/prescribed-courses.php
Milligan College. (2020a). First time college students. Retrieved April 18, 2020, from
https://admission.milligan.edu/first-time-college-students/
Milligan College. (2020b). Scholarship & Aid. Retrieved April 18, 2020, from
https://admission.milligan.edu/scholarships/
National Center for Education Statistics (2019). Graduation rates. Retrieved March 21, 2020,
from https://nces.ed.gov/fastfacts/display.asp?id=40
Noble, J., & Sawyer, R. (2002). Predicting different levels of academic success in college using
high school GPA and ACT composite score. Retrieved Nov. 11, 2019, from
https://files.eric.ed.gov/fulltext/ED469746.pdf
Pike, G. R., Hansen, M. J., & Childress, J. E. (2014). The influence of students’ pre-college
characteristics, high school experiences, college expectations, and initial enrollment
characteristics on degree attainment. Journal of College Student Retention: Research,
Theory & Practice, 16(1), 1-23, doi:10.2190/CS.16.1a. Retrieved Jan. 26, 2018, from
https://journals.sagepub.com/doi/10.2190/CS.16.1.a
Radford, A. W., & Ifill, N. (2016). Preparing students for college: What high schools are doing
and how their actions influence ninth graders’ college attitudes, aspirations and plans.
Retrieved Apr. 4, 2020, from
https://www.nacacnet.org/globalassets/documents/publications/research/pub_hsls-_-
preparing-students-for-college_.pdf

98
Radunzel, J. (2012). Where are 2003 high school graduates seven years later? Retrieved Feb.
10, 2018, from
http://www.act.org/content/dam/act/unsecured/documents/WhereDidHighSchoolGraduat
esGo.pdf
Radunzel, J., & Noble, J. (2012). Predicting long-term college success through degree
completion using ACT
Ò
composite score, ACT benchmarks, and high school grade point
average. Retrieved Feb. 10, 2018, from
http://www.act.org/content/dam/act/unsecured/documents/ACT_RR2012-5.pdf
Rolfhus, E., House, E., Douglas, B, & Leeds, D. (2017). What are the college outcomes after six
years for Tennessee’s high school class of 2007? Institute of Education Sciences.
Retrieved November 11, 2019, from https://files.eric.ed.gov/fulltext/ED591343.pdf
Schmidt, W. H. (2005). The role of curriculum. American Educator, 23(4). Retrieved April 19,
2020, from https://www.aft.org/periodical/american-educator/fall-2005/role-curriculum
Schmidt, W. H., McKnight, C. C., & Raizen, S. A. (Eds.). (2002) A splintered vision: An
investigation of U.S. science and mathematics education. New York, NY: Springer.
Schulte, M. (2016). The online credit hour: A brief history and guide to regional accreditation
similarities, differences, and how they can affect your programs. The Journal of
Continuing Higher Education, 64, 206-209. doi:10.1080/07377363.2016.1229108
Silva, E., White, T., & Toch, T. (2015). The Carnegie unit: A century-old standard in a changing
education landscape. Stanford, CA: Carnegie Foundation for the Advancement of
Teaching. Retrieved Sept. 21, 2018, from: https://www.carnegiefoundation.org/wp-
content/uploads/2015/01/Carnegie_Unit_Report.pdf

99
Southern Regional Education Board (2014). The ACT and SAT: No longer just college admission
tests. Retrieved Feb. 10, 2018, from https://www.sreb.org/sites/main/files/file-
attachments/2014policy_brief_act_sat.pdf
Stewart, V. (2012). A world-class education: Learning from international models of excellence
and innovation. Association for Supervision and Curriculum Development.
Syverson, S. T., Franks, V. W., & Hiss, W. C. (2018). Defining access: How test-optional works.
Retrieved May 24, 2020, from
https://www.nacacnet.org/globalassets/documents/publications/research/defining-access-
report-2018.pdf
Tennessee Department of Education (n.d). Report card archive. Retrieved March 13, 2020, from
https://www.tn.gov/education/data/report-card-archive.html
Tennessee Department of Education (2018a). ACT senior retake opportunity: 2018
implementation guide [PDF file]. Retrieved March 2, 2020, from
https://www.tn.gov/content/dam/tn/education/act/ccte_ACT_retake_guide.pdf
Tennessee Department of Education (2018b). School accountability: ESSA updates for 2017-18
[PDF file]. Retrieved March 17, 2020, from
https://www.tn.gov/content/dam/tn/education/documents/ESSA_school_accountability_f
act_sheet.pdf
Tennessee Higher Education Commission (2013). Tennessee education lottery scholarship
program annual report: recipient outcomes through fall 2012. Retrieved April 18, 2020,
from https://files.eric.ed.gov/fulltext/ED560719.pdf

100
Tennessee Higher Education Commission (n.d. a). Outcome-based formula narrative. Retrieved
Feb. 24, 2020, from
https://www.tn.gov/content/dam/tn/thec/bureau/fiscal_admin/fiscal_pol/obff/1-
Outcomes_Based_Formula_Narrative_-_for_website.pdf
Tennessee Higher Education Commission. (n.d. b). Tennessee Hope scholarship. Retrieved April
17, 2020, from https://www.tn.gov/collegepays/money-for-college/tn-education-lottery-
programs/tennessee-hope-scholarship.html
Tennessee State Board of Education (2017). High School Policy 2.103. Retrieved Nov. 11, 2018
from
https://www.tn.gov/content/dam/tn/stateboardofeducation/documents/2.103_High_Schoo
l_Policy_10-20-17.pdf
The University of Tennessee, Knoxville (2020a). Department of mathematics: Mathematics
placement information. Retrieved April 17, 2020, from
http://www.math.utk.edu/undergrad/placement.html
The University of Tennessee, Knoxville (2020b). Undergraduate admissions: First-year students.
Retrieved April 17, 2020, from https://admissions.utk.edu/apply/first-year/
The University of Tennessee, Knoxville. (2020c). Undergraduate admissions: Test score policy.
Retrieved April 17, 2020, from https://admissions.utk.edu/apply/first-year/uts-test-score-
policy/
The University of Tennessee, Knoxville. (2020d). Volunteer scholarship. Retrieved April 17,
2020, from https://onestop.utk.edu/scholarships/volunteer/

101
Toldson, I. A., & McGee, T. (2014). What the ACT and SAT mean for black students’ higher
education prospects. The Journal of Negro Education, 83(1), 1-4. Retrieved May 24,
2020, from
https://www.jstor.org/stable/pdf/10.7709/jnegroeducation.83.1.0001.pdf?ab_segments=0
%252Fbasic_search%252Fcontrol&refreqid=excelsior%3A14ac77232276d68f3212759a
84026452
Trusty, J., & Niles, S. G. (2004). Realized potential or lost talent: High school variables and
bachelor’s degree completion. The Career Development Quarterly, 53(1), 2-15,
doi:10.1002/j.2161-0045.2004.tb00651.x
Tusculum University (n.d.) Admissions policies. Retrieved April 18, 2020, from
https://home.tusculum.edu/apply/admission-policies/
University of North Carolina Asheville. (2020). First-year students. Retrieved April 18, 2020,
from https://www.unca.edu/admission/apply/first-year-students/
Uribe, P. E., & Garcia, M. A. (2012). Grade point averages: How students navigate the system.
Journal of Cases in Educational Leadership, 15(2), 18-23, DOI:
10.1177/1555458912448436
U.S. Department of Education (2008). Structure of the U.S. education system: U.S. grading
Systems. Retrieved Nov. 29, 2019, from
https://www2.ed.gov/about/offices/list/ous/international/usnei/us/grading.doc
U.S. Department of Education (2009). America’s high school graduates: Results of the 2009
NAEP high school transcript study. Retrieved Nov. 29, 2019, from
https://nces.ed.gov/nationsreportcard/pdf/studies/2011462.pdf

102
U.S. Department of Education (2016). ACT/SAT test preparation and coaching programs. What
Works Clearinghouse Intervention Report. Retrieved Sept. 22, 2018 from
https://files.eric.ed.gov/fulltext/ED569174.pdf
U.S. Department of Education. (2019). Graduation rates. National Center for Education
Statistics. Retrieved March 21, 2020, from https://nces.ed.gov/fastfacts/display.asp?id=40
Vanderbilt University (2020). The Vanderbilt profile. Retrieved April 18, 2020, from
https://admissions.vanderbilt.edu/profile/
Venezia, A., Kirst, M. W., & Antonio, A. L. (2003). Fix K-16 disconnections, or betray the
college dream. The Education Digest, 68(9), 34-39.
Volwerk, J. J., Tindal, G. (2012). Documenting student performance: an alternative to the
traditional calculation of grade point averages. Journal of College Admission, Summer.
Wallace, S. (2009). A dictionary of education. Oxford University Press. Retrieved March 15,
2020, from
http://www.oxfordreference.com/view/10.1093/acref/9780199212064.001.0001/acref-
9780199212064-e-88
Western Carolina University (2020). Undergraduate admissions. Retrieved April 18, 2020, from
https://www.wcu.edu/apply/undergraduate-admissions/first-year-students/admission-
paths.aspx
Witteveen, D., & Attewell, P. (2017). The college completion puzzle: A hidden Markov Model
approach. Research in Higher Education, 58(4), 449-467, doi:10.1007/s11162-016-9430-
2
103
VITA
ARIANE SONIA DAY
Education: Ed.D. Educational Leadership, East Tennessee State University,
Johnson City, Tennessee, 2020
Ed.S. Educational Leadership, Lincoln Memorial University,
Harrogate, Tennessee, 2015
M.Ed. Secondary Education, East Tennessee State University,
Johnson City, Tennessee, 2005
B.A. Foreign Languages, East Tennessee State University, Johnson
City, Tennessee, 1998
Public Schools, Geneva, Switzerland
Professional Experience: Assistant Director, University School; Johnson City, Tennessee,
2014-2020
Teacher, University School; Johnson City, Tennessee, 2001-2014
Teacher, Ashley Academy; Johnson City, Tennessee, 1999-2000
Honors and Awards: University School Centennial Award Recipient, 2010
University School Teacher of the Year, 2003-2004
