
Unclassified NEA/CSNI/R(2009)5
Organisation de Coopération et de Développement Économiques
Organisation for Economic Co-operation and Development
17-Dec-2009
___________________________________________________________________________________________
English text only
NUCLEAR ENERGY AGENCY
COMMITTEE ON THE SAFETY OF NUCLEAR INSTALLATIONS
STATE-OF-THE-ART REPORT ON NUCLEAR AEROSOLS
JT03276300
Document complet disponible sur OLIS dans son format d'origine
Complete document available on OLIS in its original format
NEA/CSNI/R(2009)5
Unclassified
English text only
NEA/CSNI/R(2009)5
2
NEA/CSNI/R(2009)5
3
THE GROUP HAVING PREPARED THIS SOAR CONSISTED OF
Hans-Josef Allelein GRS, Germany
(Chairman)
Ari Auvinen VTT, Finland
Joanne Ball AECL, Canada
Salih Güntay PSI, Switzerland
Luis Enrique Herranz CIEMAT, Spain
Akihide Hidaka JAEA, Japan
Alain V. Jones formerly JRC Ispra, EC
Martin Kissane IRSN, France
Dana Powers SNL, USA
Gunter Weber GRS, Germany
NEA/CSNI/R(2009)5
4
ANNOTATION ON THE REFERENCES
The reader will find a list of references at the end of each sub-chapter. The advantage of this is close
connection between written text and the quoted reference, the disadvantage is that some references are
listed more than once in the whole report.
The authors hope the advantage will outweigh the disadvantage.
NEA/CSNI/R(2009)5
5
EXECUTIVE SUMMARY
Background
Nuclear aerosol investigations began in the late 1960s and early 1970s. The progress made both in
experimental studies and in code development is attested to by the publication of three CSNI-sponsored
State-of-the-Art Reports (SOAR) on nuclear aerosols since 1979. Initially, fast reactor safety was the main
concern of the work, as reflected in the content of the first aerosol SOAR. The TMI accident in 1979
motivated an interest in LWR source terms and resulted in the production of a supplement to the first
SOAR which concentrated on LWR aerosol issues. In contrast to the fast reactor situation, the large
quantity of steam present in the LWR containment atmosphere following an accident tends to make aerosol
particles more compact, reducing the modelling problem of defining shape factors. On the other hand, two
new effects had to be modelled: deposition due to steam condensation onto surfaces (diffusiophoresis) and
particle growth by steam condensation onto the particles themselves.
The second SOAR dealt with primary-system fission-product release and transport. This SOAR included a
survey of the models available in the literature for homogeneous and heterogeneous nucleation, for vapor
condensation on aerosols, and for aerosol agglomeration, and noted that these and other models had been
incorporated in circuit codes.
The last workshop on aerosols organised by the OECD was held in Cologne in June 1998. One
recommendation made at this workshop was to prepare a SOAR on aerosol behaviour in both the primary
circuit and in containment.
Objectives
Following the recommendation of the Cologne workshop, the CSNI mandated the preparation of a SOAR
with four main objectives:
• To assess the status of existing experimental data and analytical capabilities required for predicting
aerosol source terms from LWR accidents
• To address the strengths and weaknesses of the codes used to predict aerosol behaviour in the
reactor coolant circuit and containment, and provide validation results and uncertainties, in
particular for plant applications,
• To summarise findings from recent ISP exercises on nuclear aerosols and related thermal-hydraulic
behaviour in the reactor coolant circuit and containment.
• To identify safety-relevant pending issues and to propose research activities that will reduce gaps in
the understanding of relevant processes and deficiencies in modelling capabilities.
Scope
The Nuclear Aerosol Writing Group met several times over a three-year period from 2003 to 2006 to
prepare the current SOAR, which provides a survey of issues surrounding the prediction of nuclear aerosol
behaviour in the primary system and containment. It should be noted that the subject matter of the report is
NEA/CSNI/R(2009)5
6
limited to nuclear aerosols and does not extend to other LWR accident source term topics that do not have
a direct bearing on aerosol behaviour.
The structure of this SOAR is in line with the objectives listed above. The introduction is followed by a
background chapter discussing the fundamentals of aerosol behaviour with bibliography of the pertinent
literature. Chapter 3 is devoted to the topics of aerosol formation/growth, transport, and retention and
release. Chapter 4 provides descriptions of codes for modelling circuit and containment aerosol behaviour,
and Chapter 5 describes the experiments used for their validation. Chapters 6 and 7 provide examples of
validation results, and plant applications of source term calculations. Chapter 8 summarises the findings of
the Cologne Workshop and progress made since, and provides recommendations for future work.
Results and their significance
The theoretical, experimental and modelling studies presented in this SOAR summarise the status and
current understanding of a wide range of nuclear aerosol topics. The significance of these results is that
they allow for the identification of existing gaps in code capability and experimental data that prevent
accurate predictions of the source term. A general conclusion from this document is that there still exist a
number of items for which additional work is required. However, the status of aerosol codes and
experimental data-bases has improved substantively since the publication of previous SOARS.
At the time when the 1994 SOAR on circuit aerosols was written, plant analysis codes, (as distinct from
special-purpose research tools) were relatively crude, and their validation base was largely confined to tests
using simulant materials. Now, while these codes still use lumped-parameter descriptions of the thermal
hydraulics that can place some constraints on the accuracy of their predictions, they include a more
complete calculation of gas-phase chemistry, interactions with particles and surfaces in the primary circuit,
and a better treatment of coupling between aerosol dynamics and thermal hydraulics in the containment.
Models are also available for aerosol interactions with engineered safety features such as suppression pools
in BWRs, and complex structures such as steam generators in PWRs.
The experimental database for development and validation of aerosol codes has benefited from more
accurate and extensive instrumentation to measure a wider range of phenomena (e.g., the ability to measure
airborne water). Numerous analytical tests have been performed, and are continuing, to address specific
phenomena such as resuspension, revaporisation, and trapping in complex structures. Large-and
small-scale containment aerosol experiments have also been performed and analysed in international
programmes, notably the KAEVER and VANAM tests. Perhaps the most significant advance on the
experimental side is the availability of integral experiments in the PHÉBUS facility on fission product and
structural material release and transport. These tests demonstrate the complex inter-linkage between
different phenomena and have refined our understanding of nuclear aerosols, particularly in the circuit,
where we are now able to refer to measured particle sizes and compositions. PHÉBUS has also provided
information on specific phenomena such as revaporisation. The PHÉBUS integral experiments are now
complete but post-test analyses and interpretation of the results continues. Data from aerosol-related
experimental programmes such as ARTIST and THAI also still require analysis.
A large number of Probabilistic Safety Analyses (PSA2) plant studies have been performed around the
world, frequently involving aspects of aerosol behaviour. This report provides some examples, including
sensitivity studies that demonstrate the impact of aerosol-related processes, however few such analyses
have been published. The aerosol community is therefore not always fully briefed on the risk-relevance of
the numerous phenomena currently under study. The question of risk significance deserves a more
concerted effort, in aerosol physics as in other relevant fields. This will require additional probabilistic
analysis for new plant designs and evaluation of their sensitivity to various models and parameters.

NEA/CSNI/R(2009)5
7
It is expected that increasingly stringent safety standards and new power reactor designs will generate
aerosol-related safety questions that will require experimental capabilities, analytical tools, and the
expertise to use both intelligently. Aerosol-related computational and modelling capability is now being
utilised to address industrial problems, and major environmental issues such as climate change are
producing a body of knowledge that should be integrated with that developed within the reactor safety
community. The CSNI structure appears well suited to developing structures and mechanisms for
stimulating such cross-fertilisation.
Conclusions and recommendations
A number of conclusions and recommendations have been made throughout the text of this document. The
most important are summarised briefly below subdivided into three categories
Generic Issues
Code-users’ workshop on plant analysis: The CSNI workshop recommended in 1998 that a meeting on
the use of severe-accident codes in plant calculations for source term estimation, including codes used by
utilities, be held. More than eight years after formulation of this recommendation it has still not been acted
upon. There remains a need to harmonise user practices with respect to plant analyses in order to reduce
divergence in results. The objective would ideally be to produce online “best practice” guidelines for the
major codes.
Shape factors: Models describing aerosol dynamics generally assume spherical, fully dense particles but
nuclear aerosols are often neither, particularly those originating from core melt sequences, or accident
scenarios in which large parts of containment have low humidity. The importance of shape factors has been
demonstrated in uncertainty and sensitivity analyses. Although such parametric studies can be performed
for accident scenarios, the difficulty is in knowing what constitutes a “reasonable” variation of the shape
factors for representative conditions. At the minimum, it is recommended that measurements of two
diameters (e.g., aerodynamic and volume-equivalent diameter) of aerosols from prototypical integral
experiments be obtained to determine the dynamic shape factor.
Reactor Coolant System Issues
Analytical support by the use of CFD Codes: CFD treatment of coupled aerosol/flow phenomena is not
universal because of the complexity of the phenomena and geometries, and the effort required for
implementation. At present, efforts are being made to simulate particle transport and deposition in complex
reactor structures with CFD, however more work needs to be done this treatment becomes satisfactorily
accurate.
Mechanical Resuspension: Existing models are inadequate to evaluate the safety impact of aerosol
resuspension in the primary circuit, which is both design- and scenario-dependent. Experiments are
required for the development and validation of models to: a) account for the porosity of a deposit, which
affects the mass and size distribution of resuspended material and b) simulate the effect of shock and
vibrations (alone and in combination with flow increases) on resuspension. There is also limited work on
the resuspension of wet deposits or wet deposits which have dried in situ. It is recommended that scoping
calculations be performed to assess the potential impact of this behaviour on the source term. Finally, it has
to be said that the consequences for a severe accident of a light-water reactor due to resuspension from the
RCS varies depending on the scenario, i.e., bypass or non-bypass sequences. For non-bypass sequences,
the influence of this resuspension on the potential source term may well be insignificant within a few
hours. However, improvement of resuspension modelling with respect to bypass sequences is clearly very
desirable.
NEA/CSNI/R(2009)5
8
Deposition in singularities and complex structures: No significant advances appear to have been made
since 1998 in the experimental investigation or the modelling of deposition in singularities such as changes
in cross section or bends. Some code improvements have been made by including the best-available
models from published literature.
Significant progress has been made with respect to deposition in steam generators (SGs). Most
probabilistic risk assessments (PRAs) and severe accident codes assume that a significant fraction of
fission products flowing through an non-isolated break in a SG escapes to the environment. This may not
be the case however, as demonstrated in several recent experimental programmes. SGTR was the first
European project (2000-2002) to improve understanding in a systematic way of possible retention
mechanisms in tubes and in the complex structures of the secondary side of a SG. In particular, the
PSAERO and HORIZON experiments from Finland were conducted to study in-tube retention whereas
retention in the SG bundle has been investigated in PECA-SGTR and the ongoing ARTIST experiments
(respectively in Spain and Switzerland). In addition, certain modelling efforts to develop a correlation for
the retention in the bundle were initiated. Thorough interpretation of the data from the above experiments
is incomplete and modelling efforts continue. It is expected that the main issues regarding SGTR will be
answered after termination of these activities.
Particle break-up in highly turbulent flows: Highly turbulent flow inside a tube may induce break-up of
particles due to (i) impaction on the walls, (ii) strong shear in the flow or (iii) the vena contracta and shock
wave at the tube exit. This phenomenon was observed, e.g., in Phase I of the ARTIST tests as well as in
supplementary experiments. However, to determine whether aerosol particles may break up in severe
accidents would require more information on the structure and the nature of the bonding forces between
primary particles for severe accident aerosols as well as for the TiO
2
agglomerates used in ARTIST Phase
I. In Phébus tests, which produced more prototypical aerosols, SEM micrographs showed fairly compact,
sintered agglomerate structures unlike the ARTIST TiO
2
particles. Consequently, intra-particle forces can
be expected to be higher in reality than in these TiO
2
agglomerates. Nevertheless, the issue is of some
importance since the generation of submicron particles from supramicron ones leads to less-efficient
retention of the aerosols concerned. In the first instance, accident sequences other than SGTR inducing
highly-turbulent flows need to be identified; comparison of plant calculations without and with (assumed)
break-up for SGTR and the other pertinent sequences would then allow evaluation of the risk relevance of
the break-up phenomenon. If the risk impact is significant then, in the absence of relevant data for severe
accident aerosols, data for prototypical particles are needed in highly-turbulent accident-relevant
conditions.
Impact of Chemistry: The fundamental importance of chemistry to prediction of source terms arising from
potential severe accidents is well established. Nuclear safety codes model chemical reactions using the
thermodynamic equilibrium approach, which relies on having thermodynamic data for each chemical
species covered. Unfortunately, the uncertainties associated with some of these data are often large and
divergence between data series originating from different sources can be considerable. It is recommended
(as is being done for the ASTEC code) that the thermo-chemical data used by codes be thoroughly verified
and that key sources of uncertainty be identified. Moreover, while the thermodynamic approach is
pragmatic, it is of limited value when addressing accident scenarios in which slow chemical kinetics
precludes achievement of thermodynamic equilibrium (e.g. secondary-side, cold-leg and containment
conditions). In this context it is recommended to:
• Assess the value of the simplistic approach (taken in ASTEC/SOPHAEROS and VICTORIA codes)
of assigning user-defined cut-off temperatures below which chemical reactions in the RCS do not
occur. Use of PHÉBUS FP results with respect to iodine in the RCS should prove helpful;
• Follow closely experimental programmes that are investigating reaction rates for iodine species
(e.g., the French CHIP series).

NEA/CSNI/R(2009)5
9
• Assess whether FP species other than iodine, which may reach the containment in the vapor phase,
require kinetic modelling (especially important for hot-leg and high-pressure sequences where vapor
fractions at the RCS breach will be significant).
• Lastly, the effects of radiolysis in the RCS are unknown. Radiolysis may have little impact in the
core region (temperatures being so high that only simple atomic and radical species exist), but may
be important in cooler regions of the RCS involving significant deposits (high local dose rate) such
as in a cold-leg sequence. In terms of direct consequences for aerosols, one effect will be reduction
of the threshold super-saturation at which vapors nucleate since a high density of
electrically-charged condensation nuclei will form. In terms of consequences for the source term, the
meagre state of knowledge renders even qualitative evaluation difficult.
Revaporisation of deposits: Although significant progress has been made regarding studies on
revaporisation from several projects (Phébus FP, the EC 4th Framework Programme projects RVP and
REVAP-ASSESS and the EXSI project), experimental work on revaporisation remains scarce; further
theoretical and experimental developments are necessary to understand the revaporization process. In
addition, the safety relevance ought to be further demonstrated by assessing, conceivably, the impact of a
weak source of fission products from the reactor coolant system for some hours after the main
release-from-core phase.
Containment Issues
Charge effects: Small deposits of aerosols on the outer walls of the 10 m
3
containment vessel in the
PHÉBUS test FPT0 could not be explained by electrophoretic effects. However, even if charge effects on
aerosol deposition are not seen to be significant in test facilities (with or without a radiation field) there is
no firm evidence that this effect would be negligible in an accident. At present there is no consensus
among experts on whether further investigations of charging effects are necessary or not.
Mixed aerosols in condensing atmospheric conditions: Although there has been considerable progress in
modelling aerosol deposition as a function of relative humidity, a comparison of the adequacy of code
results from ISP 37 and ISP 44 indicate that there is still some work to be done to ensure satisfactory
coupling between thermal hydraulic and aerosol models so that these capture correctly aerosol behaviour in
most environments. An additional uncertainty in modelling aerosol behaviour in the containment in humid
conditions arises from determining the hygroscopicity associated with a mixture of aerosols of different
compositions. Finally, there is some uncertainty regarding the density of multi-component aerosols, and
whether this parameter is important for accident conditions with a wide variety of aerosol components.
Both the PHÉBUS tests and the KAEVER experiments suggest that an average aerosol particle
composition and size might be attained in containment. The KAEVER experiments further suggest that this
average particle would behave like the most hygroscopic of its individual components. Confirmation of
these findings, in a large- or intermediate-scale experiment performed under saturated conditions might
significantly simplify modelling aerosol behaviour in wet conditions.
Mechanical Resuspension: Compared with deposits in the primary system, deposits in containment will
have significantly lower particle loadings, and be distributed over larger areas. Resuspension of such
deposits is possible as a consequence of a breach of containment and/or a hydrogen burn. It is
recommended that experimental studies be performed on resuspension of real or simulated deposits at
containment-typical loadings, particularly during flow disturbances, as a function of the deposit
composition and history (dry, wet, wet then dried in situ etc.) and as the result of hydrogen deflagrations.
In addition, probabilistic studies should be undertaken to evaluate the safety significance of containment
resuspension.
NEA/CSNI/R(2009)5
10
Re-entrainment in the Containment: Re-entrainment of particulate fission products will occur at several
water and core melt pools during a severe accident. The release rates of radiological materials are relatively
small but the sources are persistent. A significant contribution to the source term by re-entrainment is
possible in the late accident phase. However, reliable analytical investigations including risk relevant
aspects do not exist yet. With a few exceptions, there are only a few codes able to simulate the FP release
from boiling or flashing sumps.
Up to now all re-entrainment tests including ThAI have been made on ideal systems with appropriate
concentrations of soluble and insoluble materials but without surfactants or impurities. Additional
experiments are required to evaluate entrainment under realistic conditions. After improvement and
validation of re-entrainment models for realistic conditions is achieved reliable accident calculations to
quantify the effect of re-entrainment from boiling pools on the source term will be possible. In the light of
these results it may be desirable to investigate measures reducing the release of fission products by
re-entrainment.
Pool scrubbing: Some BWR and PWR severe accident scenarios involve transport of radioactive aerosols
through pools of water where particles can be retained. This phenomenon, known as pool scrubbing, has
the potential to reduce the source term. Results provided by both stand-alone and integral code models
indicate satisfactory agreement with simple experiments for integral retention. However, a systematic
experimental database is required for validation purposes. Particular attention should be given to removal
of aerosols during formation and subsequent disintegration and coalescence of bubbles, and the effects of
submerged structures and contaminants (surfactants).
Removal by sprays: This issue has been extensively investigated by the French organisations CEA and
IRSN using specific apparatuses and the CARAIDAS, MISTRA and TOSQAN test facilities. The data
should be made accessible to the nuclear community, at least the OECD partners. Validated modelling
based on these experimental investigations has been implemented in the codes ASTEC and TONUS. The
ASTEC model can be found in the open literature. Further work on containment sprays is low priority for
countries that have access to this data but in other countries and for certain advanced designs it remains
important to establish effective removal by spray systems and both experimental and analytical efforts
continue.
Influence of recombiners: Phenomenological experiments have demonstrated that there is a potential for
the operation of Passive Autocatalytic Recombiners (PARs) to generate volatile molecular iodine by
thermal decomposition of metal-iodide containment aerosols. Scoping calculations indicate that this
conversion process might be a significant contribution to the molecular iodine in the containment
atmosphere. It has also to be recognised that iodine may not be the only fission product concerned, e.g.,
some formation of the highly volatile species ruthenium tetroxide might be possible in the conditions
expected within PARs though no investigation of this has been performed. Further experimental
investigations in realistic conditions (mixed-aerosol and mixed-atmosphere composition) are necessary.
Hydrogen-burn effects on suspended aerosols: Heat release by hydrogen burns may have a strong effect
on aerosol characteristics and could possibly liberate volatile forms of iodine. Experiments in the ThAI
facility demonstrate that there is a clear effect of hydrogen-combustion-induced flows on resuspension of
already deposited CsI aerosol. These findings have to be expanded to consider other types of relevant
aerosol species and other plant applications. However, chemical effects on iodine-containing aerosols have
not been studied; information from the ongoing investigation of the impact of recombiners on aerosols may
be relevant.
Release from MCCI pool: The behaviour of aerosols formed after the release from a molten corium
concrete pool was investigated in the 1990s in the ACE phase C and BETA tests and more recently in the
NEA/CSNI/R(2009)5
11
OECD-MCCI and EC Framework Programmes (LPP and MP projects). However, efforts to further aerosol
code development and validation from these experiments has been limited. As there is currently little
known activity in this area it is recommended that the following steps be initiated in the near future:
a)
● Recalculation of the old test results to evaluate the thermodynamic basis of the present models by
comparing concrete erosion processes and aerosol nucleation due to vaporization from the free
upper surface and into gas bubbles in the corium concrete pool,
● Obtain information on the characterization of concrete-based aerosols; conventional
(non-nuclear) knowledge about concrete aerosols may be a good starting point;
● Evaluate information from the EC projects MP and LPP from the specific view of fission
products release due to MCCI;
Penetration of aerosols through leak paths: From a review of available data and models including recent
research in SARNET on dry aerosol transport in cracks, the recommendation can be made that additional
separate effects and integral tests are required:
● Separate effect tests should provide a detailed characterization of the scenarios and the
phenomena necessary for model development and validation of individual depletion mechanisms;
● Integral tests should focus on measuring overall process variables such as mass retained to
provide a data base for checking the overall model performance.
The boundary conditions (hydraulic diameter, curvature of the path, fluid composition pressure drop, wall
temperature, and aerosol size) for these experiments should, obviously, be as close as possible to those
postulated under accident conditions.
For wet aerosols, it is recommended that additional experiments be performed to characterise aerosol
transport through sequential expansion and contraction regions representative of the leak path from
containment to the outside atmosphere and to evaluate the extent of leak-path plugging.
Fire aerosols: Little is known about the properties or amounts of aerosols produced from fires, and how
mixing of flaky fire aerosol with nuclear aerosol particles would impact on the aerosol depletion rate in
containment. There is a need for further experimental investigation of fire aerosols especially from cable
fires. This could be done in a future step of the OECD PRISME and/or the Sandia CAROLFIRE projects.
The aerosol production rate, the particle size distribution and the shape factors are of main concern. It is
recommended that existing multi-component aerosol models be extended in order to simulate the
interaction of fire aerosols with a pre-existing nuclear aerosol.
NEA/CSNI/R(2009)5
12
NEA/CSNI/R(2009)5
13
TABLE OF CONTENTS
EXECUTIVE SUMMARY ............................................................................................................................ 5
TABLE OF CONTENTS .............................................................................................................................. 13
1. INTRODUCTION ................................................................................................................................. 19
2. GENERAL PHENOMENA................................................................................................................... 21
2.1 Aerosol Physics in Reactor Accident Analyses .............................................................................. 21
2.2 Aerosol Formation .......................................................................................................................... 23
2.3 Growth of Aerosol Particles ........................................................................................................... 25
2.3.1 Growth by coagulation ............................................................................................................. 25
2.3.2 Growth by condensation ........................................................................................................... 28
2.4 Aerosol Growth as a Result of Hygroscopicity .............................................................................. 30
2.5 Fractal Nature of Aerosols.............................................................................................................. 31
2.6 Aerosol Deposition ......................................................................................................................... 31
2.6.1 Gravitational settling and diffusion .......................................................................................... 32
2.6.2 Inertial deposition of aerosol particles ..................................................................................... 33
2.6.3 Phoretic deposition processes ................................................................................................... 35
2.7 Resuspension of Deposited Particles .............................................................................................. 36
2.8 Aerosol Removal by Engineered Safety Systems .......................................................................... 37
2.8.1 Steam suppression pools .......................................................................................................... 40
2.8.2 Fan coolers ............................................................................................................................... 41
2.9 Aerosol Removal by Filtered Vents ............................................................................................... 41
2.10 Computer Modelling of Aerosols ................................................................................................... 43
2.11 Annotated Bibliography ................................................................................................................. 43
3. ACCIDENT PHENOMENOLOGY ...................................................................................................... 49
3.1 Formation and Growth ................................................................................................................... 49
3.1.1 Phenomena considered and state of knowledge ....................................................................... 49
3.1.2 Particle formation in the primary system ................................................................................. 52
3.1.3 Containment aerosols ............................................................................................................... 55
3.2 Impact of Thermal Hydraulics........................................................................................................ 57
3.2.1 Impact of thermal hydraulics on aerosol behaviour in the primary circuit .............................. 57
3.2.2 Impact of thermal hydraulics on aerosol behaviour in the containment................................... 59
3.3 Fission-Product Transport and Deposition ..................................................................................... 64
3.3.1 Introduction .............................................................................................................................. 64
3.3.2 Synopsis of RCS phenomena and their modelling ................................................................... 64
3.3.3 Agglomeration of aerosols ....................................................................................................... 66
3.3.4 Deposition of aerosols .............................................................................................................. 67
3.3.5 Containment ............................................................................................................................. 70
3.4 Aerosol Behaviour in Complex Structures of Steam Generator Secondary Site ............................ 73
3.4.1 Issue and status ......................................................................................................................... 73
3.4.2 Theoretical background on possible aerosol removal in the steam generator .......................... 76
3.4.3 Inertial impaction and interception in the separator and dryer sections ................................... 79
3.4.4 Other processes ........................................................................................................................ 79
NEA/CSNI/R(2009)5
14
3.5 Resuspension .................................................................................................................................. 82
3.5.1 Resuspension in primary circuit ............................................................................................... 82
3.5.2 Resuspension in containment ................................................................................................... 85
3.6 Pool Scrubbing ............................................................................................................................... 87
3.7 Re-Entrainment .............................................................................................................................. 92
3.8 Aerosol Formation during High Pressure Melt Expulsion from the Reactor Coolant System ....... 96
3.9 Aerosols from MCCI .................................................................................................................... 100
3.10 Aerosols from Fire ........................................................................................................................ 108
3.11 Spray Systems .............................................................................................................................. 111
3.12 The Impact of Catalytic Hydrogen Recombiners ......................................................................... 121
3.13 Filters ............................................................................................................................................ 123
3.14 Two Phase Flashing Jets and Water Aerosol Behaviour .............................................................. 127
3.15 Penetration Leakages .................................................................................................................... 130
3.15.1 Introduction ............................................................................................................................ 130
3.15.2 Current modelling and experimental studies .......................................................................... 131
3.15.3 Measurement of the retention of wet aerosols ........................................................................ 132
4. MODELLING APPROACHES IN CODES (INCLUDING BASIC VALIDATION) ....................... 137
4.1 Integral Codes ............................................................................................................................... 137
4.1.1 MELCOR ............................................................................................................................... 137
4.1.2 ASTEC (SOPHAEROS and CPA) ......................................................................................... 142
4.1.3 MAAP4 .................................................................................................................................. 147
4.1.4 THALES 2.............................................................................................................................. 149
4.1.5 ECART ................................................................................................................................... 155
4.1.6 APROS SA ............................................................................................................................. 157
4.2 Circuit ........................................................................................................................................... 161
4.2.1 VICTORIA ............................................................................................................................. 161
4.2.2 ATHLET-CD ......................................................................................................................... 168
4.3 Containment ................................................................................................................................. 169
4.31 CONTAIN .............................................................................................................................. 169
4.3.2 COCOSYS ............................................................................................................................. 175
4.3.3 ART/REMOVAL ................................................................................................................... 181
4.3.4 SMART .................................................................................................................................. 183
4.3.5 GOTHIC ................................................................................................................................. 184
4.3.6 KUPOL .................................................................................................................................. 185
5. RECENT VALIDATION WORK ....................................................................................................... 187
5.1 Integral Experiments .................................................................................................................... 187
5.1.1 The PHÉBUS fission product programme ............................................................................. 187
5.1.2 ISP-46 (PHÉBUS FPT1) ........................................................................................................ 190
5.2 Circuit ........................................................................................................................................... 193
5.2.1 Revaporization in the FPT0, FPT1 and FPT2 circuits ........................................................... 193
5.2.2 FALCON (Including ISP-34) ................................................................................................. 194
5.2.3 STORM (Including ISP-40) ................................................................................................... 197
5.2.4 WIND ..................................................................................................................................... 204
5.3 Containment Experiments ............................................................................................................ 207
5.3.1 DEMONA .............................................................................................................................. 207
5.3.2 MARVIKEN-V ...................................................................................................................... 209
5.3.3 LACE ..................................................................................................................................... 211
5.3.5 VANAM (including ISP-37) .................................................................................................. 217
5.3.6 KAEVER (including ISP-44) ................................................................................................. 222
NEA/CSNI/R(2009)5
15
5.3.7 AHMED ................................................................................................................................. 228
5.3.8 VICTORIA ............................................................................................................................. 232
5.4 Aerosol Release in the Course of MCCI (ACE-C) ....................................................................... 236
5.5 REST, REVENT, ThAI Re-Entrainment Tests ............................................................................ 237
5.6 Pool Scrubbing Tests .................................................................................................................... 239
5.7 Resuspension Tests ....................................................................................................................... 242
5.7.1 Continuous flow experiments ................................................................................................. 242
5.7.2 Transient flow experiments .................................................................................................... 243
5.8 Spray Systems (French Tests) ...................................................................................................... 244
5.9 Containment Venting Filters ........................................................................................................ 247
5.9.1 International efforts for qualification of containment venting rilters ..................................... 248
5.9.2 CCI containment venting filter ............................................................................................... 255
5.9.3 Removal of iodine by the containment venting filters ........................................................... 258
5.9.4 International status of use of containment venting filters ...................................................... 258
5.10 Ongoing Tests ............................................................................................................................... 258
5.10.1 Aerosol behaviour in steam generators .................................................................................. 258
5.10.2 EVAN ..................................................................................................................................... 264
5.10.3 Penetration leakage tests ........................................................................................................ 265
5.10.4 ThAI aerosol tests ................................................................................................................... 266
5.10.5 Impact of catalytic hydrogen recombiners ............................................................................. 269
5.10.6 Aerosol growth under saturated conditions (Canadian tests) ................................................. 272
6. EXAMPLES FOR VALIDATION ...................................................................................................... 273
6.1 Comparison of MELCOR Predictions to Experiments ................................................................ 273
6.2 CONTAIN for PHÉBUS FPT1 .................................................................................................... 277
6.3 Example for Uncertainty and Sensitivity Analyses of Two Aerosol Calculations ....................... 283
7. SOURCE TERM CALCULATIONS IN PLANT APPLICATIONS ................................................. 287
7.1 MELCOR Calculation for a US American PWR (Station Blackout Scenario) ............................ 287
7.2 ASTEC Calculation for a German PWR (MB LOCA Scenario) ................................................. 294
7.3 Aerosol-Related Uncertainties in the Prediction of Severe Accident Source Terms ................... 304
8. IDENTIFIED OPEN ISSUES (INCLUDING RECOMMENDATIONS) .......................................... 307
8.1 Introductory Remarks ................................................................................................................... 307
8.2 Generic Issues ............................................................................................................................... 308
8.2.1 Code-users’ workshop on plant analysis ................................................................................ 308
8.2.2 Shape factors .......................................................................................................................... 308
8.2.3 Computational fluid dynamics codes ..................................................................................... 309
8.3 Reactor Coolant System Issues .................................................................................................... 309
8.3.1 Mechanical resuspension ........................................................................................................ 309
8.3.2 Deposition in singularities and complex structures ................................................................ 310
8.3.3 Particle break-up in highly turbulent flows ............................................................................ 311
8.3.4 Influence of chemistry ............................................................................................................ 311
8.3.5 Revaporisation of deposits ..................................................................................................... 312
8.4 Containment Issues ....................................................................................................................... 313
8.4.1 Charge effects ......................................................................................................................... 313
8.4.2 Mixed aerosols in condensing atmospheric conditions .......................................................... 313
8.4.3 Mechanical resuspension ........................................................................................................ 313
8.4.4 Re-entrainment from pools ..................................................................................................... 314
8.4.5 Pool scrubbing ........................................................................................................................ 314
8.4.6 Removal by sprays ................................................................................................................. 315
NEA/CSNI/R(2009)5
16
8.4.7 Influence of recombiners ........................................................................................................ 315
8.4.8 Hydrogen-burn effects on suspended aerosols ....................................................................... 315
8.4.9 Release from MCCI pool ....................................................................................................... 316
8.4.10 Penetration through leak paths ............................................................................................... 317
8.4.11 Fire aerosols ........................................................................................................................... 317
8.5 Concluding Remarks .................................................................................................................... 318
9. APPENDIX 1: Characteristics of Aerosols under LWR Severe Accident Conditions ................... 323
9.1 Context ......................................................................................................................................... 323
9.2 Review of Available Information ................................................................................................. 323
9.2.1 Aerosols in the RCS ............................................................................................................... 324
9.2.2 Aerosols in the containment ................................................................................................... 329
9.3 Discussion .................................................................................................................................... 331
9.3.1 Uranium contribution ............................................................................................................. 331
9.3.2 Tin contribution ...................................................................................................................... 331
9.3.3 Silver contribution .................................................................................................................. 331
9.3.4 Cadmium contribution ............................................................................................................ 331
9.3.5 Indium contribution ................................................................................................................ 331
9.3.6 Fission product contribution ................................................................................................... 332
9.3.7 Size, shape and structure ........................................................................................................ 332
9.3.8 Variability............................................................................................................................... 333
9.3.9 Other considerations ............................................................................................................... 333
9.4 Conclusion .................................................................................................................................... 334
10. APPENDIX 2: Aerosol Shape Factors ............................................................................................. 337
10.1 Fundamentals ................................................................................................................................ 337
10.2 Dynamic and Collision Shape Factors ......................................................................................... 338
11. APPENDIX 3: Spray Modelling Developed from Recent Analytical Work ................................... 345
11.1 Relaxation of Droplets .................................................................................................................. 345
11.2 Droplet Coalescence ..................................................................................................................... 346
11.3 Coupling of Droplet Relaxation and Coalescence ........................................................................ 347
11.4 Evolution of the Atmosphere Conditions ..................................................................................... 349
11.5 Aerosol Removal Modelling ........................................................................................................ 350
11.5.1 Inertial capture ........................................................................................................................ 350
11.5.2 Interception............................................................................................................................. 351
11.5.3 Brownian diffusion ................................................................................................................. 352
11.5.4 Phoretic capture ...................................................................................................................... 352
11.6 Gaseous Iodine Removal by Sprays ............................................................................................. 353
12. APPENDIX 4: Overview of Filtration Devices ............................................................................... 357
12.1 Nuclear Aerosol Filtration ............................................................................................................ 357
12.1.1 Development of the high-efficiency particulate air (HEPA) filter ......................................... 357
12.1.2 Challenges for test procedures ............................................................................................... 359
12.1.3 Demonstrated safety by the use of HEPA filters .................................................................... 359
12.1.4 Deep-bed sand and glass fibre filters ..................................................................................... 359
12.1.5 Brief history of gas adsorption ............................................................................................... 360
12.2 Type of Filters in Use ................................................................................................................... 361
12.3 Normal Operation and Design Basis Accidents ........................................................................... 361
12.4 Brief Review on Mechanisms of Filtration .................................................................................. 363
12.5 Characterisation of Filter Performance......................................................................................... 365
NEA/CSNI/R(2009)5
17
12.6 Cut Diameter Method .................................................................................................................. 367
12.7 Fibrous Filter ............................................................................................................................... 368
12.8 Granular Beds .............................................................................................................................. 370
12.9 Sand Beds .................................................................................................................................... 373
12.10 Gravel Beds ................................................................................................................................. 374
12.11 Venturi Scrubbers ........................................................................................................................ 376
12.12 Water Pools ................................................................................................................................. 379
13. APPENDIX 5: Point-by-Point Review of Issues Identified at the 1998 Aerosol Workshop ........... 385
NEA/CSNI/R(2009)5
18
NEA/CSNI/R(2009)5
19
1. INTRODUCTION
The prediction of nuclear aerosols behaviour associated with postulated accidents in nuclear power plants
is necessary for the assessment of the radiological consequences of these accidents and hence is an
important aspect of reactor safety evaluation. The nature and behaviour of nuclear aerosols can potentially
influence both the course and the consequences of reactor accidents. For example, nuclear aerosols can
affect the performance of engineered safety systems (e. g. air cleaning systems) as well as the magnitude,
dispersion and effects of the radioactive source term leaked to the atmosphere. As a result of the extreme
conditions for nuclear aerosols in case of an accident, they exhibit very dynamic mostly physical, but also
chemical behaviour and pose special analytical and experimental problems different from those associated
with aerosols found under industrial and ambient conditions.
Following a LWR severe accident, the overall radionuclide retention in form of aerosol, both in reactor
coolant system and containment, is the result of three processes: transport, deposition and release from dry
or wet surfaces (resuspension) or (boiling) water pools (re-entrainment).
Approximately a 30 years tradition in the preparation of state-of-the-art reports on nuclear aerosols and the
proceedings of workshops concerning the aerosol issue (summarised in chronological order at the end of
this chapter [1 - 8]) demonstrate the substantial work performed by the nuclear community and the
progress made in this period of 30 years.
Nevertheless at the last workshop in Cologne, 1998, some important issues were identified, where
knowledge did not seem to be sufficient for realible predictions. Following the recommendations of this
workshop the CSNI decided to prepare a state-of-the-art report with three main objectives:
• to summarise the present experimental and analytical knowledge on nuclear aerosols
• to give some examples for validation results and in particular for plant applications, both including
uncertainties
• to identify safety relevant still unresolved issues
Nevertheless, it should be understood that the subject matter of the report is nuclear aerosols, and the report
does not purport to cover the whole field of radioactive source terms for severe LWR accidents. For
example, there is no detailed discussion of fission product chemistry processes that do not have a direct
bearing on aerosol behaviour, such as iodine solution chemistry and organic iodine production.
Finally the authors of this report wish to acknowledge significant contributions from a large number of
colleagues, which have increased the quality of the report considerably.
References
[1] NEA Group of Experts, Nuclear Aerosols in Reactor Safety , A state-of-the-art report by a group
of experts of the NEA committee on the safety of nuclear installations, June 1979
[2] CSNI Specialist Meeting on Nuclear Aerosols in Reactor Safety in Gatlinburg, April 1980
NEA/CSNI/R(2009)5
20
[3] CSNI Group of Experts on Nuclear Aerosols in Reactor Safety, March 1983
[4] CSNI Specialist Meeting on Nuclear Aerosols in Reactor Safety Workshop Karlsruhe, September 1984
[5] NEA Group of Experts, Nuclear Aerosols in Reactor Safety - Supplementary Report
NEA / OCDE /OECD, Paris 1985
[6] Nuclear Engineering Applications Section Species to Aerosols - Workshop on Water-Cooled
Reactor Aerosol Code Evaluation and Uncertainty Assessment, Brussels, September 1987
[7a] OECD / NEA, Aerosol behaviour and thermal-hydraulics in the containment (2
nd
workshop
Brussels 1987, Technical Summary), NEA/CSNI/R(92)1, Fontenay-aux-Roses, 1990
[7b] OECD / NEA Aerosol behaviour and thermal-hydraulics in the containment (2
nd
workshop
Brussels 1987, Proceedings) NEA/CSNI/R(92)1, Fontenay-aux-Roses, 1990
[8] Third OECD Specialist Meeting on Nuclear Aerosols in Reactor Safety GRS-166,
NEA/CSNI/R(98)4, ISBN 3-931995-31-3, Cologne, June 1998

NEA/CSNI/R(2009)5
21
2. GENERAL PHENOMENA
This chapter provides background and introductory information and is directed primarily at those readers
with an interest in being reminded of the fundamentals of aerosol behaviour under severe reactor accident
conditions. In addition, there is an annotated bibliography that will introduce the reader to the pertinent
research literature.
2.1 Aerosol Physics in Reactor Accident Analyses
Most of the radioactive material that can escape from a nuclear power plant during a severe reactor
accident will do so in the form of aerosols. Much of reactor accident analysis is the prediction of the
behaviour of these radioactive aerosols. Aerosols are very small solid particles or liquid droplets suspended
in a gas phase. The suspended solid or liquid particles typically have a range of sizes. Particles may range
in size from 0.01 µm to 20 µm. Aerosol concentrations in reactor accident analyses are typically less than
100 g/m
3
and usually less than 1 g/m
3
. At these concentrations, the aerosol particles little affect the gas
hydrodynamics, but the gas dynamics profoundly affect the behaviour of the suspended particles. The
behaviours of the larger aerosol particles are described usually by continuum mechanics. The smallest
particles have diameters less than the mean free path of gas phase molecules and the behaviour of these
particles can often be described well by free molecular physics. The vast majority of aerosol particles
arising in reactor accident analyses have behaviours in the very complicated regime intermediate between
the continuum mechanics and free molecular limit. In this regime, aerosol behaviour must be described
using some approximate solution of the Boltzmann equation.
The mechanical regimes of aerosol behaviour are usually categorised in terms of the Knudsen number, Kn,
which is the ratio of the mean free path of
gas molecules, λ, to the particle diameter
p
D :
Continuum behaviour is approached for Kn < 0.1 and free molecular flow is approached for Kn > 10.
These regimes vary with temperature and pressure which affect the mean free path. At atmospheric
pressure and room temperature the mean free path of air is about 0.06 µm.
The number density of aerosol particles in a gas phase can be huge - exceeding 10
13
/m
3
. It is quite
impossible to predict aerosol behaviour by calculating the dynamics of individual particles. Instead
aerosols must be considered in a collective sense and the aerosol is taken to have some continuous
distribution of particle sizes. Given sufficient time in a quasi-steady state environment with no continued
injection of aerosol into the gas phase, an aerosol subjected to particle growth by agglomeration and
gravitational deposition onto surfaces will develop a size distribution that is approximated well by a
log-normal distribution. The probability density for particles having sizes in the interval
p
D to
p
D + d
p
D
is:
p
D
2
Kn
λ
=

NEA/CSNI/R(2009)5
22
p
2
p
p
Dn1d
σn21
µ/nD1
exp
σn12
1
)D(pdf
−
π
=
where:
µ = mean particle size
σ = geometric standard deviation of the size distribution
It is common to report aerosol size data in terms of the parameters of the lognormal size distribution (µ and
σ) whether or not the aerosol satisfies the criteria for the lognormal distribution being a good
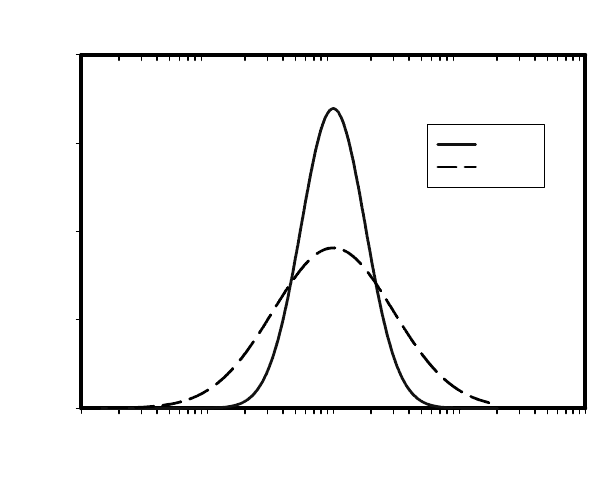
approximation of the actual size distribution. Example size distribution for the case of a very narrow size
distribution (σ = 1.8) and for the case of a broad distribution (σ = 3) are shown in Fig. 2.1-1.
When there are continuing sources of aerosol to the gas phase or when there are complicated processes
involving engineered safety features much more complicated size distributions develop. It is not
uncommon for aerosols in reactor containments to have bimodal size distributions at least for some
significant periods of time early in an accident.
Salient features of aerosol physics under reactor accident conditions that will affect the nature of the
aerosols are:
• formation of aerosol particles
• growth of aerosol particles
• shape of aerosol particles
• deposition of particles on surfaces
• resuspension of aerosol particles
Introductory or background information on these and other aspects of nuclear aerosols are provided in the
subsections of this chapter that follow. This chapter is concluded with a brief description of the numerical
methods used to model the important aerosol phenomena.
NEA/CSNI/R(2009)5
23
Particle Size (µm)
0.01 0.1 1 10 100
Probability Density
0.0
0.2
0.4
0.6
0.8
σ = 1.8
σ = 3.0
Fig. 2.1-1 Comparison of log normal distributions with different geometric standard deviations, s, and
the same mean, µ
2.2 Aerosol Formation
Aerosol particles can be formed by the mechanical comminution of materials or by the condensation of
vapors. Mechanical processes that produce aerosol particles in reactor accidents include:
• entrainment of solids or liquid droplets in high velocity gas flows,
• expulsion of droplets by gases bubbling through liquids,
• shock waves such as those produced in energetic interactions of molten materials with coolants, and
• high pressure melt ejection from the reactor coolant system.
Mechanical processes seldom produce very fine particles that can remain suspended in the gas phase for
protracted periods of time. Typically, mechanical processes will not produce particles smaller than about
1-2 µm. Furthermore, most mechanical processes that can produce aerosols are not of prolonged duration
and are, thus, not enduring sources of aerosols through large periods of an accident. An exception is the
production of aerosols by the bursting of bubbles of gas sparging through liquids. But, the bubble burst
source is not an especially intense source of aerosol particles. Aerosol production by mechanical processes
is largely ignored in most reactor accident analyses.
Nucleation of particles from supersaturated vapors is the more important source of aerosols in reactor
accidents and certainly the source given the most attention in reactor accident analysis computer codes.
Vapors rich in radioactive materials are formed from high temperature core debris materials. The vapors
become supersaturated as they are transported from the vicinity of the core debris to cooler regions. These
supersaturated vapors can nucleate aerosol particles.
Vapor nucleation is a very complicated physical process even when the vapor consists of a single
condensable species. Nucleation can occur homogeneously from the vapor when the supersaturation ratio

NEA/CSNI/R(2009)5
24
(ratio of the actual partial pressure of condensable species divided by the equilibrium partial pressure of
that species) exceeds a value of 4 - 10. Nucleation is a kinetic process and there is not a sharp onset to this
process. Nucleation is usually taken to be occurring when the rate of particle production exceeds one
particle per cubic centimeter per second. The supersaturation necessary for any particular vapor to nucleate
is a sensitive function of the surface energy of the condensed phase (surface tension in the case of a liquid
being produced from the vapor). The rate of tin vapor nucleation is shown in Fig. 2.2-1 as a function of
temperature for a vapor initially saturated at 1800 K. It can be seen from this example that nucleation
occurs whenever the gas is saturated, but nucleation is quite slow until a substantial supersaturation
develops. That is, the vapor has to cool well below saturation for detectable nucleation to be observed.
Detectable nucleation (Rate > 1 particle/cm
3
-s) of the tin aerosol occurs rather abruptly over a narrow
temperature range at a temperature over 100 K lower than the temperature at which the vapor becomes
saturated. The enormous nucleation rates predicted at still lower temperatures are difficult to realise in
practice because heat liberated by nucleation cannot be dissipated from the system.
Temperature (K)
1600 1620 1640 1660 1680 1700 1720
Nucleation Rate (particle/cm
3
-s)
Nucleation Rate
1 particle/cm
3
-s
Fig. 2.2-1 Nucleation kinetics of tin vapor initially saturated at 1800 K
Heterogeneous nucleation of vapor on ions in the gas phase can occur at supersaturations that are lower
than those needed to drive homogeneous nucleation. The gas phase in a nuclear reactor accident will be
intensely irradiated so there will be relatively high concentrations of ions to act as sites for nucleation.
Some heterogeneous nucleation of vapors will occur. But, supersaturation ratios that will develop when
high temperature vapors escape the regions of core debris into cooler regions can exceed 10
4
. Since
nucleation is kinetic in nature, it is quite likely that both homogeneous nucleation and heterogeneous
nucleation will occur simultaneously.
The theory of nucleation of complex vapors produced in reactor accidents is vastly more complicated than
the theory for single pure vapors outlined above. Indeed, a general theory of nucleation for complex vapors
has not yet been developed. The qualitative features of nucleation from complex vapor mixtures are
expected to be similar to those of pure vapor nucleation although quantitative features may differ and
calculation of these features will involve vapor and condensed phase properties that are not readily

NEA/CSNI/R(2009)5
25
available. Consequently, when nucleation phenomena are considered in accident analyses, approximate
models based on nucleation of single vapors are used. The upper and lower bound models of Reiss, Katz
and Cohen are quite popular.
It is more common especially in the so-called “lumped node” computer models of reactor accidents to omit
mechanistic modeling of nucleation processes. Particle formation is simply assumed to occur when the
vapor reaches saturation. The omission is justified by the rapid development of supersaturation in the gas
flowing into ever cooler environments and the rapid growth of particles that are nucleated from the vapor.
This sudden growth of the nucleated particles can obscure any effects of the details of nucleation kinetics
at the “lumped node” level of approximation. Recently, mechanistic treatments of vapor nucleation have
been included in computational fluid dynamics models of flows during reactor accidents. In some cases,
these models are showing unexpected complexity in the aerosol deposition because of the spatial variations
in the supersaturation along a flow path. These findings are, of course, subjects of continued research.
2.3 Growth of Aerosol Particles
2.3.1 Growth by coagulation
Aerosol particles grow by continued condensation of vapor on the nucleated particles and by the
coagulation of these particles. Vapor condensation on nucleated particles is limited by the rate at which
heat liberated by condensation can be removed. Interior to a cloud of nucleating vapor, only conduction
can remove this heat. Velocity differences between the gas phase and the particles are too small to promote
much convective heat transport and optical paths for radiation heat transfer are effective only near the
perimeter of the cloud. Though some continued vapor condensation will occur, coagulation is the dominant
mechanism of particle growth following nucleation. Coagulation greatly affects the size and consequently
the mobility of aerosol particles, so the aerosol particles quickly develop a size distribution. The evolution
of this size distribution is described by the intergrodifferential equation:
du)uv(n)uv,u(K
v
0
2
1
t
)v(n
−−
∫
=
∂
∂
du)u(n)v,u(K
0
)v(n
∫
∞
−
)v(S)v(n)v(R +−
where:
n (v) = number density of particles of volume v to v + dv (particles/cm
3
)
K (u,v) = collision kernal for particles of volume v and volume u (s
-1
)
R (v) = rate constant for deposition of particles of volume v on surfaces (s
-1
)
S (v) = source rate of particles (particles/cm
3
-s)
The first integral on the right-hand side of this equation is the coagulation of particles of volume u and v- u
to form a particle of volume, v. The second integral is the coagulation of particles of volume v with
particles of any volume to form a particle that is no longer in the v to v + dv volume interval.
Particles coagulate because they cross stream lines of flow to come into contact. There are a variety of
mechanisms that can cause particles to cross stream lines. Each of these mechanisms is characterised by a
distinct collision kernel, K(u,v). The more common collision kernels recognised in models of aerosol
growth during reactor accidents are:

NEA/CSNI/R(2009)5
26
• Gravitational - larger particles sweep out smaller particles as they fall under the force of gravity
()
()
() ()
|uuCvvC|uvv,u
g
4
3
9
2
v)(u, K
3/23/2
2
3/13/1
0
g
p
2
3/4
g
−+∈
µ
Ρ
χ
γ
π
π
=
where:
γ
= collision shape factor
χ = dynamic shape factor
g = gravitational acceleration
p
ρ = material density of the particle
g
µ = gas viscosity
()
2
3/13/1
3/2
0
vu
v
+
β
=∈
β = 0.5 or 1.5
C(v) = Cunningham slip correction factor for a particle of volume v
• Brownian diffusion - fluctuations in molecular bombardment drive particles across streamlines of
flow to contact other particles.
()
()
(
)
(
)
++
µ
=
3/13/1
3/13/1
g
B
u
uC
v
vC
uv
3
kT2
v,uK
where:
k = Boltzmann constant = 1.38066 x 10
-16
ergs/K
T = absolute temperature (K)
• Turbulent dif fusion - turbulent eddies carry particles across streamlines to contact other particles
()
()
2/1
g
gT
3
3/13/1
TD
uv
4
Z3
v,uK
µ
ρ∈
+
π
=
where:
T
∈ = turbulent energy dissipation rate
1.29 ≤ Z ≤ 5.65
• Turbulent inertia - particles expelled from turbulent eddies impact other particles
()
()( )
4/1
g
g
3
T
g
p
3/23/2
2
3/13/1
TI
|vu|uvZv,uK
µ
ρ∈
µ
ρ
−+
′
=
where:
0.188 ≤ Z
′
≤ 0.204

NEA/CSNI/R(2009)5
27
The Cunningham slip correction factor, C(v), that arises in these various expressions for the collision
kernels to account for deviations from continuum mechanics is empirically derived from data for spherical
particles. Many different expressions have been given for this correction factor. A commonly used one is:
()
(
)
(
)
Kn/999.0exp588.0142.1Kn1vC −++=
3/1
v6
2
Kn
π
λ
=
The collision kernels and the slip correction factor are shown in Fig. 2.3-1 and Fig. 2.3-2 as functions of
particle size for a particular set of circumstance (pressure, temperature, etc.).
In many circumstances, one of the mechanisms of coagulation is dominant. There are other circumstances
in reactor accident analyses in which several coagulation mechanisms act with similar magnitudes. This
gives rise to the issue of addition of kernels. Often kernels are simply added. In other cases more
complicated summations are used such as:
() () () () ()
v,uKv,uKv,uKv,uKv,uK
2
TI
2
TDgBtotal
+++=
Research in aerosol physics includes efforts to develop more defensible descriptions of the combined
effects of simultaneous coagulation mechanisms.
u
1/3
(µm)
0.001 0.01 0.1 1 10 100
Collision Kernel
1e-13
1e-12
1e-11
1e-10
1e-9
1e-8
1e-7
1e-6
1e-5
gravitational
Brownian diffusion
turbulent diffusion
turbulent inertia
Fig. 2.3-1 Example collision kernels for various mechanisms of coagulation

NEA/CSNI/R(2009)5
28
Slip Correction Factor
Knudsen Number, Kn
0.001 0.01 0.1 1 10 100
Cunningham Slip Correction Factor, C
0
10
20
30
40
50
Fig. 2.3-2 Cunningham slip correction factor as a function of Knudsen number
Other coagulation mechanisms can be identified, such as laminar shear. These are not often included in
coagulation models for nuclear aerosols. One of the additional coagulation mechanisms of current research
interest is coagulation effects of electrostatic charging of aerosol particles. In most aerosol analyses, it is
assumed that the average charge on aerosol particles is zero and the distribution of charges on particles is a
Boltzmann distribution with zero mean. Certainly, this is what is expected in most laboratory tests
including those used to validate aerosol behaviour models. But, in the highly radioactive environment of a
reactor accident, there can be net charging of aerosol particles. The charging takes place because of the
intense radiation field that produces ions in the atmosphere. The irradiation of the atmosphere produces
equal amounts of positively and negatively charged ions. But, positive and negative ions have different
mobilities. In air, negative ions are more mobile than positive ions. Consequently, aerosol particles in air
are bombarded with higher fluxes of negative ions and can develop a net negative charge. The actual value
of the charge depends on the particle size. The charge is also dynamic. The net charge on any given
particle fluctuates with time. Strong, long-range electrostatic forces between particles with net charge
could have a dramatic effect on coagulation. These effects under accident conditions are elements of
current research.
2.3.2 Growth by condensation
The two principal mechanisms of aerosol growth, as opposed to aerosol formation, are condensation upon
an initially existing particle, and agglomeration/coagulation. The former process usually takes place on a
faster timescale than the latter except for the situation following homogenous nucleation, when particle
sizes are small but number densities are very high.
The aerosol growth mechanism of condensation on existing particles is sometimes referred to as gas phase
conversion. It includes both heterogeneous nucleations, where the initial seed particles are comparable in
size to but energetically favoured over the embryos of homogeneous nucleation, as well as condensation
upon larger particles, such as takes place in cooler parts of the reactor circuit and in the containment.
Chemical reaction between the gas phase and the particle surface is also possible but is not considered

NEA/CSNI/R(2009)5
29
here. A formula frequently used in safety codes to calculate the condensation rate on existing particles is
that due to Fuchs and Sutugin [7], which covers both the high and low-Knudsen number ranges:
2
0
1
2( )
11.71 1.333
n
pd
nn
K
FDdnn
KK
π
+
=−
++
(5)
where F is the number of molecules condensing on the surface of the particle of diameter dp in unit
time, D is the diffusion coefficient, n
0
and n
d
are the molecular concentrations of the condensing species in
the bulk gas and at the particle surface respectively, and Kn is the Knudsen number. When the particle is
small the effect of the curvature upon the effective saturation pressure at the droplet surface must be taken
into account. A rearrangement of equation (2), applied to particles of size other than the critical droplet
size, yields for the difference between the vapor pressure over a curved surface and that over a plane
surface (the Kelvin effect)
4
p
ex
liq
drop sat
Bp
v
kTd
pp
σ
=
(6)
where v
liq
is the liquid specific volume and σ the surface tension. This formula can be used to
calculate the bulk saturation ratio necessary to induce condensation on droplets of a given size. Smaller
droplets are seen to require higher saturation ratios in order to grow by condensation.
For the case of heterogeneous nucleation, where the initial particle radius r
p
is of the same order as the
critical droplet radius r
crit
it can be shown from the above equations that the rate of condensation is
proportional both to (S-1), where S is the saturation ratio, and to r
p
– r
crit
. Hence condensation takes place
preferentially to the larger seed particles.
Depending on the deposition process it is possible for a given class of particles to derive expressions for
the rate of particle growth. Friedlander [8], for instance, tabulates growth laws for particles of a given
diameter depending on the condensation mechanism (diffusion, surface reaction etc.). Such growth laws
may then be applied to calculate e.g. the lifetime of a droplet drying out in an unsaturated atmosphere of
saturation ratio S <1. The Langmuir equation for the lifetime t of a droplet shrinking from an initial
diameter d
i
to a final diameter d
f
is
22
8(1)
()if
sat
t
D
Mp S
R
Td d
ρ
=
−
−
(7)
where M is the molecular weight of the condensing species. Such lifetimes are usually short compared
with the timescales typical of containment analysis.
While particle translation is strongly damped by viscous forces for small particles, and thus has little effect
on condensation, heat transfer is an important consideration in particle growth by mass transfer.
Condensation on particles adds thermal energy, raising the particle temperature and hence the saturation
pressure. The increasing saturation pressure then acts to limit the condensation rate. Mason [9] proposed a
correction factor f
M
to equation (5) to account for heat transfer limitation of the condensation rate. It is
widely used in safety codes and is calculated from
1
1(1)
sat
M
pLM
fLD
kT RT
−
=+ −
(8)
where k is the gas phase thermal conductivity and L is the latent heat of condensation.

NEA/CSNI/R(2009)5
30
The specific case of hygroscopic particles in a humid containment atmosphere is considered in more detail
in a separate subchapter of this report.
2.4 Aerosol Growth as a Result of Hygroscopicity
Aerosol particles can also grow as a result of water adsorption. All aerosol materials exhibit some amount
of hygroscopicity. That is, they can absorb water vapor from the ambient atmosphere. For many aerosol
materials, this hygroscopicity amounts to the absorption of little more than a monomolecular layer of water
on the surfaces of primary particles that have coagulated to form a larger aerosol particle. Some materials,
those with high water solubility such as CsI and CsOH, are much more hygroscopic. They are, in fact,
'deliquescent' and will absorb and dissolve in water until the equilibrium vapor pressure of the solution is
equal to the partial pressure of water vapor in the ambient atmosphere. This water absorption causes the
particles to grow and the growth can be quite dramatic in the case of pure CsOH or CsI particles. An
example calculation of the growth of a CsOH particle initially 2.0 µm in diameter to its equilibrium size,
D
p
(eq) = 8.83 µm, is shown in Fig. 2.4-1. What is noteworthy in this figure is the time for growth of the
particle. Particle growth to the equilibrium size can occur in seconds. Because of the so-called
hygroscopic growth, such particles will settle more rapidly in a humid environment than would be
otherwise expected based on their initial sizes and growth by coagulation.
The difficulty encountered in taking hygroscopic growth of particles into account in reactor accident
analyses is that seldom are there any aerosol particles that are purely deliquescent in nature. CsOH, CsI,
and other very hygroscopic materials will be co-agglomerated with other far less hygroscopic materials.
They may, in fact, make up only a small fraction of the mass of any aerosol particle and be buried deep
within a matrix of primary particles that have little ability to absorb water. Water absorbed in these
composite particles may affect shape factors by filling voids in the composite particle, but may not amount
to sufficient growth of the particle to greatly affect deposition and settling characteristics.
Time (seconds)
0.0001 0.001 0.01 0.1 1 10
D
p
(t) / D
p
(eq)
0.0
0.2
0.4
0.6
0.8
1.0
Fig. 2.4-1 Hygroscopic growth of a CsOH particle initially 2 µm in diameter in an atmosphere with
relative humidity of 99 % at 363 K

NEA/CSNI/R(2009)5
31
2.5 Fractal Nature of Aerosols
Aerosol particles are quite small and a substantial fraction of the atoms or molecules that make up an
aerosol particle are on the particle surface. As a consequence, aerosol particles are quite reactive
chemically. When two particles encounter one another, Van der Waals forces and even chemical reactions
between particles make it quite likely that the particles will adhere. There typically are not opportunities
for multiple encounters among two particles so when the particles adhere, they do not necessarily adopt a
minimum energy configuration. In fact, agglomeration of aerosol particles leads to composites that have
fractal geometries. That is, the particle sizes are not proportional to the cube root of the volume of material
making up the composite. Under conditions of predominantly coagulation by Brownian diffusion, particle
dimensions are often found to be proportional to about the square root of the volume of the composite. As
the composites age and sinter, the proportionality evolves toward the usual cube root proportionality.
An important element of current aerosol research is the prediction of fractal characteristics of aerosol
particles. Interest in the fractal geometry arises because it can affect particle behaviour. The equations of
aerosol coagulation (and as discussed later aerosol deposition) have been derived for perfectly dense
spherical particles. Since the real particles do not have this geometry and are not perfectly dense,
correction factors have to be introduced into the equations. Two correction factors, called shape factors, are
commonly introduced:
χ = dynamic shape factor
γ
= collision shape factor
The dynamic shape factor accounts for the higher drag of a nonspherical, porous particle. The collision
shape factor accounts for the greater spatial extent of a nonspherical particle. When the envelope of a
particle is spherical, but the particle is not perfectly dense, the dynamic shape factor and the collision shape
factor are equal but not necessarily equal to one. Aerosols in humid environments such as those expected
in reactor containment do tend to have spherical envelopes. In the reactor coolant system, such
spheroidization of the particles cannot be anticipated and the dynamic and collision shape factors can be
quite different.
It is difficult now to predict shape factors for particles. Often test data are used to 'back calculate' shape
factors. This is usually done assuming that the shape factors will be independent of particle size which is
known not to be the case. There is no assurance that the shape factors derived in this way will be applicable
to the analysis of reactor accidents.
2.6 Aerosol Deposition
The natural attenuation of radioactive material available for release from nuclear power plants during
accidents occurs because aerosol particles will deposit on surfaces in the reactor. Aerosols deposit on
surfaces because they cross stream lines of flow over the surfaces or because they extend far enough to
intercept the surface even when the particle center of mass is following a streamline. Van der Waals forces,
surface tension forces and even chemical reactions between particles and the surfaces can bind particles to
the surfaces when the velocity of impact is sufficiently low, as it usually is.
The rates of aerosol deposition on surfaces are often characterised in terms of 'deposition velocities' which
are coefficients that relate the particle flux to the particle concentration in the gas phase:
)v(n)v(V
dt
)v(dN
A
1
d
=

NEA/CSNI/R(2009)5
32
where:
dt
)v(dN
A
1
= flux of particles of volume v to a surface
)v(V
d
= deposition velocity of particles of volume v
)v(n = number concentration of particles of volume v in bulk gas phase
Processes that can lead to particle deposition include:
• gravitational settling
• diffusion to surfaces
• turbulent deposition
• inertial deposition
• phoretic processes
2.6.1 Gravitational settling and diffusion
Gravitational settling and diffusion nearly always affect aerosols. Gravitational settling affects the larger
particles most:
χµ
π
ρ
=
g
3/2
p
g
18
v6
)v(Cg
)v(V
)v(V
g
= gravitational deposition velocity (cm/s)
g
µ = gas viscosity (g/cm•s)
g = gravitational acceleration (cm/s
2
)
p
ρ = particle material density (g/cm
3
)
Of course, gravitational deposition only occurs on the upward projections of surfaces.
Diffusion affects the smaller particles the diffusion coefficient for aerosol particles is:
D
χ
π
πµ
=
3/1
g
v6
3
Tk)v(C
)v(
The diffusive deposition velocity depends, of course, on geometry and flow conditions. Van der Vate
suggests for stagnant enclosures:
(
)
s/cmD22.0V
735.0
dif
=

NEA/CSNI/R(2009)5
33
where D is in units of cm
2
/s. Gravitational deposition velocities and diffusive deposition velocities are
shown in Fig. 2.6-1 as functions of the equivalent spherical particle diameter. Clearly, when these two
deposition processes are summed, there will be a particle size range of minimum deposition velocity. This
is quite characteristic of aerosol deposition when two or more deposition processes are operative. The
particle size corresponding to the minimum total deposition velocity is often called the “maximum
penetration particle size”. The consequence of having such a minimum in the deposition velocity is that
particle deposition can not only reduce the total aerosol concentration, it can also affect the size
distribution of particles that remain in the gas phase. Deposition preferentially removes larger and smaller
particles, so the size distribution is narrowed around the maximum penetration particle size.
Particle Diameter (µm)
0.001 0.01 0.1 1 10 100
Deposition Velocity (cm/s)
1e-7
1e-6
1e-5
1e-4
1e-3
1e-2
1e-1
1e+0
1e+1
gravitational
diffusion
total
Fig. 2.6-1 Comparison of deposition velocities for particular circumstances
Convection and especially turbulent convection can greatly enhance particle deposition. Turbulent
deposition velocities used in reactor accident analysis models are nearly all based on empirical correlations
of data. The most notable use of empirical correlations for turbulent deposition is deposition of aerosol in
straight pipe flow.
2.6.2 Inertial deposition of aerosol particles
Aerosol-laden flows especially in the reactor coolant systems follow tortuous pathways. Whereas the gas
phase responds promptly to the accelerations caused by obstacles like bends, contractions and expansions
in the flow path, the responses of aerosol particles are delayed by inertia. Time is required for the velocity
of the particle in the direction of an obstacle to be arrested and the particle accelerated in the new direction
of gas flow. When particles are too massive to do this, they impact and presumably adhere to the obstacle
surface. This is often called 'inertial particle deposition'.
Flow patterns in the vicinity of an obstacle can be quite complicated especially under turbulent flow
conditions. It has been common, then, to use correlations of experimental data to account for inertial
particle deposition in bends, contractions and expansions of flow paths. The independent variable in the

NEA/CSNI/R(2009)5
34
correlations is usually the Stokes number which is the ratio of the distance required to arrest the motion of
a particle in the direction of the obstacle to some characteristic dimension of the flow path:
χµ
ρ
=
L9
vD)v(C
Stk
g
g
2
pp
where:
Stk = Stokes number (-)
)v(C = Cunningham slip correction factor (-)
p
ρ = particle material density (g/cm
3
)
p
D = particle diameter (cm)
g
v = gas velocity (cm/s)
g
µ = gas viscosity (g/cm•s)
L = characteristic dimension of flow configuration (cm)
The dependent variable in the correlations can be either the fraction of particles of a specified size that
deposit in the flow field, η(D
p
), or the fraction that successfully negotiate the path through the change in
the flow field. Some notable correlations are:
• Correlation of deposition efficiency in turbulent flow through a bend:
(
)
[
]
Stk963.0D1log
p10
−=η−
where the Stokes number is defined in terms of the hydraulic diameter of the pipe.
• Deposition efficiency in a contraction of the flow path from a diameter Di to a diameter Do:
(
)
2
2
i
o
p
x227.2x557.8721.1
D
D
1
D
1
+−=
−
η
−
31.0
i
o
D
D
Stkx
=
• Deposition efficiency from a vena contracta:
()
++−
−=η
−1
2
i
0
2
i
o
p
Stk
D
D
617.0Stk11
D
D
1D
for 0.18 < Stk < 2.03
2
i
o
D
D
17.0
<

NEA/CSNI/R(2009)5
35
There has been a major dependence in reactor accident analyses on experimental determinations of
deposition velocities. Mass transfer to heat transfer analogies are very difficult to justify for aerosols
because of the very high Schmidt numbers for aerosols of interest. Recently, a major thrust of aerosol
research has been to analyse turbulent aerosol deposition in great detail using computation fluid dynamics
techniques. Often these studies are done for turbulent deposition along with other deposition mechanisms.
The studies do, no doubt, contribute greatly to the understanding of aerosol behaviour. Unfortunately, the
computational labour associated with these detailed models is incompatible with most accident analysis
codes. Indeed, even replicating published calculations would entail more labour than is usually available to
support improved aerosol modelling in reactor accident analysis codes. It would be most useful if
investigators exploring the details of aerosol deposition would correlate their findings into simplified
expressions that were similar to the correlations now used in the accident analysis models. Then, results of
these detailed analyses could be incorporated into accident analysis models promptly.
2.6.3 Phoretic deposition processes
A final, important category of aerosol deposition process is made up of the phoretic processes - usually
thermophoresis, which is particle movement in a thermal gradient, and diffusiophoresis, which is particle
movement in the flux of a condensing vapor such as steam. Both of these phoretic effects arise because the
gas impinging on one side of the particle imparts more momentum than that impinging on the other side.
Thermophoresis arises because of temperature differences between the gas phase and the surfaces exposed
to aerosol-laden gases. Such temperature differences can be quite large in the coolant system of a reactor
during a severe accident. Very hot aerosols and gases emerge from the core region of the reactor and
encounter large areas of cool surface. The thermophoretic deposition of aerosols on these surfaces was
vigorously researched thirty years ago. From this research emerged what has come to be called the Talbot
interpolation formula for the thermophoretic deposition velocity:
(
)
()
nT1
KnC2
k
k2
1KnC31
KnC
k
kvC2
V
t
p
g
m
t
p
g
g
sg
therm
∇
+++
+
χρ
µ
−=
where:
s
C = 1.128
()
m
m
m
2
C
α
α−
=
()
t
t
t
1
8
15
C
α
α−
=
m
α = momentum accommodation coefficient
t
α = thermal accommodation coefficient
g
k = thermal conductivity of the gas phase
p
k = thermal conductivity of the aerosol particles
The thermophoretic deposition velocity is not an especially strong function of particle size. It does depend
on the thermal conductivity of the aerosol particles relative to the thermal conductivity of the gas phase.

NEA/CSNI/R(2009)5
36
Seldom is this particle thermal conductivity well known relative to the ability to estimate the thermal
conductivity of the gas phase. Usually bulk material thermal conductivities are used though it is
recognised that this may be quite in error. The thermophoretic deposition velocity also depends on
accommodation coefficient for gas impinging on particle surfaces. There does not appear to be much of a
useful data base on such accommodation coefficients and there are not readily accessible theories for
estimating accommodation coefficients. Fortunately, the velocity is not especially sensitive to
accommodation coefficients in the plausible range of possible values.
Recently, there has been a renewed interest in thermophoresis. Researchers have obtained detailed
solutions of approximate forms of the Boltzmann equation to assess thermophoretic deposition of particles.
Their numerical analyses do identify ranges where particles will move up rather than down the thermal
gradient. This is called 'negative thermophoresis'. Their numerical results show excellent agreement with
data taken in regimes predicted to be challenging to the theory. It is unlikely, however, that such detailed
analyses will ever find their ways into accident analysis computer codes. The Talbot interpolation formula
also shows good agreement with the available experimental data though the formula will not predict the
negative thermophoresis found possible in the more detailed analyses of thermophoresis.
Diffusionphoresis is not usually encountered in the reactor coolant system during a reactor accident since
large amounts of vapor are not condensing on surfaces in the reactor coolant system. Diffusiophoresis can
arise in the containment of a reactor under accident conditions. It is an especially important aerosol
removal process in the AP600 reactor where the steel containment is cooled by water on the outside. The
usual form of the diffusiophoretic deposition velocity is:
()
(
)
OH
O2H
Total
2
Total
OH
12phor
2
2
P
PP
OHD
P
P
1
vC
1V ∇
−
−σ
χ
+−=
where:
phor
V = diffusiophoretic deposition velocity
12
σ = scattering kernel
OH
2
P = partial pressure of the condensing vapor which is usually steam
()
OHD
2
= diffusion coefficient of the condensing vapor
A variety of expressions for the scattering kernel have been proposed. Williams has formulated a very
general expression for the kernel to account for diffuse, specular, Lambert and backward reflection of
molecules impinging on the particle surface. Others have considered both momentum and energy
accommodation in the formulation of the scattering kernel. Unfortunately, the nature of the scattering of
gases from aerosols in reactor accidents is not well known and such sophisticated models are seldom found
in reactor accident analysis codes.
2.7 Resuspension of Deposited Particles
Aerosol particles deposited on surfaces can be resuspended in the gas phase. Resuspension can occur when
there is:
• a sudden increase of gas flow over the surface
• shock or vibration of the deposition surface
NEA/CSNI/R(2009)5
37
Experimental data on resuspension shows that increased gas flow and shock or vibration of the deposition
surface can act synergistically to cause accentuated resuspension.
Events are expected in reactor accidents that lead to resuspension of deposited particulate. These events
include:
• sudden generation of steam when core debris relocates from the core region to the lower plenum
of the reactor vessel,
• steam generation associated with attempts to quench the core,
• rupture of the reactor pressure vessel,
• violent fuel-coolant interactions such as steam explosions, and
• hydrogen combustion events.
Experimental investigations of resuspension phenomena have focused on the effects of sudden increases in
gas flow. These studies have shown that gas flow increases produce a significant initial resuspension
followed by a longer term, much lower rate of particle resuspension. The studies also show that the aging
of aerosol particles on surfaces makes resuspension more difficult.
The first models of resuspension were based on a balance between the forces holding particles to a surface
(Van der Waals forces, surface tension, chemical bonding, etc.) and lift forces from the flowing gas. Such
models could predict the initial, intense resuspension, but these early models could not predict the longer
term, low intensity resuspension. More recent models have approached modeling resuspension in two
ways:
• turbulent eddies are predicted to penetrate the laminar boundary layer to the surface and scour
deposited particles from a surface region approximately the size of the penetrating eddy,
• particles vibrate in a potential well created by the adhesive forces. Episodic fluctuations in the
vibrations put particles in a state where lift forces can overcome the weakened adhesive forces.
Even more recently, resuspension research has focused on the potential for depositing particles to impart
sufficient momentum to already deposited particles to cause resuspension.
2.8 Aerosol Removal by Engineered Safety Systems
The natural aerosol deposition processes discussed above will eventually cleanse the gas phase of
particulate. These processes often operate over a longer time scale than the progression of reactor
accidents. Fortunately, engineered safety systems, installed in reactor containments to reduce pressure
during design-basis loss of coolant accidents, are very effective also at removing aerosol from the
containment atmosphere. Important engineered safety features are:
• containment sprays
• steam suppression pools
• fan coolers
Sprays
Sprays flood the containment atmosphere with water droplets. The size distribution of water droplets from
a type of spray nozzle commonly found in pressurised water reactor is shown in Fig. 2.8-1. The spray rates

NEA/CSNI/R(2009)5
38
can be quite high so the number of density of water droplets is high. After an initial transient when spray
droplets condense excess steam in the containment atmosphere, spray droplets remove aerosol particles
from the atmosphere by a combination of three processes - diffusion, interception and impaction. The
capture of particles by falling spray droplets is usually expressed in terms of capture efficiency. This
efficiency is the ratio of particles actually captured to the number of particles in the droplet path:
()
(
)
()
LdnD
dN4
dD
p
2
d
p
pd
π
∆
=∈
′
where:
(
)
pd
dD
′
∈ = capture efficiency for droplet of diameter D
d
and particles of diameter d
p
(
)
p
dN∆ = number of particles of diameter d
p
captured
L = droplet path length
Impaction describes the impact on droplets by particles that cannot follow the streamlines around the
droplet. Of course, it is the larger aerosol particles that cannot follow these streamlines. A commonly used
expression for the capture of these large particles is:
where:
Re
D
=
g
dgT
DU
µ
ρ
U
T
= droplet terminal velocity
Stk = Stokes number
(
)
χµ
ρ
dg
T
2
p
D9
UdvC
δ = 0.25 to 0.75
Number-weighted Droplet Size Distribution
0 200 400 600 800 1000 1200 1400 1600
Probability Density
0
Droplet Diameter (µm)
Fig. 2.8-1
Number-weighted droplet size distribution for a common containment spray

NEA/CSNI/R(2009)5
39
Interception occurs when the center of mass of a particle is following a streamline closer to the droplet
surface than the particle radius. A common expression for the efficiency of interception is:
()
() ()
60/Re1
60/potint,Reviscint,
int
D
D
+
∈
+∈
=∈
()
()
()
3/1
dp
2
dp
D/d1
D/d5.1
viscint,
γ+
γ
=∈
()
d
p
D
d3
potint,
γ
=∈
A variety of expressions are available for estimating the collection efficiency due to diffusion. An example
is:
()
(
)
8/32/1
D
D
ScRe557.02
ScRe
4
diffusion +=∈
where:
Sc = particle Schmidt number =
pg
g
Dρ
µ
D
p
= particle diffusion coefficient =
(
)
χπµ
pg
d3
kTvC
The aerosol capture mechanisms are not entirely independent. A common expression for the combined
effects of the three mechanisms is:
() ( )
[]
(
)
[
]
()
[
]
diffusion1erceptionint1impaction11total ∈−∈−∈−−=∈
Total aerosol capture efficiencies for 1000 µm and 200 µm droplets as functions of aerosol particle size are
shown in Fig. 2.8-2. The capture efficiency passes through a minimum for both droplet sizes. This, of
course, means that spray droplets both remove particles and narrow the size distribution. The minimum
varies in location with the size of the spray droplet. Accurate calculation of the effects of spray removal
requires that the size distribution of the spray droplets be considered. This is not often done because it
requires that the coagulation of the spray droplets during flight be calculated as well. Alternative
mechanistic modelling has been developed based on recent analytical work; this modelling is described in
Appendix 3.

NEA/CSNI/R(2009)5
40
Spray Droplet Removal of Aerosol Particles
Particle Diameter (mm)
0.001 0.01 0.1 1 10 100
Total Capture Efficiency
0.0001
0.001
0.01
0.1
1
10
1000 µm droplet
200 µm droplet
Fig. 2.8-2 Comparison of the capture efficiencies of 1000 and 200 µm droplets
2.8.1 Steam suppression pools
Calculation of the aerosol removal by steam suppression pools is quite involved. Much aerosol removal
occurs during the formation of the bubble when diffusiophoresis occurs as steam condenses and impaction
occurs at the stagnation of the flow against the growing bubble envelop. Once the bubble detaches and
begins to rise in the pool, further aerosol removal can occur by diffusion and gravitational settling within
the bubble. Diffusion within the bubble is resisted by expansion of the bubble as pressure head is lost
during bubble rise. Vapor flow into the bubble when the water pool is near the boiling point can resist
particle removal. Gases within the bubble circulate during bubble rise, so there can be aerosol removal by
inertial deposition as aerosols are unable to follow streamlines of flow in the ellipsoidal bubble. Other
removal mechanisms can arise. For instance, oscillation of the bubble can remove particles because of
delay in the response of particles to changes in bubble shape.
Aerosol removal from gas bubbles sparging through water depends on the depth of the water, but can
produce substantial decontamination. The decontamination is usually expressed in terms of the
decontamination factor, DF:
poolemerginggasinionconcentrataerosol
initiallyionconcentratmassaerosol
DF =
Decontamination factors calculated for gases sparging through the so-called 'T' quenchers in the steam
suppression pools of boiling water reactors are shown in Fig. 2.8-3. Even a pool as shallow as about one
meter will remove over 90 % of the particulate in the gas stream. It is to be emphasised that the removal
also narrows the size distribution of the remaining aerosol around the maximum penetration aerosol
particle size. This narrowing of the particle size distribution around a small particle size that is inefficiently
removed by the combination of diffusion, gravitational settling and impaction mechanisms makes
subsequent filtration processes for the residual aerosol much less efficient than would be expected based on
the size distribution of the aerosol entering the suppression pool.

NEA/CSNI/R(2009)5
41
Pool Depth (cm)
0 100 200 300 400 500 600 700 800
Decontamination Factor
0
200
400
600
800
1000
Fig. 2.8-3 Aerosol removal by sparging through a water pool
2.8.2 Fan coolers
Fan coolers can remove aerosol by thermophoresis and by the impaction of particles on rotating fans.
Thermophoretic removal decreases with time as the depositing aerosol develop an insulating layer on the
cool surfaces.
2.9 Aerosol Removal by Filtered Vents
A final protection against radioactive material released from reactors under accident conditions is to filter
the gas stream. Three types of filters are commonly used:
• fibre filters used to protect particular locations such as the control room
• venturi scrubbers
• gravel bed filters
Fiber filters remove particles by trapping them. The overall penetration of a fresh fiber filter, i. e. before it
is loaded with particles, can be expressed by:
()
−
−=
ftot
f
f
E
d
L
P
,
1
4
exp
απ
α
P
f
= fraction of aerosol penetrating fiber filter
α = volume fraction of fibers in filter, i.e. 1.0 - porosity
L = thickness of fiber bed
d
f
= fiber diameter
E
tot,f
= total efficiency of a single fiber at particle trapping

NEA/CSNI/R(2009)5
42
The efficiency of a fibre at trapping particles is calculated considering the mechanisms:
• gravitational settling
• inertial impaction
• interception
• diffusion
• thermophoresis
• diffusiophoresis
Electrostatic charging of the filter and particles can also be considered especially for radioactive aerosols.
The filter collection efficiency η and the decontamination factor DF are related to the overall penetration
by
η = 1 – P
respectively
P
DF
1
=
The overall penetration, the collection efficiency and the DF depend strongly on the particle size. The
characteristics of the filter, like collection efficiency and pressure drop, change as mass is collected and
reduces the porosity of the filter.
Venturi scrubbers precondition the aerosol by injecting water (about 1 liter of water per cubic meter of gas)
along with gas through a constricting throat. Gas velocities can be as high as 120 m/s. The liquid water is
“atomised” into small droplets at the high velocities. Water droplets can coagulate with the aerosol or
otherwise capture the aerosol particles so that they are more efficiently removed by a subsequent filtration
system which might be a water pool or a gravel bed.
Gravel beds remove particles by deposition onto the large surface area provided by the gravel. Submerged
gravel beds use water to wash away deposited materials from the gravel.
Mechanistic models for the gravel bed filtration efficiency are based on the single grain capture efficiency,
extended to a bed of particular size. The penetration of a fresh granular bed filter is given by
−=
gtot
g
g
E
d
H
P
,
2
3
exp
α
P
g
= fraction of aerosol penetrating gravel bed
α = volume fraction of grains in filter, i.e. 1.0 - porosity
H = gravel bed depth
d
g
= grain diameter
E
tot,g
= total efficiency of a single grain at particle trapping
E
tot,g
for a single grain is comparable to the single fibre-capture efficiency used for fibrous filters. The
particles are captured mainly by a combination of particle diffusion, interception and impaction.
NEA/CSNI/R(2009)5
43
2.10 Computer Modelling of Aerosols
The aspect of aerosol modelling that does pose computational challenges is the solution of the dynamic
equation to describe the evolution of the aerosol size distribution as a result of particle coagulation. As
discussed near the beginning of this chapter, the evolution of the size distribution is described by a
complicated intergrodifferential equation.
In the 1970's at the time of the Reactor Safety Study, this differential equation was solved using what were
called “moment’s methods”. These methods involved hypothesizing a particle size distribution with
undetermined parameters. Typically the lognormal size distribution was hypothesized. The mean and
geometric standard deviation of the distribution were then determined through the solution of the
differential equation consistent with conservation of mass. These methods were found through an extensive
effort of experimental and analytical research to yield inadequate results during periods when aerosols
were being injected into a pre-existing aerosol with a different chemical composition. This situation gave
rise to multi-modal size distributions for the aerosol that could not be easily described by a single
distribution with limited numbers of parameters.
Today, most accident analysis models solve the aerosol dynamic equation using what are called 'sectional
methods'. Sectional methods were introduced in MAEROS and NAUA models for the first time. These
methods divide the aerosol size distribution into a set of contiguous intervals. Each interval is characterised
by a representative particle size. The differential equations are solved for these representative sizes. The
methods do suffer from numerical diffusion that can be controlled to some extent by the judicious choice
of the size bins. The sectional methods are not especially powerful in situations were vapors and steam are
condensing on the aerosol particles. Williams and Loyalka (see Bibliography) provide further critique of
these methods. For vapors and steam condensation fixed grid and moving grid methods were developed.
The MGA (Moving Grid Analysis) is successfully applied in combination with the MAEROS model
through a variety of tests. MAEROS/MGA are incorporated in codes like ASTEC, COCOSYS, CONTAIN
and MELCOR.
2.11 Annotated Bibliography
This introduction has not been intended to be comprehensive and the literature cited in this bibliography is
similarly incomplete. The works cited here are selected to provide an introduction to the field of aerosol
physics pertinent to the issues of reactor accident analyses. Annotations are provided to assist the reader in
the selection of documents of interest.
General aerosol physics
The classic reference in the field is:
− N.A. Fuchs,
The Mechanics of Aerosols, Pergmon Press, 1964
Readers may find:
− S.K. Friedlander, Smoke,
Dust and Haze: Fundamentals of Aerosol Behaviour, J. Wiley and
Sons, 1977.
more readily digested. For a work with much greater mathematical sophistication, see:
− M.M.R Williams and S.K. Loyalka,
Aerosol Science Theory and Practice with Special
Applications to the Nuclear Industry
, Pergamon Press
NEA/CSNI/R(2009)5
44
These texts will provide an introduction to the topics discussed in this chapter as well as other topics not
listed in this bibliography.
Nucleation
A good review of the experimental and analytical modeling of the nucleation of pure vapors is provided in:
− E. Honatan,
Theoretical and Experimental Research on Homogeneous Nucleation Phenomena,
A State of the Art Report
, Catedra de Tecnologia Nuclear E.T.S. de Ingeniero Industriales, Madrid,
1991.
The upper and lower bounds on the rates of pure vapor nucleation are modelled in:
− H. Reiss, J.I.Katz, and E.R. Cohen,
J. Chem. Phys., 48 (1968)5553.
Aerosol hygroscopicity
An account of aerosol growth by water adsorption is found in:
− J. Jokiniemi, 'The Growth of Hygroscopic Particles During Severe Core Melt Accidents',
Nuclear
Technology, 83
(1988) 16.
Details on the derivation of models of hygroscopic growth of pure particles by water absorption including
both mass and heat transfer are provided in:
− F.R. Newbold and N.R. Amundson, 'A model for Evaporation of a Multicomponent Droplet',
American Institute of Chemical Engineers, Journal, 19 (1973) 22.
Fractal nature of aerosols
A modern discussion of fractal dimensionality of aerosols that will provide an introduction to a growing
literature base is:
− M. Kostoglou and A.G. Konstandopoulos, 'Evolution of aggregate size and fractal dimension during
Brownian coagulation',
J. Aerosol Science, 32 (2001) 1399.
Cunningham slip correction factor
A recent derivation of the expression for the Cunningham slip correction factor from the Milliken oil drop
experimental data and a discussion of other expressions is presented in:
− M.D. Allen and O.G. Raabe,
Aerosol Science and Technology, 4 (1985) 269.
A more theoretical expression for the slip correction factor is provided by:
− W.F. Phillips,
Physics of Fluids, 18 (1975) 1069.
Electrostatic charging of an aerosol in a radiation field
Radioactivity of the aerosol material and the presence of an intense radiation field is what makes nuclear
aerosols different from aerosols encountered in other fields. The potential of electrostatic charging of
aerosols by the radiation field is discussed in:
NEA/CSNI/R(2009)5
45
− C.F. Clement and R.G. Harrison, Enhance Localised Charging of Radioactive Aerosols,
J. Aerosol
Science, 31
(2000) 363.
Diffusive deposition in enclosures
− J.F. van der Vate,
Investigations into the Dynamics of Aerosols in Enclosures Used for Air
Pollution Studies
, ECN-86, Netherlands Energy Research Foundation, Petten, The Netherlands,
July 1980.
Turbulent deposition of aerosol
The classic study of aerosol deposition in smooth pipes is:
− B.Y.H. Liu and J.K. Agarwal,
J. Aerosol Science, 5 (1974) 145.
Deposition in rough pipes is discussed in:
− L.A. Hahn, J.J. Stukel, K.H. Leong and P.K. Hopke, 'Turbulent Deposition of Submicron Particles
on Rough Walls',
J. Aerosol Science, 16 (1985) 81.
Inertial deposition of aerosols
Aerosol deposition in bends is discussed in:
− R.I. Crane and R.L. Evans,
J. Aerosol Science, 8 (1977) 161.
− D.Y. Pui, F. Romay-Novas, and B.Y. Lui, 'Experimental Study of Particle Deposition in Bends of
Circular Cross Section',
Aerosol Science and Technology, 7 (1987) 301.
− C-J. Tsai and D.Y.H. Pui, 'Numerical Study of Particle Deposition in Bends of a Circular
Cross-Section-Laminar Flow Regime',
Aerosol Science and Technology, 12 (1990) 813.
Aerosol deposition in sudden contractions and expansions of the flow path is discussed in:
− G. Ahmadi and Q. Chen, 'Dispersion and Deposition in Turbulent Pipe Flow with Sudden
Expansion',
J. Aerosol Science, 29 (1998) 1097.
− Y.Ye and D.Y. H. Pui, 'Particle Deposition in a Tube with an Abrupt Contraction',
J. Aerosol
Science, 21
(1990) 29.
Aerosol deposition in a vena contracta:
− S.P. Belyaev and L.M. Levin, 'Investigation of Aerosol Aspiration by Photographing Particle Tracks
Under Flash Illumination',
Aerosol Science, 3 (1972) 127.
Thermophoresis
The Talbot interpolation formula is described in:
− L. Talbot, R.K. Cheng, R.W. Schefer and D.R. Willis,
J. Fluid Mechanics, 101 (1980) 737.
NEA/CSNI/R(2009)5
46
Modern analyses that show instances of negative thermophoresis are:
− K. Yamamoto and Y. Ishihara, 'Thermophoresis of a spherical particle in a rarefied gas of a
transition regime', Physics of Fluids, 31 (1988) 1421.
− S. K. Loyalka, 'Thermophoretic force on a single particle - 1. Numerical solution of the linearized
Boltzmann equation',
J. Aerosol Science, 23 (1992) 291.
Comparison of models to experimental data on thermophoresis is presented in:
− F. Zheng and E.J. Davis, 'Thermophoretic force measurement of aggregates of microspheres',
J. Aerosol Science, 32 (2001) 1421.
Diffusiophoresis
The classic references on diffusiophoresis are:
− L. Waldmann and K. H. Schmitt, 'Thermophoresis and Diffusiophoresis' Chapter VI in
Aerosol
Science
, C.N. Davies, editor, Academic Press, 1966.
− P. Goldsmith and F.G. May, 'Diffusiophoresis and Thermophoresis in Water Vapor Systems',
Chapter VII in
Aerosol Science, C. N. Davies, editor, Academic Press, 1966.
The scattering kernel in the expression for the diffusiophoretic deposition velocity is discussed in:
− M.M.R. Williams,
Z. Naturforsch., 27 (1972) 1798 and 1804.
Resuspension
An overall review of resuspension modeling and experiments is provided in:
− G. Ziskind, M. Fichman and C. Gutfinger, 'Resuspension of Particulates from Surfaces to Turbulent
Flows - Review and Analysis',
J. Aerosol Science, 26 (1995) 613.
A recent review of the issues of resuspension is:
− L. Biasi, A. de los Reyes, R.W. Reeks, and G.F. de Santi, 'Use of a simple model for interpretation
of experimental data on particle resuspension in turbulent flows',
J. Aerosol Science, 32 (2001)
1175.
The issue of resuspension caused by the impaction of other aerosol particles is addressed in:
− W. John, D.N. Fritter and W. Winklmayr, 'Resuspension induced by impacting particles',
J. Aerosol
Science, 22
(1991) 723.
Spray removal of aerosol
− D.A. Powers and S.B. Burson,
A Simplified Model of Aerosol Removal by Containment Sprays,
NUREG/CR-5966, Sandia National Laboratories, Albuquerque, NM, June 1993.
NEA/CSNI/R(2009)5
47
Decontamination of aerosol by steam suppression pools
− D.A. Powers,
A Simplified Model of Decontamination by BWR Steam Suppression Pools,
NUREG/CR-6153, Sandia National Laboratories, Albuquerque, NM, May 1997.
Computer modelling of aerosol coagulation
Some of the complexities of the aerosol dynamic equation are described in:
− R.L. Drake, 'A General Mathematical Survey of the Coagulation Equation', in
Topics in Current
Aerosol Research
, Volume 3, G,M, Hidy and J.R. Brock, editors, Pergamon Press, 1972.
The sectional method for calculation of aerosol coagulation is described in:
− F. Gelbard and J.H. Seinfeld, 'Simulation of Multicomponent Aerosol Dynamics',
J. Colloid
Interface Science, 78
(1980) 485.
For a comparison of moments methods, sectional methods and other methods, see:
− C. Seigneur, A.B. Hudshwekyj, J.H. Seinfeld, K.T. Whitby, E.R. Whitby, J.R. Brock, and H.M.
Barns, 'Simulation of aerosol dynamics: a comparative review of mathematical models',
Aerosol
Science and Technology, 5
(1986) 205.
An attempt to overcome the problems of numerical diffusion is discussed in:
− T.H. Tsang and A. Rao, 'Comparison of different numerical schemes for condensational growth of
aerosols',
Aerosol Science and Technology, 9 (1988) 271
NEA/CSNI/R(2009)5
48
NEA/CSNI/R(2009)5
49
3. ACCIDENT PHENOMENOLOGY
3.1 Formation and Growth
3.1.1 Phenomena considered and state of knowledge
Successive stages in core degradation during a severe accident in a PWR or BWR result in the release of
both vapors and aerosol particles which differ in composition depending on their dominant source, be it
control rod and fuel burst events, cladding oxidation, fuel heat-up accompanied by geometric changes,
molten pool formation, or reflooding of the degraded core. Temperatures in the core region are generally
considerably higher than those in the plenum above the core, which in turn are higher than those in the
primary circuit. Concentrations are also highest in the core region, and hence the vapor/aerosol mixture
carried by the steam/hydrogen stream from the core to the assumed breach in the primary system and out
into the containment vessel or the environment undergoes a succession of cooling transients which induce
both condensation of vapors upon existing aerosols (heterogeneous nucleation) and the formation of new
particles (homogeneous nucleation). Competing with the former process is condensation upon structures,
which serves to remove material from the carrier stream, at least temporarily. The two processes mentioned
do not alter the elemental content of the carrier stream, but instead affect removal by vapor condensation
further downstream and also the mass, size distribution and chemical composition of the suspended aerosol
and thus its deposition behaviour. The size distribution of the aerosol is also strongly affected by
agglomeration, and in a simulation of fission product transport during a severe accident it is necessary to
take into account all the formation and growth processes mentioned.
3.1.1.1 The state-of-the-art report, 1994
At the time of writing of the State of the Art report on Primary System Fission Product Release and
Transport [1] physically-based models of all these processes were already available. The SOAR included a
survey of the models available in the literature for homogeneous and heterogeneous nucleation, for vapor
condensation on aerosols, and for aerosol agglomeration, and noted that these and other models had been
incorporated in circuit codes such as VICTORIA, which were being applied both to separate-effect test
series e.g. FALCON and to reactor sequences. In the absence of substantial experimental data on the
formation and growth of nuclear aerosols during transport under severe accident conditions the SOAR
could only detail the competing or reinforcing processes at work in such formation and growth without
being able to come to firm conclusions on their relative importance and combined effect under given
thermal-hydraulic conditions.
Concerning growth through
Vapor interaction with aerosols the SOAR concluded that while safety
importance (in the circuit) was high, understanding was incomplete. There is a clear need for
vapour-aerosol interaction data. Vapor-surface interaction tests may need to be done with more complex
FP species. Data on appropriate species will hopefully come from PHÉBUS FP tests. There is nothing
more about this topic in Chapter 5 of the SOAR, but in the appropriate section of Chapter 4, Section 4.6,
we read “Interactions of fission product vapors with primary circuit surfaces and aerosols can
substantially modify the magnitude and nature of the source term to the containment. However, the relative
importance of the processes is uncertain: while the extensive surface area of the aerosol surfaces indicates
that vapor-aerosol interactions should predominate, heat and mass transfer limitations can considerably
affect the balance. … few studies have addressed vapor interactions with suspended aerosols.
NEA/CSNI/R(2009)5
50
Consideration of timescales indicates that the latter processes will be governed by diffusion limitations
rather than chemical kinetics. Lack of data on the diffusion of fission product vapors through reactor gases
prevents accurate prediction of condensation phenomena. (Representative) data (e.g.from PHÉBUS FP)
should guide the requirement for separate-effects studies and the development of more sophisticated
models to treat these processes (vapor condensation on suspended aerosols and on deposits).”
Aerosol nucleation and growth, on the other hand was judged by the writers of the SOAR to be of
medium safety importance. Concerning the state of knowledge, existing data appeared to be adequate but
further modelling or reveiw/consolidation of data was required. The need for detailed nucleation/growth
modelling in the codes has not been clearly established. Chapter 4 provided more detail and recommended
further assessment. The importance of mechanistically modelling aerosol nucleation has not been assessed.
At issue is whether ad hoc treatments of nucleation phenomena are adequate for the purposes of reactor
safety analyses. We recommend that coordinated efforts be initiated to determine the importance of aerosol
nucleation … to RCS fission product transport analyses. These assessments would provide the basis for
determining if experiments are needed in addition to those already performed or planned.
In another section the SOAR writing group offered a more general comment on the impact of
thermal-hydraulic and core-degradation uncertainties on FP release and RCS transport: We view these
issues as sufficiently important to be considered regarding release and transport analyses and
experimental design. The following sections of this sub-chapter will attempt to review the progress made
since the appearance of [1] in the understanding and prediction for nuclear safety purposes of aerosol
formation and growth, including vapor condensation on aerosols, nucleation and agglomeration. A final
section on containment aerosols will highlight the similarities and differences between the formation and
growth of such aerosols and of those in the primary circuit, in the light of PHÉBUS FP results and those of
ISPs such as ISP-37 and ISP-44. The subchapter ends with conclusions and some proposed
recommendations.
3.1.1.2 Theory of formation and growth
This section presents some of the principal equations used to model the formation and growth aerosols for
nuclear safety purposes, together with remarks on their physical basis and applicability. A number of
references in the open literature are also included. For further details on the practical calculation of the
formation and growth processes considered in safety evaluations the theoretical manuals of the most
widely used codes may also be consulted.
Formation
Aerosol particles may be formed by a wide range of processes such as gas-phase chemical reactions,
attrition of solids, resuspension etc. Here we will consider the theoretically and practically important topic
of homogeneous nucleation, the formation of gas-borne particles by condensation of a supersaturated
vapor. Binary and ternary nucleation, in which several vapor species condense together, is important eg in
atmospheric science, but is not normally considered in nuclear safety. Vapor condensation onto existing
seed particles of another material, termed heterogeneous nucleation when the seed particles are sufficiently
small, is considered subsequently.
In homogeneous nucleation a thermally activated first-order transition takes place from the metastable
vapor phase to form local concentrations of the vapor molecules which may be considered the precursors
of fully formed liquid drops. The liquid phase has a lower chemical potential, but there is a free energy
“cost” through the formation of a phase boundary with its corresponding surface energy. Clusters of a
certain critical radius r
crit
or greater will tend to grow still larger, while those of smaller size will tend to
lose molecules and hence shrink. The classical theory of nucleation considers that the probability of

NEA/CSNI/R(2009)5
51
attaining a cluster of a given size is exponentially related to the energy necessary to form it [2]. This
energy is the difference between a volume term proportional to the logarithm of the saturation ratio S of
the free vapor, S being defined by
S = p
vap
/p
sat
(1)
where p
sat
is the saturation pressure, and a surface term proportional to the surface tension σ. The free
energy reaches a maximum when the droplet radius takes the value r
crit
, leading to the following equation
for the critical radius:
2
ln
crit
liq
B
v
kT S
r
σ
=
(2)
where v
liq
is the specific volume of the liquid. Classical nucleation theory [3] proceeds to calculate the
nucleation current J, i.e. the rate of liquid formation per unit volume, assuming a population of clusters
with a size distribution determined by the free energy of formation, the single-molecule arrival rate being
calculated from kinetic theory. Its final result is the following equation for the nucleation rate per unit
volume:
()()
−
=
232
3
2
1
2
ln3
16
exp
2
STkn
Mn
n
J
Bliq
liq
vap
CNT
πσ
π
σ
(3)
where n
vap
and n
liq
are the bulk vapor and liquid number densities respectively and M is the molecular
weight.
Some comments are in order. The numerical predictions of classical nucleation theory are usually not very
accurate (they are to within 5-10 orders of magnitude in most cases) but it successfully predicts the
isothermal variation of the nucleation rate with saturation ratio. However it overpredicts the variation of
the nucleation rate with temperature. Numerous attempts have been made to ameliorate the theory (for a
review see [4]), improving on the assumption that there is no free energy cost in forming a cluster
consisting of a single molecule or taking into account such matters as the curvature-dependence of the
surface tension or the translational invariance of the nucleation process, which contributes to the energy via
the entropy of mixing. Disappointingly, efforts to render classical nucleation theory more self-consistent in
these and other ways have not generally improved its predictions.
This may not matter greatly in nuclear safety evaluations, since for sufficient supersaturations all theories
in current use for that purpose predict the rapid formation of a very large number of very small primary
particles. The nucleation theorem [5] as extended by Ford [6] provides a formula for the number of
molecules in the critical droplet nucleus, n
crit
in terms of the nucleation rate J
nuc
:
,
ln
1
ln
nuc
crit
VT
J
n
S
∂
=−
∂
(4)
from which it may be calculated that a critical nucleus contains 30 - 50 molecules. In situations of safety
interest where homogeneous nucleation occurs the resulting tiny droplets or embryos rapidly agglomerate
to form particles in the 100 - 1000 nm range, referred to in atmospheric science as the accumulation mode,
NEA/CSNI/R(2009)5
52
and the precise sizes, number densities and rates of formation of the original embryos which give rise to
them may not be of significance.
Agglomeration and coagulation
Agglomeration usually refers to the formation by collisions of loosely-packed assemblages of primary
particles, often highly irregular in shape, such as certain fire aerosols [10]. If the aerosol so formed
includes a liquid component its constituents may rearrange to produce roughly spherical particles, and the
process is then termed coagulation. As an example, the particles found in the hotter portions of the
PHÉBUS circuit are agglomerates of primary particles, whereas those found in the containment vessel are
more rounded and compact as a result of water adsorption. Chapter 2 of this report gives the main
mechanisms of aerosol agglomeration, as well as appropriate formulae for the individual agglomeration
kernels to be used in the General Dynamic Equation. That chapter also supplies a recipe for computing the
kernel when several agglomeration processes act simultaneously.
More detailed information for the circuit is given in chapter 3.3.
3.1.2 Particle formation in the primary system
3.1.2.1 PHÉBUS FP tests
The information subsequent to the SOAR of 1994 on particle formation comes largely from the PHÉBUS
FP tests, mainly PHÉBUS FPT1, which was the subject of ISP-46, but also test FPT0 [13] and test FPT2,
which is currently under analysis. All three tests have the great advantage of working with prototypical
materials, and in the latter two tests, used fuel rods of moderate irradiation. They also feature sections of
the test circuit operating at temperatures and concentrations characteristic of the degrading core, in-vessel
volumes, hot primary circuit elements (1000 K), steam generator tubes and the PWR containment
respectively. Both high-steam and high-hydrogen conditions have been investigated, however, tests have
been performed with and without boric acid in the coolant stream, and in test FPT3 which was executed in
2004, but is not yet finally analysed, the silver-indium-cadmium control rod of previous tests was replaced
by a control rod of boron carbide clad in steel. These tests are considered the best available for the integral
investigation of the combined processes governing aerosol growth and vapor condensation. The remarks
below are based on PHÉBUS tests FPT0, FPT1 and FPT2.
3.1.2.2 Particle composition
Concerning particle formation, it is found that the particles sampled from the simulated upper plenum and
hot leg components are largely composed of silver, together with other elements in proportions which vary
depending on the stage of the degradation scenario reached at the time of sampling. During the period of
zircaloy oxidation in FPT1, for instance, the particle composition (weight percent) is approximately
Ag: 30, Sn: 20, In: 20, Cd: 10, with fission products such as Cs and Mo making up the remainder. All the
elements cited arise from the control rod apart from Sn, released from the zircaloy cladding on its
oxidation. During the subsequent phase in a typical PHÉBUS transient, where heat-up due to decay heating
in a reactor core is simulated by increasing the driver core power to compensate for lateral heat losses from
the fuel bundle, the particles, while still predominantly silver, contain significant proportions of the fission
products Cs and Mo, whereas during the late phase where a molten pool is formed which then relocates to
the bottom of the test section the particles remain silver-rich but contain proportions of uranium and the
less volatile fission products as well as the more volatile ones seen in previous phases. In mass terms,
silver accounted for the majority of the total release, Cd, Sn and In for 25 %, Cs and Mo together for
another 9 % and the remaining fission products including Te, Rb, Tc and I amounted to less than 5 %.
“Structural materials”, mainly silver, thus formed the aerosol stream on which the radiologically interesting
NEA/CSNI/R(2009)5
53
fission products were carried as inclusions or condensates, and the location and fate of the latter may
largely be deduced by modelling the transport of the structural materials and the interaction of fission
products with them. The above remarks refer largely to the results of PHÉBUS tests FPT0 and FPT1. The
release of control materials was high in these tests, but in an accident it will depend on the degradation
scenario. In PHÉBUS test FPT2 it was found that there was little silver release until the control materials
relocated to lower portions of the bundle. The early fission product releases thus took place when silver
was in short supply in the primary circuit. The consequences for particle composition in this test are still
under investigation.
Chemically the state of the structural materials remains relatively simple. Silver is present as the metal, In
and tin as oxides. The chemical form of cadmium is less easy to determine.
3.1.2.3 Particle morphology
The particles from the hot portion of the PHÉBUS circuit have an AMMD of 1.5 – 2 µ and as noted above
are principally composed of metallic silver. When examined under a microscope they are seen to consist of
agglomerates of primary particles of diameter < 200 nm. The agglomerates appear fairly solid in nature,
with no sign of the hollow spheres typical of fly ash, for instance. The size range observed is too small for
the primary particles to have been created by droplet fragmentation or other mechanical means, and too
large for the particles to be the direct result of homogeneous condensation, and it is most likely that they
are formed through a multistage process in which different formation and growth mechanisms dominate at
different stages.
3.1.2.4 Formation and growth of primary particles in the core and pressure vessel
Although some seed particles will be present in the flow channels of the core and in the pressure vessel
during fission product release, it appears most probable that the first stage in the creation of the primary
particles of silver which provide the backbone and building material for particle transport arise through
homogeneous nucleation [14, 15]. The particle mass concentration in the portion of the PHÉBUS
installation where temperatures in the right range prevail (3000 to 1500 K, [1]) is most representative in
test FPT2, and takes a value of the order of 5 g.m
-3
of silver. Although considerably higher values may be
found during surges in silver release these densities are always much less than the saturation density of
silver at the higher end of this temperature range, implying that the rate of transfer from liquid to silver
vapor is subject to kinetic, heat transfer or other limitations. The unsaturated carrier stream from the core
then cools in the upper plenum region and homogeneous nucleation of silver droplets occurs. The
formation of metal aerosols at high temperature through rapid cooling is well-known in metallurgy,
volcanology etc., and it is generally accepted that rapid cooling favours homogeneous over heterogeneous
condensation, resulting in droplets with sizes in the 10 nm range [16, 17]. As mentioned above the primary
particles seen in PHÉBUS tests are ten times larger than this, implying either that the droplets must
coalesce before freezing or that rapid condensation of silver takes place on the homogeneously nucleated
silver droplets, causing their growth to the size observed. Possibly both processes occur. Further cooling
then produced the solid silver “primary particles” seen in the PHÉBUS tests.
3.1.2.5 Effect of pressure
The formation scenario described is based on PHÉBUS measurements made at pressures of the order of
2 bars. Early studies of severe accidents frequently included scenarios, e.g. station blackout, where the
system pressure remained high throughout, of the order of 100 - 150 bars, but it is now generally assumed
that during such events partial depressurisation will be applied as an accident management measure,
reducing the operating pressure during the in-vessel release phase. Such pressure reduction is limited by
the accumulator set-points and in PWRs the reduced pressure is of the order of 40 bars. At intermediate
NEA/CSNI/R(2009)5
54
pressures of this order the coolant stream moves an order of magnitude more slowly through the vessel and
primary circuit than at low (near-atmospheric) pressure, implying lower cooling rates, while concentrations
of released fission products are higher. In this case, for which few experimental data are available,
heterogeneous nucleation may play a greater role in the vessel, while the droplets/particles produced by
homogeneous nucleation will tend to be larger. Information on these aspects of aerosol physics may
become available as a result of Japanese elevated pressure fission product release and transport
experiments using simulants.
3.1.2.6 Formation of particles > 1
µ
Independent of the pressure, the extremely numerous primary particles produced in the core and upper
plenum region agglomerate to a considerable extent within the vessel and continue to do so in the primary
circuit. All agglomeration mechanisms are expected to be active in different degrees depending on the
particle size and local conditions within the primary system. Note that agglomeration may take place
between chemically dissimilar particles, as occurs in PHÉBUS. The shape of the agglomerates, as shown
by SEM photographs, is by no means spherical, a fact which is known to affect both agglomeration and
removal processes. Non-spherical shape is usually modelled by the use of shape factors, but it appears
extremely difficult to predict a priori the correct shape factors to be used in circuit calculations, particularly
as particles of the same mass and composition may have different shapes. The shape factors in turn
influence thermophoretic and gravitational deposition rates, as well as agglomeration rates. Sensitivity
studies could usefully be performed to evaluate the impact of shape factor variation upon the transmission
of fission products through the primary circuit.
3.1.2.7 Vapor condensation on particles
Simultaneously with agglomeration of primary particles fission product and other vapors condense both on
the primary particles and on the larger particles resulting from their agglomeration. In PHÉBUS, despite
the over-large ratio of pipe surface to particle surface area about half the Te, for instance, is transported in
particle form through the hot portion of circuit, and in reactor scenarios one can expect fission product
transport as condensate on particles to dominate over vapor condensation on structures [18].
More detailed information for the circuit is given in chapter 3.3.
3.1.2.8 Considerations of chemistry
The similarity of the primary circuit to a tubular reactor has been noted many times [1]. A wide variety of
elements and isotopes arise from the degrading core where they react chemically with the carrier gas and
with each other, and the resulting maze of active reaction pathways represents a severe challenge to
understanding and to the modeller. The reactions continue along the circuit as temperatures drop and
elements are selectively removed by deposition processes. Availability of an element for further reaction
will depend not only on the chemical compound of which it currently forms a part, but also on the physical
phase in which it has become segregated - vapor, surface deposit, condensed layer on aerosol particle or
particle matrix. Particles of the same overall composition may have different chemical characteristics
depending on whether they are well-mixed or layered. Most important for the prediction of transport
behaviour appears to be the element’s volatility, a function of both temperature and chemical speciation.
Modern codes such as VICTORIA and SOPHAEROS [19] attempt a full equilibrium calculation to
determine the speciation of all elements point by point, without prior assumptions. This is a valid general
approach, but the calculated speciation is sensitive to uncertainties in the thermochemical properties of the
compounds involved, and it has been suggested that chemical kinetics may also play a role under low
temperature and pressure conditions, e.g. in the speciation of iodine [20]. The radiologically important
element iodine has a volatility which varies along the circuit in a manner which is hard to predict without
NEA/CSNI/R(2009)5
55
positive identification of the species responsible, and indeed the chemical nature of the volatile fraction
detected in PHÉBUS in the cold part of the circuit remains a matter for considerable speculation and
research. Some fixed data are now available to guide and correct the modeller, however, such as the
metallic nature of the silver, the dominance of oxides for the elements In, Sn, U, Cd and Mo, and the
probable dominance of the hydroxide for Cs. It is also known from PHÉBUS FPT2 that boric acid in the
PWR coolant has only a minor effect on circuit chemistry, aerosol growth and fission product transport.
3.1.2.9 Revaporisation in the primary circuit
Revaporisation is the subject of a separate contribution to this Report. Here it is appropriate to note that
there is evidence for the revaporisation of Cs after shutdown in PHÉBUS test FPT1 and late in the transient
of FPT2. The Cs is released either in the bundle region or in the hot portion of the circuit and on cooling
produces a fine aerosol, presumably through homogeneous nucleation, there being liittle suspended
material present at the time to act as seeds for heterogeneous nucleation. The fine aerosol behaves
differently from the rest of the aerosol population in the containment, causing Cs to display different
deposition behaviour from the other elements (see next section).
3.1.3 Containment aerosols
The removal time for containment aerosols is generally longer than the transient of aerosol release from the
degrading core, so that one may expect some averaging of aerosol composition and properties to take place
in the containment building. Such averaging is observed to be active in PHÉBUS, despite its rather short
removal time, in that the composition of the aerosol is found to be almost constant, consisting largely of
Ag metal and the oxides of Sn and In, independent of particle size. All fission products appear to be
incorporated in or deposited on this single aerosol “species”, and are removed from the containment
atmosphere at the same rate. The sole exception is found to be Cs. Possibly the Cs aerosol resulting from
revaporisation (see above) does not deposit on the much larger particles of the main aerosol but maintains
an independent existence. A further caveat regarding the “single aerosol” picture of the containment
suspended mass must be mentioned: in post-test analyses the solubility of aerosol particles sampled from
the containment was found to vary with the stage in the release transient reached at the time of sampling,
implying a different composition of the surface layer. This may in turn imply differing hygroscopic
behaviour for aerosols of differing genesis.
Particle size and morphology
The process of agglomeration continues within the containment, resulting in an AMMD in PHÉBUS which
at 3.5-4 µ is somewhat larger than the values seen in the cold part of the circuit (the geometric standard
deviation remains 2.0). The distribution is found to be log-normal, again suggesting a possible
simplification in the modelling as for the circuit. The impactor measurements refer to the wet aerosol, with
an uncertain amount of adsorbed water, some of which may have been lost in the sampling lines. However
the measured removal times are consistent with the AMMD stated. Furthermore, the size distribution is
found to remain almost constant throughout a containment transient lasting tens of hours. Compensation
appears to be taking place between the competing processes of agglomeration and preferential removal of
the larger particles by settling. This finding suggests that a drastic simplification of containment aerosol
codes might be made, but it should be recalled that the PHÉBUS containment atmosphere was rather dry,
with relative humidities normally less than 80 %. A different behaviour might be seen with higher
humidities, with differentiation of the aerosol population according to size and hygroscopicity, as occurred
in the KAEVER tests of ISP-44. The topic of aerosol behaviour in a humid containment environment is
considered further in a separate chapter of this report.
NEA/CSNI/R(2009)5
56
References
[1] A.L. Wright et al., Primary System Fission Production Release and Transport NEA/CSNI/R(94)2 (1994)
[2] J.Frenkel Kinetic theory of liquids, Dover, New York, Chapter 7, 1955
[3] Y.B. Zeldovich, On the theory of new phase formation: Cavitation J. Exp. Theor. Phys.12, 525, 1942
[4] Laaksonen, V. Talanquer, D.W. Oxtoby Nucleation: measurements, theory and atmospheric
applications Ann. Rev. Phys. Chem. 46, 489, 1995
[5] D. Kaschiev On the relation between nucleation work, nucleus size and nucleation rate J. Chem.
Phys. 76, 5098, 1982
[6] I. Ford Nucleation theorems, the statistical mechanics of molecular clusters, and a revision of
classical nucleation theory Phys. Rev. E., 56, 5615, 1997
[7] N.A. Fuchs, A.G. Sutugin High dispersed aerosolsin Topics in Current Aerosol Research, Vol II;
Hindy, G.M. and Brock, J.R. Eds. Pergamon, Oxford, 1971
[8] S.K. Friedlander, Smoke, Dust and Haze Fundamentals of Aerosol Behaviour. Wiley, New York, 1977
[9] B.J. Mason The Physics of Clouds Clarendon Press, Oxford, 1971
[10] I. Colbeck Introduction to aerosol sciencein Physical and Chemical Properties of Aerosols. Colbeck,
I. Blackie Academic and Professional (Chapman and Hall), London, 1998
[11] M.W. Williams, S.K. Loyalka Aerosol theory and practicePergamon Press, Oxford, 1991
[12] W. Koch, S.K. Friedlander The effect of particle surface coalescence on the surface area of a
coagulating aerosol J. Coll. Interface Sci., 140, 419-427, 1990
[13] B. Clement, N. Hanniet-Girault, G. Repetto, D. Jacquemain, A.V. Jones, M.P. Kissane, P. von der
Hardt LWR severe accident simulation: synthesis of the results and interpretation of the first
PHÉBUS FP experiment FPT0Nucl. Engrg. and Design 226 5-82, 2003
[14] C.T.R. Wilson, Condensation of water vapor in the presence of dust-free air and other gases Phil.
Trans. Roy. Soc.London 189: 265-307, 1897
[15] E. HontanonTheoretical and experimental research on homogeneous nucleation phenomena
CTN-67/91, Catedra de Tecnologia Nuclear E.T.S. de Ingenieros Nucleares 2000
[16] D.W. Oxtoby, Nonclassical nucleation theory for the gas-liquid transition J. Chem. Phys. 89(12):
7521-30, 1988
[17] D.W. Oxtoby, Homogeneous nucleation: theory and experiment J. Phys. Condensed Matter 4:
7627-7650, 1992
[18] R.D. Spence, A.L. Wright The importance of fission product/aerosol interactions in reactor accidents
Nucl. Technol. 77, 150, 1987
[19] H.-J. Allelein, K. Neu, J.P. Van Dorsselaere, K. Mueller, P. Krostka, M. Barnak, P. Matejovic, A.
Bujan, J. Slaby European validation of the integral code ASTEC (EVITA) Nucl. Eng, and Desn. 221
95-118, 2003
NEA/CSNI/R(2009)5
57
[20] L. Cantrel, E. Krausmann Reaction kinetics of a fission product mixture in a steam-hydrogen carrier
gas in the PHÉBUS primary circuitNuclear Technology 144(1): 1-15, 2003
3.2 Impact of Thermal Hydraulics
3.2.1 Impact of thermal hydraulics on aerosol behaviour in the primary circuit
Introduction
In nuclear safety evaluations thermal-hydraulic behaviour must be determined as a precondition for the
calculation of the transport and deposition of released materials, whether in vapor or in aerosol form, from
the degrading core through the primary circuit to the postulated breach and into the containment or into the
auxiliary building in the case of bypass sequences. In certain special situations such as pool scrubbing or
steam generator tube rupture thermal-hydraulics and material transport are intimately coupled and are
usually calculated together. More normal is the situation in which the coupling is considered to be looser
and the thermal-hydraulics are calculated as a separate issue, with feedbacks to and from the aerosol/vapor
transport calculations. Thermal-hydraulics is a general term, including the evaluation of the velocity field
of the carrier (usually a single-phase gas), the determination of the temperature field, including structural
temperatures which are required as boundary conditions, calculation of the pressure field, and evaluation of
the concentrations of the various components of the carrier gas, normally steam and hydrogen, and of the
transported materials. Each of these fields affects the aerosol behaviour, as described below, and in some
circumstances the aerosol behaviour has a substantial influence on the thermal-hydraulics.
The flow field
The flow field provides the carrier velocity at every point in the primary circuit. It therefore determines the
residence time of the aerosol-laden gas stream within each component of the circuit, and hence the
magnitudes of the fractional removal of the aerosol by the various deposition processes, e.g. settling,
impaction, thermophoresis. The flow is also important in determining the particle size spectrum. For
instance, a fast flow through the circuit will provide little time for agglomeration to occur, resulting in a
smaller average particle size. It can normally be expected that the calculated thermal-hydraulics will
conserve mass, so that the mass transfer rates from one volume to another can be considered reliable.
Details of the flow are not usually determined explicitly, although they may be important to the aerosol
physics. As an example, the turbulent energy dissipation, which is difficult to evaluate in practical
situations, is an essential parameter in the theory of turbulent agglomeration and in eddy impaction. The
streamlines of the flow also play a role in determining the concentration of fission products available at a
particular point of the circuit at a particular time. Thermal-hydraulic models used in association with
fission product transport codes normally assume a sequence of well-mixed connected volumes, in which
streaming, recirculation and other effects of the detailed flow field are ignored.
As mentioned elsewhere in the report, another important thermal-hydraulic parameter is the thickness of
the boundary layer in transition or turbulent flow, and this is supplied in the one-dimensional codes only
through the use of correlations based on fully-developed flow. When the flow is transient or is developing
e.g. downstream of a change of section, the calculated boundary layer can be incorrect with consequences
for the calculated deposition rate by thermophoresis, for instance.
The role of the flow in remobilising deposits through resuspension is treated elsewhere in this report.
Temperature effects
Thermal-hydraulic calculations determine not only the flow velocity, but also the gas temperature and
(when coupled with heat transfer calculations for structures) the local temperature difference between
NEA/CSNI/R(2009)5
58
surface and bulk gas. Both quantities are involved in the determination of the material properties of the gas
(thermal conductivity, diffusivity etc.), themselves employed in the calculation of aerosol deposition rates.
The gas and wall temperatures also play an essential role in determining the rates of any vapor
condensation on existing aerosols, of homogeneous nucleation, and of condensation of vapors on structural
surfaces. Sensitivity of aerosol deposition to calculated temperatures varies considerably depending on the
scenario, and needs to be determined case by case. The local temperature is important in the chemistry of
the transported materials (and that of the carrier), determining reaction rates and chemical equilibria.
Pressure effects
Pressure differences within the primary circuit are not usually large except in special situations such as
bypass sequences where critical flow can develop. Of more interest is the overall system pressure. Pressure
effects upon core degradation and fission product release are outside the scope of this article. It should be
noted however that for a given release the fission product concentrations are higher for higher system
pressures. The impact of pressure upon formation and growth was considered in Chapter 3.1. The pressure
is also an important factor in determining the Knudsen number, which features in a wide range of
processes in aerosol dynamics. Perhaps of most importance is the effect of pressure on the condensation
temperature of the carrier gas, usually steam. At high system pressures combined with moderate
temperatures condensed water can be formed within the primary circuit, affecting the thermal-hydraulics,
which becomes two-phase, and introducing the powerful aerosol deposition mechanism of
diffusiophoresis. Transport of fission products in liquid water, revaporisation by evaporation of liquid
deposits and other phenomena will then occur, not seen in experiments or scenarios with only single-phase
flow in the circuit.
Concentration and composition
The composition of the carrier stream and of the released materials carried within it depends greatly on the
core geometry, the degradation model, and assumptions concerning the supply of steam or water and the
generation of hydrogen and other gases. Hydrogen being much lighter than steam and its molecule much
smaller, carrier gas properties are highly dependent on the steam-hydrogen ratio, and hence so are the
calculated aerosol removal rates, local temperatures etc. Non-homogeneous concentrations are likely in
many situations, but are generally not considered in aerosol transport codes.
Boundary conditions
Circuit thermal-hydraulics plays a decisive role in fission product transport, deposition and remobilisation,
including the formation and dynamics of aerosols. Conversly, fission products and other released materials
can affect the thermal-hydraulics. The mass loading of the carrier gas stream by fission products is
generally insufficient to have a significant effect on its gas dynamics or on the gas thermal properties, and
the thermal energy released by fission product decay during transport is usually comparatively small
during the main flow transient. However, fission products deposited on surfaces, whether as aerosols or
through sorption, can have significant effects. Mechanical effects include changes in the geometry
available for the flow, up to and including plugging of flow paths, and increases in surface roughness.
Thermal effects become important when sufficient quantities of self-heating deposit have built up to
provide a local heat source. Such a heat source can provoke subisidiary flows, including recirculating
flows, can be a cause of revaporisation, and in extreme scenarios can lead to loss of geometry through
structural failure.

NEA/CSNI/R(2009)5
59
Modelling aspects
As has been mentioned, the circuit thermal-hydraulics calculated to drive the aerosol transport calculations
in severe accident codes is usually relatively unsophisticated. A pipe flow or parallel-channel geometry is
combined with one-dimensional fluid dynamics to produce the required velocities, concentrations and
temperatures. For reasons connected with the resolution of the aerosol size spectrum the number of
volumes cannot be very large, resulting in rather a coarsely discretised resolution of the flow and
temperature fields. Numerical experiments show sensitivity of the calculated aerosol processes to the
thermal-hydraulic model. The location of wall condensation is particularly sensitive. The application of
material transport models in combination with CFD is currently at an experimental stage in nuclear safety
evaluations.
Conclusion
Good thermal-hydraulic data are essential for the correct calculation of aerosol and vapor transport
processes in the primary circuit. Investigations into calculating more accurate and detailed
thermal-hydraulics than current severe accident codes can provide continue. Meanwhile, it is prudent in
safety evaluations to determine sensitivities to the thermal-hydraulic side of the calculational route
adopted.
3.2.2 Impact of thermal-hydraulics on aerosol behaviour in the containment
Introduction
In a severe accident the particulate fission product source term is not only governed by the aerosol
processes but depends also on the thermal hydraulic conditions prevailing in the containment. The main
interrelations between thermal hydraulics and aerosol physics are
• Transport processes
• Condensation processes
• Fission product decay heat processes
Fig. 3.2-1 shows schematically the most important interrelations in the containment.
Atmospheric flows
Fission product
decay heat
Steam saturation ratio
Natural
convection
Local aerosol
concentration
Agglomeration
Aerosol deposition
Droplet growth
Diffusiophoresis
Fig. 3.2-1 Interactions between thermal hydraulics and aerosol behaviour in a LWR-containment
NEA/CSNI/R(2009)5
60
Transport processes
The core melt aerosol entering the containment atmosphere through a leak in the coolant system or from
the cavity is distributed in the containment by atmospheric flows. The atmospheric transport is mainly
accomplished by pressure balancing flows in the early accident phase and by natural convection in the later
phase. In a LWR containment stratifications with the lighter steam at the top and the heavier colder air
below are likely. Parts of the containment may be excluded from atmospheric mixing due to such a
stratification or to a hindered atmospheric access, e. g. into a dead-ended room. An inhomogeneous aerosol
distribution is the consequence.
In the VANAM and the older CSE tests aerosol concentration differences between different compartments
in the vessel of approximately two orders of magnitude were measured. In a LWR containment the
differences are expected to be higher.
The particle growth by agglomeration as well as the aerosol deposition depend on the local concentration.
The aerosol concentration in vicinity of a source is usually higher than in the rest of the containment.
Surfaces of containment areas which are not reached by the aerosol, e. g. because of an atmospheric
stratification, are ineffective for the global aerosol depletion. In case of a small containment leak the local
aerosol concentration around the leak determines the aerosol source term.
Condensation processes
The aerosol behaviour is mainly influenced by two condensation processes: volume and wall condensation.
Steam condenses on the aerosol (volume condensation) when the relative humidity in the containment
atmosphere has the tendency to exceed saturation conditions. For aerosols of hygroscopic materials volume
condensation occurs even at conditions somewhat below saturation conditions. The particle growth by
volume condensation accelerates aerosol settling significantly. Fig. 3.2-2shows the depletion of an
insoluble SnO
2
aerosol under dry and condensing conditions [1]. In general volume condensation occurs
locally differently in the containment. Predominantly volume condensation takes place around steam
sources and close to cold structures. If the atmospheric mixing is poor large aerosol concentration
differences may develop between regions with and without volume condensation. An example is the
aerosol distribution in the VANAM tests [2].

NEA/CSNI/R(2009)5
61
Fig. 3.2-2 Aerosol depletion measured in three DEMONA tests under dry and wet conditions [1]
Fig. 3.2-3 shows the aerosol depletion in test M2. In the outer annular room the aerosol concentration is
significantly higher than in the rest of the containment.
Fig. 3.2-3
Measured and calculated aerosol depletion in the test VANAM M2 [3]
NEA/CSNI/R(2009)5
62
With wall condensation aerosol is deposited by diffusiophoresis onto the wall. Among others wall
condensation depends on the steam saturation ratio in the atmosphere and the temperature difference
between bulk and wall. Dry and wet walls at the same time and even in the same compartment are possible.
In general diffusiophoresis contributes less than sedimentation to the global aerosol depletion. But the AP
1000 and AP 600 reactors are exceptions to this. The used external shell cooling leads to an accentuation of
diffusiophoresis to the deposition of aerosol within the containment.
FP decay heat processes
The fission product (FP) decay heat carried by aerosols has a strong feedback on thermal hydraulics.
Airborne and deposited radioactive fission products hosted by aerosols present a considerable source of
heat. This heat is released partly into the atmosphere and partly into the structures and the sump. The
heat-producing gases are distributed in the atmosphere whereas the heat-producing aerosols will be found
predominantly on the floors and in the sump.
The decay heat released has a pronounced impact on the relative humidity, the wall and volume
condensation rates, and on the natural convection flows within the containment. The decay heat released
into the atmosphere reduces the relative humidity and the decay heat released to the sump promotes
evaporation which increases the relative humidity. At certain conditions the sump will come even to boil.
All described interaction processes have to be considered in a comprehensive and accurate aerosol source
term analysis.
Modelling aspects
Interrelation phenomena can only be examined in code systems where the individual models are
numerically coupled. In such couplings parameters of one model are provided for one or several other
models. The transfer parameters have to be updated in time. The tightness of the numerical coupling has to
be chosen according to the strength and velocity of the physical interrelation.
The modeling of aerosol transport processes requires a moderate coupling of the aerosol and thermal
hydraulic models and a multi-compartment representation of the containment. The characteristic period of
time of the aerosol processes and the atmospheric transport processes are comparable. The same applies to
the modeling of the decay heat feedback.
More complicated is the coupling for the condensation processes. Volume condensation and evaporation
are rather fast processes which require more sophisticated coupling methods, like the moving grid
technique used in several codes.
In most of the well known containment code systems (ASTEC, COCOSYS, CONTAIN, MELCOR) all
mentioned interrelation processes are modeled. Fig. 3.2-4 illustrates the interrelations treated in the
CONTAIN code [4]. Sometimes simplifying assumptions are made, e.g. the Kelvin-effect which appears
with volume condensation cannot be considered in multi-compartment calculations.

NEA/CSNI/R(2009)5
63
Fig. 3.2-4 Illustration of feedback mechanisms treated in the CONTAIN code [4]
As a consequence of the modeled interrelations the uncertainty of some thermal hydraulic parameters has a
very pronounced impact on the uncertainty of the calculated aerosol source term. In the conclusions of the
ISP-37 [5] the following is stated:
“However, the aerosol source term to the environment is overestimated in general. The largest
uncertainty concerning the aerosol results is caused by a limited number of thermal hydraulic
variables like relative humidity, volume condensation rate and atmospheric flow rate.”
The findings of this international study emphasise the importance of aerosol interrelation processes for
reliable source term analyses. A few years later the ISP-44 [6] concluded that there is still a need to
improve the quality of some thermal hydraulic parameters which have a strong impact on the aerosol
results.
NEA/CSNI/R(2009)5
64
References
[1] T. Kanzleiter DEMONA-Versuche Abschlußbericht, Final Report BIeV-R65.523-01 (1987)
[2] T. Kanzleiter Versuche zum Verhalten von Kernschmelzunfall-Aerosolen in einer
Mehrraum-Containment-Geometrie (“VANAM-Versuche”) Abschlussbericht BIeV-R67.098-01
(1995)
[3] H.-J. Allelein, K.O. Fischer, T. Kanzleiter, S. Schwarz, G. Weber The VANAM Experiments M1
and M2 – Test Results and Multi-Compartmental Analysis European Aerosol Conference AEC ’91,
Karlsruhe, 16 – 20 Sept. 1991
[4] K. K. Murata et al.Code Manual for CONTAIN 2.0: A Computer Code for Nuclear Reactor
Containment Analysis NUREG/CR-6533 (1997)
[5] M. Firnhaber, T. F. Kanzleiter, S. Schwarz, G. Weber International Standard Problem ISP-37
VANAM M3 - A Multi Compartment Aerosol Depletion Test with Hygroscopic Aerosol Material
GRS-137, OECD/GD (97) 16 (1996)
[6] M. Firnhaber, K. Fischer, S. Schwarz, G. Weber International Standard Problem ISP-44
KAEVER-Experiments on the Behaviour of Core-melt Aerosols in a LWR Containment
OECD/NEA/CSNI/R (2003) 5 (August 2002)
3.3 Fission-Product Transport and Deposition
3.3.1 Introduction
During a severe accident in a nuclear power plant (NPP), fission products (FPs), actinides and structural
materials are released as gases or vapors from the degrading core into the reactor coolant system (RCS).
These are then swept, in general, by a steam-hydrogen gas mixture towards the breach in the RCS. A
number of important physico-chemical processes occur between the point of release from the core and
release via the breach of still-suspended materials into the containment (or into the auxiliary building in the
case of a containment-bypass sequence). Not only do the phenomena occurring in the RCS reduce the
quantity of material released into the containment, they also condition its physico-chemical form; the
formation of highly-volatile chemical species leading to vapor-phase contributions to the source into the
containment is of particular concern. The importance of the different phenomena in conditioning the source
from the RCS varies in terms of the accident sequence, e.g., gravitational settling of aerosols is very minor
for a hot-leg break sequence since horizontal surfaces seen by the transported aerosols are limited, much
radioactive material remains in the vapor phase due to the relatively high temperatures between core and
breach, and transport times through the RCS are short due to the short distance travelled before release into
the containment and the high flow rates. Hence, below, a list of phenomena is presented representing the
principal phenomena arising beyond that of convection of gases and aerosols by the steam-hydrogen flow
and are briefly discussed in Chapter 3.
3.3.2 Synopsis of RCS phenomena and their modelling
The starting point here is a mixture of gases and vapors at a given temperature where this input is assumed
along with thermal-hydraulic boundary conditions for a particular RCS geometry.

NEA/CSNI/R(2009)5
65
Homogeneous nucleation of vapors
Even in an unsaturated vapor, molecular clusters exist but they are unstable. Once supersaturation is
established for a vapor it is ready to become aerosol or condense on a structural surface. It can be broadly
considered that homogeneous nucleation only occurs in conditions of extreme supersaturation in the
absence pre-existing aerosol. This is because the high surface energy of the small particles formed by
homogeneous nucleation constitutes a greater barrier than that due to condensation on existing surfaces
(aerosol or structural).
Nevertheless, it must be remembered that in the present context, the high radiation field reduces this
resistance by providing abundant ionic nucleation sites.
In general, therefore, if aerosols are not being produced by mechanical phenomena (e.g., bursting and
spraying of control-rod alloy or a steam explosion in the reactor vessel), moving downstream from the
point of release, the first aerosols are produced by homogeneous nucleation of the most refractory species.
This may be, for example, silver vapor or, in a later stage of the core degradation process, uranium dioxide
(or, more likely, uranium trioxide vapor non-congruently reverse-subliming to uranium dioxide). The
molecular clusters, or embryo particles, that form then quickly agglomerate while being simultaneously the
target of further condensation of the initial nucleating vapor as well as other supersaturating low-volatility
species. The picture may well be more complicated since more than one species may supersaturate and,
rather than unary nucleation, binary or even ternary nucleation will occur.
Beyond the vapor pressure itself, models require fundamental properties including chemical activities,
surface tensions and densities. In nuclear-safety computer codes the phenomenon is simplified.
Condensation of vapors on aerosols and structural surfaces
It should firstly be noted that the process of heterogeneous condensation onto existing aerosols and onto
surfaces can be considered a critical phenomenon: in the accident context it is fundamental to the quantities
of volatile species reaching the containment in aerosol form rather than being retained on RCS surfaces.
The volatile species concerned, i.e., those more volatile than the more refractory species creating the first
aerosols, comprise the majority of the most important FPs radiologically, e.g., cesium iodide.
Heterogeneous condensation occurs when a vapor supersaturates and a surface (aerosol or structure) is
available. The phenomenon is mainly governed by mass-transfer limitations where, in the RCS, such
limitations usually constitute considerably lower resistance to condensation than that of homogeneous
nucleation. It must also be remembered that while a vapor may be subsaturated in the bulk flow, it can be
supersaturated with respect to a structural surface exhibiting a cooler temperature where (as computer
codes assume) aerosols are at the same temperature as their surroundings, i.e., their minuscule heat
capacity and large surface-to-volume ratio mean that thermal equilibration with the surrounding gas is
always fast. Hence, condensation on a wall can arise without competition from aerosol formation or
condensation on aerosols. Once a vapor supersaturates in the bulk flow and aerosols are already present,
condensation onto these aerosols is efficient since a small amount of aerosol (in terms of mass) represents a
large surface area
1
.
Heterogeneous nucleation onto aerosols including the significant negative feedback from warming of the
particle due to latent-heat release by the condensing species has been correctly understood for many years.
Nevertheless, three complications exist. One arises from an aerosol particles’ considerable surface
curvature which, combined with the inherent surface tension of the condensed species, induces an increase
1
To consider a representative situation, given an aerosol loading of the flow of 5g.m
-3
, assuming aerosols to be spherical with a
uniform diameter of 1µm and a material density of 3000 kg.m
-3
, the aerosol surface area is 10m
2
per cubic metre of the flow.
NEA/CSNI/R(2009)5
66
in effective vapor pressure at the liquid surface formed on the aerosol. This so-called Kelvin effect can
both reduce total condensation and considerably bias it towards larger particles in an aerosol population
(such particles inducing lower surface curvature of the liquid phase). A second complication arises when
the particle size is smaller than or of a similar order to the mean free path between molecular collisions
(i.e., large Knudsen number). If this is the case consideration of the particle in a continuum regime breaks
down and the condensation rate must be corrected [1]. A third complication arises from the probable
heterogeneous nature of the aerosol surface affecting sites for condensation: this introduces considerable
greater complexity to the condensation phenomenon [2].
Chemisorption of vapors
Chemisorption of certain vapors, i.e., their chemical reaction with structural materials, is a well-known
phenomenon but for which little data is available. Some cesium and tellurium species react with metal
alloys and empirical chemisorption rates as a function of temperature have been derived for CsOH, CsI, Te
(and by extension, to SnTe) for stainless steel and Inconel surfaces.
There are also data for a handful of other species with respect to specific materials such as Zircaloy.
However, it can be said that this is a poorly investigated area where a vast amount of experimental work
would be required to provide rates for the species likely to be affected. At present the influence of vapors
chemisorption cannot be quantified.
3.3.3 Agglomeration of aerosols
Agglomeration occurs due to particle collisions arising from their differing velocities. Particle motion is
induced by Brownian diffusion, sedimentation and turbulence (shear and inertial effects) where other
influences such as electrical forces and acoustic influences are less relevant in the present context. Particles
combine due to Van der Waals forces, changes in surface free-energies and/or chemical reactions where
codes generally assume that the sticking efficiency is unity (i. e., colliding particles always stick together).
In the RCS, it is the Brownian mechanism which is of most importance since, once embryo particles have
formed, this phenomenon will rapidly lead to larger (and fewer) particles. Once the aerosols have grown to
a greater size the other agglomeration mechanisms (properly termed kinematic agglomeration) will come
into play. However, the generally short residence times of aerosols and turbulent conditions in the RCS
mean that sedimentary agglomeration is usually insignificant.
A particular point that should not be overlooked is that if agglomeration is a significant mechanism then
the numerical treatment of the aerosol population is critical in reproducing what the models intend. If a
fixed-grid scheme is used then a high number (50 or more) of size bins is usually required to avoid
significant spurious diffusion in the re-sizing scheme: a newly-formed particle will not find a size in the
discretized scheme that suits it perfectly and fractioning is needed between two adjacent size classes. The
coarser the discretization the worse the spurious diffusion.
Probably the most important uncertainty in this area is related to particle shape. As explained in Chapter 2,
it is common to associate two shape factors with an aerosol particle, one affecting its mobility (or dynamic)
properties, the other its collision properties. Spheres are the most compact particle form possible and so
any deviation from this has some impact on the resistance to movement and the probability of colliding
with another particle. Particles in the presence of high steam humidity tend to collapse to compact forms
under the influence of water surface tension. However, RCS conditions are generally highly superheated
and compaction due to steam is only likely to occur near the breach for particular sequences producing
saturated or near-saturated conditions in this region (cold-leg break or in the steam-generator tube in the
case of a steam-generator tube rupture). Nevertheless, perhaps other condensing species are abundant
NEA/CSNI/R(2009)5
67
enough to cause a compacting effect since there is evidence from representative experiments that particles
are, in fact, fairly compact despite superheated steam conditions. This means that high values for the shape
factors, such as for chain-like agglomerates, can probably be excluded. Nevertheless, the shape factors and
their evaluation remain a significant uncertainty. Evaluation techniques are often empirical where, in
relation to an arbitrary particle, there are no reliable analytical techniques for estimating the appropriate
values for use in an agglomeration model. Nonetheless, it is desirable that review of the most
representative experiments is undertaken with the objective of proposing more realistic values for the
shape factors, these values becoming the default values (rather than unity as is now assumed) in nuclear-
safety computer codes.
Brownian agglomeration is most significant for small particles where the free-molecular regime (Knudsen
number >> 1) and transition regime (Knudsen number of the order of 1) must be considered. The mobility
of small particles is very large but this effect is tempered by the reduced target area that they present.
Brownian agglomeration is most effective between very small and larger particles. In general, models
derive from Brownian diffusion theory with correction factors for the free molecular regime and
non-spherical particles.
Gravitational agglomeration is most clearly understood in terms of particle terminal velocities showing the
phenomenon to be proportional to the difference in the velocities of the two particles and the sum of their
projected areas (the target). Disparity arises in a factor termed the collision efficiency (see [3, 4]), where
this constitutes a correction from the ideal situation in which the larger particle sweeps and collects with
perfect efficiency all the smaller particles in its projected cylinder during free fall. The correction reduces
the efficiency due to hydrodynamic effects where smaller particles tend to flow around the larger particles
allowing some to avoid collection. In the RCS, the limited impact of gravitational agglomeration mean that
exploration of the different efficiencies is not required here [5].
Turbulent agglomeration arises due to the relative particle velocities induced by the shearing flow field and
particle drift relative to the flow arising from inertial differences. This latter contribution is zero for
particles of the same size and turbulent agglomeration reaches a minimum in this case. The present
modelling is affected by rather high uncertainties.
3.3.4 Deposition of aerosols
Aerosol deposition will occur in the RCS due to Brownian diffusion, thermophoresis, diffusiophoresis,
electrophoresis, sedimentation (gravitational settling), inertial impaction (projection onto surfaces by
flow-geometry changes and turbulent eddies) and pool scrubbing. Among these phenomena, not all are
certain to be significant since they can be considered scenario dependent. Brownian deposition will be
significant if particles, once formed, remain small. Pool scrubbing phenomena, the subject of a separate
Chapter in this report, may occur in the pressuriser (e.g., high-pressure sequence such as station black-out)
or the steam-generator secondary side (steam-generator tube rupture). Probably only thermophoresis can be
guaranteed to produce significant deposition whatever the accident sequence.
Deposition due to diffusion
Diffusional deposition is most relevant to the RCS zone where the first vapors nucleate and particles
remain small, i.e., within the reactor vessel. For laminar flows, use of the classic Brownian-diffusion
approach (Fick’s law) is only appropriate in the limit of stagnation. Hence, deposition from a laminar flow
due to diffusion is often based on empirical models where that of Gormley and Kennedy [6] is used. A key
parameter in this model is the length over which diffusion occurs: in ASTEC/Sophaeros, for example, a
fixed value of 10
-4
m is used. For turbulent flows, the phenomenology changes where the turbulence brings
particles close enough to the wall for diffusion to become the dominant transport mechanism and lead to
NEA/CSNI/R(2009)5
68
particle deposition [7]. Diffusional deposition, affecting above all highly-submicron particles, is usually
such a small contribution to overall deposition that the modelling approximations do not matter.
Deposition due to thermophoresis
Thermophoresis is a phenomenon which, unusually, does not depend strongly on particle size though is
larger for submicron particles. As a result of imbalanced collisions between gas molecules and aerosol
particles, particles in a temperature gradient experience a force directed towards cooler temperatures
(countered by the hydrodynamic drag force). Highly-conducting (e.g., metallic) particles are less affected
by thermophoresis than are particles of more insulating materials. For larger particles a thermal gradient
may be established in the particle introducing considerable complexity. Correction for slip due to the
greater ease of transport for particles in the free-molecular regime must also be accounted for.
A number of models exist for this phenomenon though it is common to use the Brock formula with
numerical coefficients provided by Talbot et al. [8] that allow good agreement with experimental data over
the free-molecular, transition and continuum regimes. This modelling would seem to be reliable (well
validated) though recent work shows some controversy concerning the validity of the approach in the case
of very high temperature gradients, [9, 10]. It is desirable to follow this work in case of any changes
required to nuclear-safety computer codes since the aspect of high temperature gradients is relevant.
Deposition due to diffusiophoresis
Diffusiophoresis occurs as particles are entrained by a net flow of a vapor species (steam) towards a
surface where the vapor condenses. The flow of the condensing vapor is characterised by its Stefan
velocity, a key parameter for the aerosol diffusiophoresis. In the RCS, only certain accident sequences lead
to steam condensation on surfaces, those involving lower temperatures such as cold-leg break or
steam-generator tube rupture. In fact, diffusiophoresis never occurs alone but must necessarily be
accompanied by thermophoresis so we actually observe thermo-diffusiophoresis. Once the thermal-
hydraulic problem of determining the Stefan velocity of the condensing steam is resolved, the
diffusiophoretic velocity of aerosols is proportional to this velocity but must be corrected as a function of
the gas composition (involving not just steam but incondensable gases) and the particle flow regime
(Knudsen number): this is complex and the most generally valid model is that of Loyalka [11]. The much
simpler model of Waldman [12] is valid in the free-molecular regime only. This modelling has benefited
from broad validation and cannot be considered at present a priority for further attention.
Deposition due to electrophoresis
Deposition may be enhanced due to electrophoresis, a complex process dependent on aerosol decay
activity, size, concentration and confining geometry. Radioactive aerosols self-charge electrically where,
broadly, due to the dominance of α decay (this event generally stripping out more electrons from the
particle than the two positive charges it carries away) and β
-
decay, a positive charge develops though very
small particles can develop a small negative charge – see the relevant theoretical [13] and experimental
[14] work. However, the theoretical work indicates that particle charging is very sensitive to two factors: in
the RCS the small size of the particles should considerably limit their capacity to self-charge while their
high number concentration should reduce their self-charging by facilitating diffusive combination with
gas-phase ions. Then again, it must be acknowledged that, as predicted in [13], confinement of the aerosols
such as in the RCS may aid charging by lowering ion concentrations. In summary, the theoretical work
implies limited self-charging in these conditions except, perhaps, for regions of particularly confined flow.
At present, nuclear-safety computer codes do not take account of this effect. If this is justified or not, can
only be shown by a proper assessment of its impact on the fission product source term to the environment.
NEA/CSNI/R(2009)5
69
Deposition due to sedimentation
Particles settle under the influence of gravity where the settling (or terminal) velocity is broadly
proportional to the square of the radius. In a turbulent flow particles fall across the boundary layer whereas
in a laminar flow the aerosols of the whole flow are concerned. Gravitational settling is not particularly
significant in the RCS due to the usually limited size of particles (small settling velocities) and their short
residence time before release to the containment. Corrections must be introduced to the situation of a
perfectly laminar flow around the particle (Stokes regime) for the cases of slip of small particles and the
extra drag on larger particles where flow is no-longer perfectly laminar and wake effects can be induced.
Nuclear-safety computer codes do not take this latter effect into account though, as already stated, the
settling mechanism most often has a limited impact which may well mean that modelling approximations
have little effect on predictions of the source term to the containment. Further work in this area is not a
priority.
Deposition due to inertial impaction
Particles can be projected onto surfaces by flow-geometry changes where, due to their inertia, they deviate
from the mean flow direction to come into contact with confining walls or obstructions. Such geometries
are common in the RCS but most can be generally considered as bends, contractions, expansions or
combinations of these. The impaction phenomenon clearly comes in to play as particle size increases
where, in general, submicron particles are not concerned being more influenced by other deposition
mechanisms. Models for simple geometry changes do exist in the literature but have received little
validation in reactor-relevant conditions, particularly highly turbulent flows. Furthermore, there are
empirical models for these geometries as well as models for specific complex geometries encountered in
reactors such as the components of the steam-generator secondary side.
In turbulent flow, eddies act to project particles towards surfaces where sufficient momentum is imparted
to the particles that they can cross the boundary layer and come into contact with the wall. The
phenomenon is highly sensitive to particle mass, or more strictly the relaxation time of the particle. A
number of theoretical models exist but with varying degrees of agreement with respect to data. Hence,
more empirical models are often used such as that derived from the careful experiments of Liu and
Agarwal [15]. Since few particles usually become quite large (supramicron) in RCS conditions, this
phenomenon is not a dominant mechanism.
One phenomenon which is overlooked in nuclear-safety computer codes which is associated with inertial
impaction phenomena is that of particle bounce. The sticking efficiency of particles is not perfect
especially for the higher impact velocities. It is possible for impacting particles to bounce, to disintegrate
and/or to dislodge particles already on the surface. Significant data requirements are apparent since the
models of particle sticking often involve parameters such as the Hamaker constant. What is certain is that
for high velocity flows in dry (super-heated steam) conditions with hard (salt, ceramic and metal) particles,
bounce will occur. The present understanding on particle bounce is summarised in [16].
References
[1] S.K. Loyalka, J.W. Park“Aerosol growth by condensation: a generalization of Mason’s formula” J.
Colloid Interface Sci. 125, 712-716 (1988)
[2] L.J. Willett et al.“Adsorption on heterogeneous regular surfaces” J. Colloid Interface Sci. 238,
296-309 (2001)
[3] I.H. Dunbar, J. Fermandjian“Comparison of sodium aerosol codes”CEC report EUR 9172 (1984)
NEA/CSNI/R(2009)5
70
[4] R.L. Buckley, S.K. Loyalka“Implementation of a new model for gravitational collision cross
sections in nuclear aerosol codes”
Nucl. Tech. 109, 346-356 (1995)
[5] H.R. Pruppacher, J.D. Klett“Microphysics of Clouds and Precipitation”Reidel, New York (1978)
[6] P.G. Gormley, M. Kennedy“Diffusion from a stream flowing through a cylindrical tube”Proc. Roy.
Irish Academy, 52, 163 (1949)
[7] C.N. Davies"Aerosol Science"Academic Press (1966)
[8] L. Talbot, R.K. Cheng, R.W. Schefer, D. R. Willis“ Thermophoresis of particles in a heated
boundary layer”J. Fluid Mech., 101, 737-758 (1980)
[9] R. Muñoz-Bueno, E. Hontañón, M.I. Rucandio “Deposition of fine aerosols in laminar tube flow at
high temperature with large gas-to-wall temperature gradients” J. Aerosol Sci. 36(4), 495-520
(2005)
[10] C. Housiadas, Y. Drossinos“ Thermophetic deposition in tube flow” Aerosol Sci. Tech. 39,
304-318 (2005)
[11] S.K. Loyalka “Velocity slip coefficient and diffusion slip velocity for a multicomponent gas
mixture” Physics of Fluids, 14 n°12, 2599-2604, (1971)
[12] L.Z. Waldmann“On the motion of spherical particles in non-homogeneous gases”Rarefied Gas
Dynamics, Academic Press, New York (1961)
[13] C.F. Clement, R.G. Harrison“Enhanced localised charging of radioactive aerosols“ J. Aerosol Sci.
31, 363-378 (2000)
[14] F. Gendarmes, D. Boulaud, A. Renoux“Electrical charging of radioactive aerosols - comparison of
the Clement-Harrison model with new experiments“ J. Aerosol Sc. 32, 1437-1458 (2001)
[15] B.Y. Liu, S.K. Agarwal“Experimental observation of aerosol in turbulent flow” J. Aerosol Sci., 5,
145-155 (1974)
[16] Special Issue of Aerosol Science and Technology Volume 22, Issue 1 (1995)
3.3.5 Containment
During a severe reactor accident nuclear aerosols composed of fission products, actinides and structural
material are released into the reactor containment at different locations and at different times. The aerosols
enter through a leak in the reactor coolant system (RCS) and after the vessel failure they are released from
the molten core in the cavity. Resuspension processes give further nuclear aerosol sources. At a
H
2
-defla-gration deposited aerosol is resuspended and aerosols are re-entrained from flashing or boiling
water pools.
The amount of aerosol released by the different sources as well as the particle size distribution varies
considerably. During core degradation several 100 kg of aerosol are expected to be swept through the RCS
leak. During this release in general the aerosol concentration in the containment (> 1 g/m
3
) reaches the
highest values in the accident sequence. The aerosol release with re-entrainment is comparatively small but
NEA/CSNI/R(2009)5
71
it represents a persistent source in the late accident phase. At this time most of the aerosol from other
sources has already been deposited.
Especially in the lower part reactor containments are subdivided by structures into compartments of
different sizes. The thermal hydraulic conditions within the compartments can vary significantly. The
parameters most relevant for the aerosol behaviour are the gas temperature, the relative humidity, the wall
and the volume condensation rates and the local atmosphere flow velocity. Locally different thermal
hydraulic conditions will be established when atmospheric mixing in the containment is weak or one or
several compartments are excluded from mixing. This happens with atmospheric stratifications when a gas
with lower density lies above gas with higher density or with dead-end rooms. Thus it is possible that in a
part of the containment wet conditions with volume condensation occur increasing aerosol depletion while
the other part stays dry.
Transport
The containment atmosphere is mainly mixed by natural convection driven by locally different gas
densities. Lowly situated steam and heat sources enhance natural convection. Only in relatively short
periods forced convection appears in the containment as during the blow-down phase or with
H
2
-deflagrations.
From the locations of release the aerosols are distributed within the containment by atmospheric flows. In
general the aerosol particles are carried with the gas velocity. Only large particles like condensate droplets
have a noticeable slip in the gas. This slip causes an aerosol transport in direction of settling. This
additional transport is relevant in stagnant atmospheres.
Deposited aerosols are transported by condensate flows. The aerosols are washed down from the walls and
transported by the condensate flows to the sump. Soluble aerosols are washed down more completely than
insoluble aerosols. The aerosol wash down process determines the fission product and the decay heat
distribution between surfaces and sump. The decay heat released to the gas and to the dry walls heats the
atmosphere and reduces the relative humidity. Decay heat released in the sump increases the steam
production and the relative humidity.
Aerosol transport and deposition in multi-compartment containment geometries were investigated in the
experimental series DEMONA (test A9 only) [1], VICTORIA [2], and VANAM [3]. The VANAM tests
were the most comprehensive ones. They were carried out in a large-scale model containment structured
into nine compartments. The aerosol concentration measured in the compartments differed by up to two
orders of magnitude. The highest concentration was measured in compartments in which the conditions
were dry throughout the entire test. In a real containment leaks in the shell are likely to occur in this area.
Details are described in chapter 5.3.5. The VANAM tests impressively demonstrated the need of
multi-compartment accident analyses. Simple single volume calculations with implicitly well-mixed
conditions do not necessarily deliver conservative source term estimations.
Condensation
Particle growth by volume condensation of steam can increase aerosol depletion considerably. In general
the particle growth is described by the Mason-equation [4]. Small particles with a strong curvature can be
excluded from the condensation process (Kelvin-effect), stay dry and deposit only slowly. In accident
calculations the Kelvin-effect is often not treated because of numerical problems. On hygroscopic aerosols
condensation already occur at slightly superheated atmospheres (relative humidity < 100 %). Hygroscopic
nuclear aerosol materials are CsOH, CsI, Sr(OH)
2
and others. Particles mixed from hygroscopic and
non-soluble materials and in droplets where the soluble material is dissolved in water have a reduced
NEA/CSNI/R(2009)5
72
hygroscopic effect. The KAEVER tests [5] demonstrate the impact of the hygroscopic effect on the
depletion of single component aerosols and mixed aerosols. The hygroscopic materials employed were CsI,
CsOH, and the insoluble materials Ag, SnO2 (see Chapter 5.3.6).
Volume condensation occurs in a saturated atmosphere, which has a tendency to supersaturation.
Equilibrium volume condensation rates are calculated by thermal hydraulic models with the assumption of
thermal equilibrium between the stem and the water droplets. Volume condensation appears in
compartments with a steam source and certain conditions like cold walls, the presence of non-condensable
gas (air), etc. [6]. Up to about 7 % of the released steam may condense in the volume. Decay heat released
to the atmosphere reduces volume condensation. The impact of decay heat is investigated analytically
since no tests with realistic decay heat releases are available. Even in the PHEBUS FP tests the decay heat
was significantly lower than estimated for a severe accident. In general volume condensation occurs locally
but the fog droplets are distributed by the atmospheric flows. In other parts of the containment the droplets
may dry and shrink again.
Agglomeration
Agglomeration causes a growth of the aerosol particles, a reduction of the particle number, and a mixing of
chemically different aerosol materials within the growing particles. The following processes are relevant in
the containment: Brownian agglomeration, gravitational agglomeration, and agglomeration by turbulent
inertia and turbulent diffusion. In general Brownian agglomeration will prevail. Gravitational
agglomeration becomes important when the particle size distribution is broad with pronounced fractions of
small and large particles. Agglomeration is only effective at relatively high aerosol concentrations
(> 1 g/m
3
).
In multi-component aerosols where the components are not well mixed in each particle the components can
deposit with different velocities. Multi-component models have some model restrictions, e.g. the material
density for all components, and are only partly validated. A multi-component treatment is necessary when
the deposition behaviour of the components is rather different and the aerosol concentration is not very
high (< 1g/m³).
Deposition
The deposition of aerosols on the containment surfaces depends on the geometry, the aerosol parameters
like particle size distribution, density of the aerosol material, shape of the particles, and thermal hydraulic
conditions etc. Aerosol deposition takes place due to the processes sedimentation, diffusion,
diffusiophoresis, thermophoresis, and electrophoresis (s. chapters 2.6 and 3.3.1). Here only containment
specific aspects on the deposition process including condensation on particles and agglomeration are
treated.
In general sedimentation is the most effective depletion mechanism in the containment. Particle growth by
agglomeration and volume condensation can increase settling considerably. If condensation is involved the
largest uncertainty in the calculated deposition rate is given by uncertain thermal hydraulic parameters like
the relative humidity and the volume condensation rate. In the dry case a main uncertainty comes from
uncertain shape factors.
Small particles have considerable deposition by diffusion. This process can be essential e. g. for
fine/disperse aerosol from re-entrainment processes which especially occur in the late accident phase. The
largest modelling uncertainty comes from the boundary layer thickness, which is an input parameter in
most models.
NEA/CSNI/R(2009)5
73
Diffusiophoresis is the only important phoresis process in a LWR-containment. Deposition due to
diffusiophoresis is nearly independent from the particle size. The local wall condensation rate may differ
significantly in the compartments and has to be determined by the thermal hydraulic model.
Thermophoresis is only significant with strong temperature gradients in the atmospheric boundary layer
along cold walls. This may be the case near the hot corium pool or with fires in the containment.
All important aerosol transport and natural deposition processes relevant in severe accidents are well
investigated and modelled. Most accident codes allow a multi-compartment representation of the
containment. Additionally aerosol behaviour and thermal hydraulic models are tightly coupled in order to
simulate the important interrelation phenomena.
References
[1] J.O. Liljenzin, J. Collén, W. Schöck, F.J. Rahn Report from the MARVIKEN / DEMONA / LACE
Workshop Proceedings of the OECD/NEA Workshop on Aerosol Behaviour and
Thermal-Hydraulics in the Containment, Fontenay-aux-Roses (France), 26-28 Nov. 1990, CSNI
Report No 176
[2] J.M. Mäkynen et al. Experimental and Modelling Studies on Containment Aerosol Behaviour in the
Victoria Facility 3rd OECD-Specialist Meeting on Nuclear Aerosols in Reactor Safety, Cologne,
15-18 June, 1998
[3] T. Kanzleiter Versuche zum Verhalten von Kernschmelzunfall-Aerosolen in einer
Mehrraum-Containment-Geometrie ("VANAM-Versuche") Battelle-Institut e. V., Frankfurt/Main
Abschlußbericht BleV-R67.098-01 (1995)
[4] J. B. Mason The Physics of Clouds Claredon Press, Oxford (1971)
[5] G. Poss, D. Weber Versuche zum Verhalten von Kernschmelzaerosolen im
LWR-Containment-KAEVER Fachbericht BF-R-67863, Battelle Ingenieurtechnik GmbH, Mai 1997
[6] G. Weber Calculation of Local Equilibrium Fog Formation Rates with a Multi-Compartment
Containment Code Proceedings of the OECD/NEA Workshop on Aerosol Behaviour and
Thermal-Hydraulics in the Containment, Fontenay-aux-Roses (France), 26-28 Nov. 1990, CSNI
Report No 176
3.4 Aerosol Behaviour in Complex Structures of Steam Generator Secondary Site
3.4.1 Issue and status
Steam Generator (SG) reliability and performance are serious concerns in the operation of pressurised
water reactors. In particular, SG tubing is subject to a variety of degradation processes that can lead to tube
cracking, wall thinning, and potential leakage or rupture. However, over the last decade considerable
efforts have been spent to understand these degradation processes and to develop improved modes of
operation, preventative and corrective measures. Nonetheless the SG tube leakage incidents occurred in the
past (see Table 3.4-1) proved that such occurrence can not be completely ruled out. Even if they are design
basis events and plants are designed to cope with them it cannot be excluded, that such an event escalates
into a severe accident with a significant radioactive release to the environment.

NEA/CSNI/R(2009)5
74
Table 3.4-1 A summary records of steam generator tube rupture accidents
Plant Date Leak Rate
(lpm)
Break Type and location Plant status and
cause of the
rupture
Point Beach
Unit 1
February 26,
1975
470 2 adjacent ruptured bulges, each
~20 mm long and wide, hot leg
side, above tube sheet, in the
sludge pile region
Full power,
Wastage
Surry Unit 2 September
15, 1976
1250 Top of U-bend, 114.3 mm long
axial crack
Full power,
PWSCC in U-bend
Doel Unit 2 June 25,
1979
510 Top of U-bend, 100 mm long
axial crack
Heated to normal
conditions,
PWSCC in U-bend
Prairie
Island 1
October 2,
1979
1270 Fish mouth, 76 mm above tube
sheet, 38 mm long, 13 mm wide
Full power,
Loose parts
Ginna Unit 1 January 25,
1982
2900 Fish mouth, 50 mm above tube
sheet, 150 mm long
Full power,
Loose parts and
tube wear
Fort
Calhoun
May 16,
1984
425 Horizontal run at the top, 32
mm long cracks, yielding small
fish mouth break of 6 mm long
Plant start-up,
ODSCC at a
crevice
North Anna
Unit 1
July 15,
1987
2410 Top of the 7
th
upper tube
support plate on cold leg side,
360
o
circumferential
crack
Full power,
High cycle fatigue
in a U-bend
McGuire
Unit 1
March 7,
1989
1900 95 mm axial crack with 9.5 mm
wide at the maximum
Full power,
ODSCC in the free
span
Mihama
Unit 2
February 9,
1991
2600 Top of the 7
th
upper tube
support plate on cold leg side,
360
o
circumferential
crack
Full power,
High cycle fatigue
Palo Verde
Unit 2
March 14,
1993
910 Freespan region between 8
th
and
9
th
tube support plate, 65 mm
long fish mouth in a 250 mm
long axial crack
98 % full power,
ODSCC
Indian Point
Unit 2
February 15,
2000
564 A low row U-bend Full power,
PWSCC in U-bend
Legend for degradation mechanisms identified below by stressor:Fretting, Wear – flow
induced vibration, aggressive chemicals
High cycle fatigue – high mean stress level and flow induced vibration, initiating defect
(crack, dent, pit, etc.)
ODSCC – tensile stresses, impurity concentrations, and sensitive materials
PWSCC – temperature, residual tensile stresses, sensitive materials (low mill anneal
temperature)Wastage – phosphate chemistry, chloride concentration, resin leakage
NEA/CSNI/R(2009)5
75
A leakage of radionuclides from the primary circuit into the secondary side negates the effectiveness of the
containment. Under certain conditions high release of radionuclides to the environment is possible during
postulated severe accidents. Risk assessment studies generally consider two types of severe accidents:
• An operational event or design basis fault that causes a SG tube rupture which then results in core
damage;
• A core damage sequence, which might impose prevailing pressure and temperature conditions,
could lead to SG tube rupture.
Failure of one or a few tubes can spontaneously happen as a result of any degradation process. However,
multiple SG tube failures can only be induced by a very large pressure difference between the primary and
the secondary side of the steam generator following occurrence of one of many foreseeable scenarios. A
steam line break, turbine trip with a stuck open secondary side safety valve, loss of feed water, ATWS
without turbine trip, station black out with a stuck open secondary side safety valve, etc., are examples of
such scenarios. Several studies have provided insight into the tube failure mechanisms and conditions
leading to tube failure. Conditions necessary to preserve core cooling were identified. These studies also
estimated the containment bypass frequencies with a core melt if the latter cannot be avoided.
Most probabilistic risk assessments (PRAs) and severe accident codes assume that a significant fraction of
fission products flowing through an unisolated break in a SG escapes to the environment. For example, in
NUREG 1150, the median estimate of the fraction of the core inventory of iodine released to the
environment was 27%, and the 95
th
percentile estimate was 80 %. This estimate was based on an expert
elicitation panel since none of the specific features of the retention mechanisms in the secondary side of a
SG as modelled in severe accident codes were assessed against any experimental data; nor was it possible
to quantify the uncertainty involved in the code predictions.
The SGTR project of the 5
th
Framework Programme of Euratom is the first European project (2000 - 2002)
started generating understanding in a systematic way for possible mechanisms for retaining aerosol
particles in tubes and in the complex structures of the secondary side of a SG. In particular, PSAERO and
HORIZON experiments from Finland were conducted for studying in-tube retention, whereas the retention
in the bundle region was investigated in the ARTIST and PECA-SGTR experiments, respectively from
Switzerland and Spain. In addition, certain modelling efforts to develop a correlation for the retention in
the bundle were initiated.
International cost share project ARTIST (AeRosol Trapping In a Steam GeneraTor), run and coordinated
by PSI, (2003-2007) studies aerosol behaviour in tubes of a western design inverted u-tube SG, in the
vicinity of the tube break where a transition from a very high to low flow velocities occurs, the far field
stages of the bundle, the separator and dryer. A wide range of operational conditions of the components
(namely, dry, wet and transition), and thermal-hydraulic and aerosol parameters are addressed.
Additionally the droplet behaviour in the separator and dryer is systematically investigated. An extensive
interpretation of the data and modelling efforts has accompanied the experimental program.
The SARNET (Network of Excellence for a Sustainable Integration of European Research on Severe
Accident Phenomenology) project of the 6
th
Framework Programme of Euratom (2004 - 2007) provides a
further forum where additional efforts are coordinated to understand the complex aerosol-phenomena and
to model the available data within the SARNET project.
NEA/CSNI/R(2009)5
76
3.4.2 Theoretical background on possible aerosol removal in the steam generator
The main components of a SG are the inlet and outlet plenums, tube bundle, droplet separator and steam
dryer. The western design SGs are vertically built and the bundle is composed of straight tubes or inverted
u-tubes connecting the inlet and outlet plenums. The Russian VVER designs utilise a horizontal bundle.
As a result of large variations of the flow velocity, and the differences in the geometry of these main
components, the important processes are introduced in the following subsections depending on their
physical location in the SG.
The following subsections focus on the aerosol removal processes in a vertical SG bundle with an inverted
U-bend. Tentative values of various magnitudes important for aerosol behaviour are provided in the
following subsections in order to give the reader a feel about their significance. The values are based on a
break flow estimated by assuming that there is only one ruptured tube and the ratio of the primary to the
secondary pressure is about 5.
3.4.2.1 Turbulent deposition inside the broken tube
For any size of the tube break, the flow out of the broken tube is choked because the pressure ratio between
the primary and the depressurised secondary side is bigger than two. This produces velocities inside the
tube, which are on the order several 100 m/s. At these velocities, turbulent deposition is the dominant
aerosol removal mechanism. Turbulent deposition is an eddy diffusion-driven mechanism that becomes
important whenever the flow is highly turbulent. Earlier studies [1] indicate that turbulent deposition at
these conditions is important and is almost solely a function of tube dimensions (L/D) for particles of
interest (> 0.3 µm). On the other hand, resuspension may also become important at these high velocities,
and somewhat cancel the retention to a degree yet to be investigated. If the break is located in the
downstream side of the bend at the cold leg side of the bundle, relatively higher aerosol deposition can be
expected in the bend. However, such deposition can cause gradual increase in the pressure drop, which
might in turn cause a rapid flushing of deposits. Other possibility for an additional deposition is the fission
product vapor condensation in the tubes if the aerosol–laden gas flowing into the inlet plenum from the hot
leg is at a temperature of >900 K, a level at which a certain fraction of volatile fission product mass is still
in vapor form. This vapor will then condense on the inner surface of tubes as well as on the airborne
particles as the gas cools off due to heat transfer. However, any increase in pressure drop in the broken
tube could easily cause flow redistribution among the other intact tubes. Such induced flow redistribution
will definitely contribute to retaining aerosols and fission product vapors in the intact tubes. The very
dynamic nature of these complex processes of coupled aerosol deposition/resuspension-flow
hydrodynamics requires very detailed and simultaneous treatment of the flow and aerosol dynamics and
thermodynamics that is not yet attempted.
3.4.2.2 Inertial and turbulent deposition on the secondary structures in the bundle
Inertial and turbulent deposition in the break stage
The break stage is the section of the bundle between two support plates (the first could be also the tube
sheet) where the aerosol-laden gas is discharged from the ruptured tube. The flow at the break location will
be sonic, and local velocities are expected to be on the order of several 100 m/s. The aerosol retention by a
single cylinder in turbulent cross flow has been investigated by Douglas [2, 3].The collection efficiency
was correlated as a function of the Stokes number, which is defined by:

NEA/CSNI/R(2009)5
77
D
U
D
UCd
Stk
spp
τ
µ
ρ
≡=
18
2
where ρ
p
is the particle density, d
p
the particle geometric diameter, U the gas velocity, C
s
the slip
factor, µ the gas viscosity, D the cylinder diameter, and τ the particle relaxation time. Douglas [2] found
that the collection efficiency varied between 2 % to about 30% when the Stokes number was varied
between 0.004 and 0.06. For full nominal flow rate (about 900 kg/h), it is expected that the velocity will
decrease from a couple of 100 m/s at the break to 10 m/s over the distance spanned by a few tube rows.
Table 3.4-2 below illustrates the expected Stokes numbers and particle relaxation time for three different
aerosol particle sizes at two representative flow velocities.
Table 3.4-2 Stokes numbers for break stage velocities
AMMD
µm
τ
s
Stk
U= 300 m/s
-
Stk
U= 10 m/s
-
1 5.8 10
-6
0.09 0.003
3 4.6 10
-5
0.72 0.024
10 3.8 10
-4
6.0 0.200
In the actual case the retention is a function of many multiple and dynamic parameters:
− Break type and orientation induced velocity distribution,
− Aerosol characteristics (size distribution, stickiness, etc.),
− Gas and wall temperatures, heat-up of the structures,
− Transport and condensation of fission product vapor, if available.
− Deagglomeration of aerosol agglomerates due to high shear forces produced by the expansion, if it
occurs, which might modify the aerosol size distribution,
− Many different aerosol deposition processes, aerosol growth by vapor condensation, removal by
interception and impaction, etc.
Inertial impaction on the support plates
Away from the break, the flow will spread and move upwards towards the support plate. As a result the
velocity will decrease considerably compared to the sonic speed at the break point. The flow exits the
break stage through passages in the support plate. The passages are narrow enough that there exists a
potential for inertial impaction on the plate surface. The aerosol retention at a contraction is a function of
flow and aerosol characteristics [4] as measured by the Stokes number. For flow at contractions, the
aerosol retention has traditionally been correlated as a function of velocity in the far field and the diameter
of the contraction. The mean velocity U in the bundle can be obtained from the following relationship:
UAm
ρ
=
&

NEA/CSNI/R(2009)5
78
where
&
m is the flow rate out of the break, ρ the gas density, and A the free flow area in the bundle. At
a typical secondary temperature of 400 °C and pressure of 1 bar, the gas density is 0.32 kg/m
3
, and thus the
mean velocity U in the bundle space is 0.2 m/s for the nominal full flow rate. For an effective diameter of
each hole in the support plate of about 8 mm, Stokes numbers as a function of particle diameter at a mean
velocity of 0.2 m/s are shown in the Table 3.4-3below:
Table 3.4-3 Stokes numbers for far field mean velocity of 0. 2 m/s
AMMD
µm
τ
s
Stk
-
(Stk)
1/2
-
1 5.8 10
-6
1.5 10
-4
0.012
2 4.6 10
-5
1.1 0
-3
0.033
10 3.8 10
-4
9.6 10
-3
0.098
In the experiments [4] investigating deposition on the upstream face of a critical orifice, it is found that
there is no aerosol retention below Stk
1/2
of 0.3. Similarly, in the experiments [4] on aerosol collection in
membrane filters, very little retention was found for values of Stk
1/2
below 0.2. Simple extrapolation of
these results to SG tube support plate might result in expectation of little aerosol deposition on the support
plate. However, since the geometry of the holes in the support plate and the flow field underneath or just
above the tube support plate are quite complex, the extent of validity of this extrapolation is in question.
Flow expansion at the top surface of the support plate can induce recirculation that could easily alter the
deposition pattern of the aerosols. Such details require an in depth analysis of local flow fields in detail and
particle tracking.
Inertial impaction on the tubes in the far field stages and on U-bends
Beyond the break stage the flow will be mainly in the vertical direction, and little retention by inertial
impaction on the tube structures is expected at a gas mean velocity of in the order of 0.2 m/s. On the
U-bend region, the velocity would remain quite small and the retention, based on the Stokes number, can
be estimated from the cross-flow data of Douglas [2]. The Stokes numbers are shown for different aerosol
sizes in Table 3.4-4 for a flow velocity U of 0.2 m/s and the tube diameter D of 19 mm. The results from
Douglas indicate very insignificant retention for Stokes number below 4.0 10
-3
., which means that for
particles under 10 µm the retention should be insignificant if the inertial impaction is the only mechanism.
Table 3.4-4 Stokes numbers for U -bend section
AMMD
µm
Stk
-
1 6.2 10
-5
3 4.8 10
-4
10 4.0
.
0
-3
Although the aerosol removal by inertial impaction alone on the surfaces of the straight tubes and on the
U-bend can be small, however, expected enhanced recirculation especially in the bend region might

NEA/CSNI/R(2009)5
79
modify the retention process considerably. An experimental and analytical database on the latter is
currently not available.
If the break location is within the U-bend section, depending on the number of tube rows that the flow
cross through until it reaches the free space below the separator inlet, the retention processes introduced
under ‘break stage’ also apply here.
3.4.3 Inertial impaction and interception in the separator and dryer sections
Separators and dryers, due to their complex geometry produce very complex and changing flow patterns
and velocities. Inertial impaction, interception, turbulence initiated particle agglomeration are the main
processes that can have a role on the particle size dependent aerosol removal. The swirl vane, cyclones and
the lid (which hinders water up flow in the normal operation) are the main components of any PWR
separators that modify the flow pattern and hence interact with the motion of the particles. The retention
efficiency of these components under normal power operation for removing large size water droplets in the
order of several 10 µm is very high. However, due to relatively small flow rate and hence gas velocity and
the micron-sub-micron aerosol size expected under severe accident conditions, the removal efficiency of
these components at full power conditions cannot be applicable to the severe accident conditions.
3.4.4 Other processes
Agglomeration
If the aerosol concentration and residence time in the secondary side are large enough, agglomeration
occurs and shifts the original size distribution. The aerosol concentration in the secondary side of a PWR
can be on the order of 10 g/m
3
. Assuming spherical aerosols with a density of 2 g/cm
3
, the number
concentration for 1 µm aerosols is in the order of 3
.
10
7
particles/cm
3
. Based on the theory of
monodispersed agglomeration [5], the number concentration as a function of time is given by
Nt
N
NKt
()=
+
0
0
1
where
N(t) = number concentration at time t
N
0
= number concentration at time 0
K = rate constant = 3.5 10
-10
cm
3
/s (for diameters greater or equal to 1 µm)
t = time in seconds
Assuming an average residence time of about 60 s based on an estimated break flow of 900 kg/h from a
broken tube (about 45 s in the bundle, 10 s in the separator, 10 s in the space between the separator and
dryer), one has:
Nt N() .
=
064
0
Thus, the number concentration drops by about one third in the SG, assuming no other retention
mechanism enters into play. The diameter of the particles is given by
0
3/1
0
0
16.1)()( d
N
N
dtd ×==

NEA/CSNI/R(2009)5
80
Thus, in the course of the 60 seconds, agglomeration would cause an increase of 16 % in the original
diameter. If the flow rate is smaller then the residence time will be increased linearly.
The turbulence-initiated agglomeration can take place in various locations as a result of change in the
geometry, shape of the hardware causing interferences. As an example to the first is the small flow
passages around the tubes in the support plates, which cause contraction and expansion and hence creation
of certain turbulences on the top surface of the support plates, the zigzag shape and the pockets of dryer
panels for the second. The quantification of the effect of turbulence requires detailed coupled analyses of
flow hydrodynamics and the particle tracking, which is still in its research and development phase.
Gravitational settling
Settling velocities as a function of particle diameter is given in Table 3.4-5 below. Even for a large 10 µm
particle, the settling velocity is only 18 cm/min, meaning that gravity settling in the secondary side of a SG
is negligible for a residence time of the order of 1 minute, shown earlier to be the case.
Table 3.4-5 Settling velocities for different AMMD's
AMMD
µm
Settling velocity
cm/min
1 0.21
3 1.8
10 18.3
Thermophoresis
Following an accident with dry SG secondary side, the incoming gas is hot (300 °C - 900 °C) while the
tube structures have temperatures of about 300 °C, thus deposition by thermophoresis is possible. The
thermophoretic velocity depends primarily on the temperature gradient and is a mild function of particle
size [5]. Typical velocity values per unit temperature gradient are given in Table 3.4-6 below.
Table 3.4-6 Thermophoretic velocities per unit temperature gradient
AMMD
µm
Thermophoretic velocity for unit gradient (1 °C/cm)
cm/s
1 1.3 10
-4
3 1.0 10
-4
10 7.8 10
-5
For the purposes of quantifying the possible effect of thermophoretic deposition, the maximum
temperature difference between the gas and the structure can be assumed to be 500°C. Given that the
distance between the flow centreline and the tube wall is 1 cm, the temperature gradient is of the order of
500 °C/cm. Thus the maximum expected thermophoretic velocity is as given in Table 3.4-7 below:

NEA/CSNI/R(2009)5
81
Table 3.4-7 Thermophoretic velocities for expected temperature gradient
AMMD
µm
Thermophoretic velocity
cm/s
1 0.065
3 0.050
10 0.040
Since the residence time in a far-field stage is of the order of 6 seconds (1.1 m height and 0.2 m/s velocity),
one can see from the above table that the horizontal displacement due to thermophoresis is of the order of
0.3 cm in a stage. Given that less than 1 cm separates the flow centreline from the tube wall, it is concluded
that thermophoresis can lead to measurable deposition in dry SG tube rupture conditions.
Aerosol removal in flooded bundle
For accident management purposes, water injection in the dry secondary side may be an option in order to
re-establish heat removal and provide a pool where the incoming aerosols can be scrubbed. The
POSEIDON [6] pool scrubbing experiments conducted by PSI provided a database on the aerosol removal
efficiency of hot pools. The data indicated for example that for a high carrier gas steam fraction (70 %),
and a jet injection regime, the decontamination factor (DF) can be higher than 10 even for a shallow pool
of 0.3 m submergence. In the context of SG tube rupture, the DF can be expected to be even more
significant in view of the high velocity of the jet, the potentially deeper pool, and the presence of dense
structures, which can easily disintegrate the incoming jet into a multitude of smaller bubbles with a greater
potential for scrubbing than regular pools.
The gas-pool interactions can be analysed in three regions:
• The immediate injection zone characterised by the formation of a gas jet or globule depending on
the gas flow rate;
• The break-up zone where the jet or large globule disintegrates into smaller bubbles;
• The bubble rise zone, where individual bubbles rise through the pool stages with a terminal
velocity, and periodically squirt out from the support plate narrow constrictions.
Beyond the break-up zone (typically 10 globule diameters away from the injector), the bubbles are
oblivious of the details of the injection process, and thus the carrier gas injection rate has no effect on
decontamination in the bubble rise zone.
When a jet enters a pool, some of the incoming steam condenses almost instantaneously, with a
corresponding scrubbing of a fraction of the aerosols. The extent of condensation depends on the
temperature of the water pool. If the pool is close to boiling, which is likely in the long term because of the
hot structures and continued steam input, little condensation is to be expected. Hence, the main aerosol
removal mechanisms in the hot pool would be inertial in nature: i.e.
• Jet impaction at the injection point;
• Centrifugal impaction and gravitational settling during bubble rise.
NEA/CSNI/R(2009)5
82
The first mechanism depends on the injection flow rate. This supposes that the jet momentum would be
locally dissipated because of the dense structures as well as the buoyancy of the bubbles. In addition past
experience [6] indicates that the jet is fairly confined near the injection point where most of the removal
takes place.
References
[1] B.Y.H. Liu and J.K. Agarwal, “Experimental Observation of Aerosol Deposition in Turbulent
Flow“, J. Aerosol Sci., Vol. 5, pp. 145-155, 1974
[2] P. Douglas and S. Ilias “On the Deposition of Aerosol Particles on Cylinders in Turbulent Cross
Flow“, J. Aerosol Sci., Vol. 19, No.4, pp. 451-462, 1988
[3] D. Leaver, J. Li, R. Sher “New Design Applications of Natural Aerosol Deposition in Nuclear Plant
Accident Analysis“, OECD-CSNI Meeting, June 1998
[4] Y. Ye and D.Y.H Pui “Particle Deposition in a Tube with and Abrupt Contraction“, J. Aerosol Sci.,
Vol. 21, No.1, pp. 29-40, 1990
[5] W. Hinds Aerosol Technology, John Wiley & Sons, 1982.
[6] A. Dehbi, D. Suckow, S. Güntay The Effect of Liquid Temperature on Pool Scrubbing of Aerosols“,
J. of Aerosol Science, Vol. 28, Suppl. 1 pp. S707-S708, 1997
3.5 Resuspension
3.5.1 Resuspension in primary circuit
Introduction
Particles deposited on the surfaces of the primary coolant circuit may resuspend back to the gas stream.
Such phenomenon can take place, if the removal forces affecting the particles are greater than forces that
adhere them to the surface. Usually resuspension is caused by sudden increase in the gas flow rate. In a
severe accident this may happen, if the rate of steam generation increases for example because of core
quench or relocation of molten material. Also either intentional or accidental depressurization of the circuit
would significantly increase the flow rate. A very high gas flow rate causes particles to resuspend, even if
the flow rate is constant.
Resuspension decreases retention of radionuclides into the circuit. The phenomenon is especially important
in by-pass sequences, in which the radionuclides may be released directly to the environment. In these
sequences the flow rates may also be very high.
ISP-40, which was based on test SR11 of the STORM series, was the first modeling exercise to address
aerosol resuspension in LWR explicitly. The outcome of the exercise was that concerning resuspension
none of the participants succeeded in coming close to the experimental results. There was disagreement
even on which are the important parameters that affect resuspension [1].
Particle adhesion
In order to calculate particle resuspension it would be important to have an estimate of the forces that
bonds particles to the surface. It is known that the most important adhesion force for dry particles is van
der Waals force. Other electrostatic forces also bond particles to the surface, but their effect is much
NEA/CSNI/R(2009)5
83
weaker [2]. If there is liquid material in the deposit, surface tension may become the dominant adhesion
force. In addition to these, sintering and chemical bonding may further increase the strength of the deposit
layer.
In principle it is possible to calculate the strength of the van der Waals force for spherical smooth particles,
when Hamaker constant for the material is known and the deformation of the surfaces has been taken into
consideration. The calculated results have matched atomic force microscope (AFM) measurements closely
[3]. However, the adhesion force is very sensitive to the shape of the particles and to surface roughness.
Experimentally the adhesion force has been observed to decrease by an order of magnitude, when the
roughness of the surface has been increased from 0.2 nm to 0.7 nm [4]. For this reason direct calculation of
the adhesion force is not feasible in reactor safety applications.
In practice adhesion force is always randomly distributed between the particles. Experimentally the
adhesion force distribution of single particles on the surface has been observed to approximately follow a
log-normal distribution. Log-normal approximation has also been used, when particle resuspension both
form monolayer [5, 6] and multilayer [7, 8, 9] deposits has been modeled. It should be noted however, that
the adhesion force distribution of a thick deposit layer has not been directly measured.
In a thick deposit layer the number of contacts between particles should greatly influence the strength of
the adhesion force. The number of contacts increases as the porosity of the deposit decreases.
Experimentally it has been verified that resuspension is much easier from high porosity deposits as from
low porosity deposits formed of the same material. Also the difference between PARESS and STORM
experiments was explained by the difference in porosities between the deposits [8]. According to the study
the main deposition mechanism in PARESS experiments was settling. The resulting deposit layer was
highly porous and easily resuspended. In STORM experiments the deposit was formed by thermophoresis,
which resulted in a much denser and stronger particle layer, because polydisperse aerosol form a stronger
deposit with lower porosity than monodisperse particles. This was shown in a study by Biasi, in which the
results from several experimental series were compared [9]. When modeling resuspension, parameters
affecting the porosity should thus be included. These would include at least the size distribution and the
velocity of the particles depositing on a surface. Hardness of the deposited particles as well as the fraction
of liquid material on the deposit layer would also be parameters, which could be relatively easily included
in the integral codes.
Removal forces
Forces that cause particle resuspension can be divided to lift forces affecting normal to the surface and drag
forces, which tend to move particles parallel to the surface. When the particles are within the viscous
sublayer of turbulent flow, the lift forces should be several orders of magnitude weaker than the adhesion
forces [10]. Drag forces are not only much stronger, but in experiments done with a centrifuge it has been
found out that parallel force required for particle detachment are approximately 1/100 of the required
normal force [11]. Parallel forces need to provide energy only to overcome deformation of particles,
whereas normal forces have to move the particles out of the range of conservative forces.
Therefore, particles have been observed to move on the surface always before they are resuspended to the
gas stream [10]. Because incipient motion on the surface decreases the contact area between particles and
the surface, even a relatively weak lift force may resuspend the particles. Experimental observations also
show that particles detach from surfaces in discrete events, occurring at random intervals. These
observations relate the resuspension to the burst-sweep events taking place in the laminar sublayer of
turbulent flows. First resuspension model by Cleaver and Yates assumed that resuspension depends on the
frequency, force and area of these events [12].
NEA/CSNI/R(2009)5
84
In some studies it has been claimed that only long term resuspension would be related to turbulent bursts.
According to these studies, the rapid resuspension following the increase in the flow rate would be related
to the increase in the average drag force. However, in his experiments Wu showed that even short term
resuspension during the flow acceleration was significantly decreased, when only the large scale
turbulence was dampened [13]. In other studies it was found out that increasing the flow acceleration
increases the resuspension rate in short term but substantially decreases it in the long term. These studies
strongly support the conclusion that short and long term resuspension are based on the same phenomenon
and can not be treated separately.
The diameter of the deposited particles is also an important parameter in many resuspension models. As
evident from studies with monolayer deposits, the flow rate needed to cause resuspension decreases as the
particle size increases. In these experiments the drag force affecting particles increases with their size.
However, particles resuspend as agglomerates from a thick deposit layer. Therefore the primary size of the
particles can not be directly used as a parameter, when resuspension is modeled.
In addition to turbulent gas flow also impaction of particles can cause already deposited aerosol to detach
from the surface. Erosion has been observed to remove particles efficiently from the surface in jet flows
although a pure gas flow did not have the same effect. This was explained by the fact that the momentum
of a particle is approximately three orders of magnitude greater than the momentum of gas with the same
volume [14]. In her experiments Theerachaisupakij found that gas flow containing at least micron sized
particles was substantially more efficient in causing resuspension than pure gas flow. Resuspension from a
pipe surface was enhanced as the size of the impacting particles was increased. Submicron particles did not
increase the resuspension rate [15]. In PSAERO experiments only a small fraction of particles resuspended
from the pipe inlet into pure gas flow. The fraction of resuspended particles increased towards the outlet of
the pipe as the concentration of particles in the flow increased. The mass median diameter of particles in
these experiments was 3 µm and their density was 9 g/cm
3
[16]. Erosion is an especially efficient process,
if the gas flow rate is so high that particles impacting on the surface bounce back to the gas stream.
Whether the particles bounce depends on their size and velocity as well as their elasticity and the angle
with which they hit the surface [17]. Particle erosion is likely to be an important process in a severe
accident. Especially during core relocation the size of the aerosol particles is probably large and their mass
concentration in the gas flow is high.
Resuspension dynamics
The adhesion force distribution of deposited particles changes due to resuspension. The average adhesion
force in a deposit layer tends to increase, because loosely adhered particles are likely to be the first to
resuspend [8, 18, 19]. The increase in the average adhesion force and the discrete random nature of the
turbulent bursts also explains why the resuspension rate measured in a number of studies decreases
exponentially after the flow rate has been increased [1, 7, 16, 20].
A fact receiving less attention is that resuspension is a continuous process in a turbulent flow as particles
are depositing on the surface. Because of resuspension, the adhesion force of a deposit increases as the
flow rate during the deposition phase increases. In PSAERO experiments flow rate during the deposition
phase was a major parameter influencing the resuspension rate. If the flow rate was lower than during the
deposition phase, particles did not significantly resuspend even if the flow was pulsed [16]. Resuspended
particles may also deposit back to the surface in the turbulent flow. When they do, they adhere to the
surface on average more strongly than before resuspension.
The history of the flow rate during the deposition phase as well as the deposition mechanisms influence the
adhesion force distribution. Because of this memory effect, resuspension has to be modeled dynamically.
The state of the deposit on the surface has to be also tracked. In addition to adhesion force distribution, the
NEA/CSNI/R(2009)5
85
model should contain frequency, force and area of the turbulent bursts. Erosion caused by depositing
particles could be calculated using a similar frequency distribution. Most deposition mechanisms are
already adequately modeled for the purpose of predicting resuspension. However, large uncertainties
remain in the estimation of turbulent eddy impaction. Obtaining a realistic model for eddy impaction is
especially important, because the same mechanisms that carry particles to the surface also cause
resuspension.
3.5.2 Resuspension in containment
A large fraction of the fission products released from the reactor cooling circuit into the containment is
bound to aerosol particles. The aerosol concentration is expected to be high in the early phase of an
accident scenario. Later on the aerosol concentration decreases due to sedimentation of aerosols into liquid
pools or onto solid surfaces. Atmospheric air currents inside the containment are able to re-release already
sedimented aerosol material from solid surfaces into the containment atmosphere. This effect is called dry
resuspension. Possible reasons for such heavy air currents can be hydrogen deflagrations or steam
explosions. For the determination of the aerosol source term a detailed balance of the release, the
sedimentation, and the resuspension of aerosols is necessary.
The detachment of the aerosol particles from the surface is a very complicated process that depends on
many unknown parameters. The particles are bound to the surface due to different physical effects that are
gravitational forces, Van-der-Waals forces, and electrostatic forces, if the particles carry a small electrical
net charge. In the presence of humidity liquid bridges retain the particles on the surfaces. In a multilayer
particle bed agglomeration of the particles occurs and a dense particle layer is formed. The aerodynamic
forces that lift the particle up into the atmosphere are very hard to determine. It is agreed in literature that
the air current must be turbulent, if resuspension occurs. It is distinguished between different mechanisms
of resuspension. Erosion describes the steady release of aerosol particles from the surface layer by layer
over a longer period of time, while denudation describes the abrupt release of larger amounts of aerosol
material in a fraction of a second. The latter effect occurs only, when the velocity above the particle bed is
increased suddenly. Further resuspension appears under the impaction of suspended aerosol particles onto
a deposition bed. Important parameters are the wall shear stress of the airflow over the surface and the size
of the aerosol particles deposited. The influences of these parameters define different ranges of the particle
size, in which different adhesive and aerodynamic forces dominate. These influences are theoretically
described by Phillips [21].
Most models describe the resuspension under the condition of a constant airflow over a longer period in
time of at least several minutes and the particles are removed layer by layer on the basis of erosion. Such
conditions are expected during the transport of aerosol in the primary cooling system. In these models the
particle bed is completely submerged in a laminar boundary layer that is damaged by randomly occurring
bursts. Under these bursts aerodynamic forces act on the particles and lift them up into the atmosphere. A
bursting frequency n is assumed that determines how often a burst occurs. The quantity of the removed
aerosol mass under a single burst is gained from a criterion that compares the magnitude of the acting
aerodynamic and adhesive forces. Such force balance models are developed by Fromentin [18], Braaten et
al. [22] and de los Reyes et al. [23] for instance. Reeks [11] has chosen another approach and developed an
energy cumulation model. In this model the particles oscillate on the surface and perform a rolling
movement. With every burst the particle absorbs energy and oscillates with a higher frequency until it
gains enough energy to leave the surface and is entrained by the airflow current. Different versions of such
models have been built into severe accident codes and a benchmark has been performed on ISP40
consisting of a combined deposition and resuspension experiment in the STORM programme (de los Reyes
et al. [1]).
NEA/CSNI/R(2009)5
86
In contrast to the erosion the process of the denudation is very little modelled. It is expected to be the
dominating effect, if an air current lasts only a short period in time. These conditions are fulfilled by
hydrogen deflagrations or steam explosions in the containment. A model on the basis of the resuspension
model of Fromentin was built into the GRS containment code COCOSYS (Nowack et al. [24]). The
advantage of the Fromentin model in comparison to other erosion models is that it describes a multi-layer
particle bed. In the modified version for transient events the aerosol particles are not detached layer by
layer in different time steps, but a single event can resuspend multiple particle layers at once. The strength
of the airflow is only characterised by a maximum velocity and the duration of the current is limited to a
few seconds. These changes better fit the conditions found under transient air currents generated by
hydrogen deflagrations or steam explosions.
References
[1] A. de los Reyes, J.A. Capitão, G.F. De Santi, G.F. International Standard Problem 40 - Aerosol
deposition and resuspension Final comparison report. Joint Research Centre of the European
Communities Report
: EUR 18708 EN, NEA/CSNI/R(99)4, Ispra, February 1999
[2] D.S. Rimal, L.P. Demejo, R.C. Bowen Particle adhesion: Recent advances and current challenges
Mittal Festschrift (eds.) W. J. Van Ooij, Anderson Jr., H. R., p.
161-178, 1998
[3] S. Eichenlaub, C. Chan, S.P. Beaudoin “Hamaker Constants in Integrated Circuit Metalization”
Journal of Colloid and Interface Science 248: 389-397, 2002
[4] Y.I. Rabinovich, J.J. Adler, M.S. Esayanur, A. Ata, R.K. Singh, B.M. Moudgil "Capillary forces
between surfaces with nanoscale roughness" Advances in colloid and interface science 96: 213-230,
2002
[5] M.W. Reeks, J. Reed, D. Hall "On the resuspension of small particles by a turbulent flow” Journal of
Phys. D: Appl. Phys. 21: 574-589, 1988
[6] G. Wen, H.Y.a.K. "On the kinetics of particle reentrainment from surfaces" Journal of Aerosol
Science 20(4): 483-498, 1989A
[7] A. Fromentin "Time dependent particle resuspension from a multi-layer deposit by turbulent flow"
Journal of Aerosol Science 20(8): 911-914, 1989B
[8] H. Friess, G. Yadigaroglu Inclusion of Structural Parameters in the Modeling of Aerosol
Resuspension 3
rd
OECD Specialist Meeting on Nuclear Aerosols in Reactor Safety, 15-18.6.1998,
Cologne, Germany, 1998
[9] L. Biasi, A. de los Reyes, M.W. Reeks, G.F. de Santi “Use of a simple model for the interpretation
of experimental data on particle resuspension in turbulent flows” Journal of Aerosol Science 32:
1175-1200, 2001
[10] A. Ibrahim, R. Brach, P. Dunn "Microparticle detachement from surfaces exposed to turbulent air
flow: microparticle motion after detachement" Journal of Aerosol Science 35: 1189-1204, 2004
[11] M.W. Reeks, D. Hall Kinetic models for particle resuspension in turbulent flows: theory and
measurement In: Journal of Aerosol Science 32, p. 1-31, 2001
[12] J.W. Cleawer, B. Yates “Mechanism of detachement of colloidal particles from a flat substrate in a
turbulent flow” Journal of Colloid Interface Science 44: 464-474, 1973
NEA/CSNI/R(2009)5
87
[13] Y.-L. Wu, C. Davidson, A. Russell “A Stochastic Model for Particle Deposition and Bounceoff”
Aerosol Science and Technology 17(4): 231-244, 1992B
[14] W. John, D.N. Fritter, W. Winklmayr “Resuspension induced by impacting particles” Journal of
Aerosol Science 22: 723-736, 1991
[15] W. Theerachaisupakij, S. Matsusaka, Y. Akashi, H. Masuda. “Reentrainment of deposited particles
by drag and aerosol collision” Journal of Aerosol Science 34: 261-274, 2003
[16] A. Auvinen, J. Jokiniemi, T. Renvall Aerosol Resuspension Experiments in Horizontal SG Tube. EC
Report: SAM-SGTR-D025, VTT Processes report
: PRO3/P9/03, Espoo, February 2003
[17] X. Li, P.F. Dunn, R.M. Brach “Monte Carlo Analysis of Polydisperse Microparticle Impacts with
Surfaces” Aerosol Science and Technology 33(4): 376-385, 2000
[18] A. Fromentin Particle Resuspension from a Multi-Layer Deposit by Turbulent Flow Paul Scherrer
Institut (PSI 38), 1989
[19] S. Matsusaka, H. Masuda “Adhesive strength distribution of particles deposited on a wall surface”
Journal of Aerosol Science 32 S1: S937-S938, 2001
[20] H.Y. Wen, G. Kasper, R. Udischas “Short and long term particle release from surfaces under the
influence of gas flow” Journal of Aerosol Science 20(8): 923-926, 1989B
[21] M. Phillips A force balance model for particle entrainment into a fluid stream In: Journal of Physics
D: Applied Physics 13, p. 221–233, 1980
[22] D.A. Braaten, U.K.T. Paw, R.H. Shaw Particle resuspension in a turbulent boundary layer-observed
and modelled In: Journal of Aerosol Science 21, No. 5, S. 613–628, 1990
[23] A. de los Reyes, E. Hontañón, R. Arias, J.A. Capitão The CÆSAR model for particle resuspension
in turbulent flows In: Journal of Aerosol Science 28 Suppl. 1 (1997), p. 327-328, 1997
[24] H. Nowack, M. Dapper, H.-J. Allelein, M.K. Koch Aerosol resuspension phenomena in the
containment In: Annual Meeting on Nuclear Technology, Aachen, 2006
3.6 Pool Scrubbing
Scenario description and characterisation
Pool scrubbing or wet scrubbing is the removal of aerosol particles in gas bubbles rising in a water pool.
The pool thus acts as a filter. Pool scrubbing has applications in various industrial fields where aerosol
particle laden gas cleaning is required. The following deals only with aerosols scrubbing; vapor scrubbing
is out of its scope.
Pool scrubbing is a very relevant issue in the nuclear safety since it provides a means to reduce source term
to the environment during hypothetical severe accidents. Several severe accident scenarios involve the
transport paths of fission product aerosols which include passages through stagnant pools of water where
pool scrubbing can occur. In Boiling Water Reactors (BWR’s) pressure suppression pools (“wetwell”), are
such pools although they are primarily designed to avoid over pressurization of the wetwell space. Pool
scrubbing in such pools has been given credit as an engineering safety feature capable of mitigating the
source term and hence associated risk posed by accidents. Nonetheless, the pool scrubbing scenario is not

NEA/CSNI/R(2009)5
88
BWR specific. Some Pressurised Water Reactor (PWR) sequences may also involve transport paths where
pool scrubbing can occur. As an example: A V-Sequence, involving release of radioactivity through safety
injection piping (either due to a break or malfunctioning check valves) directly into a tank containing
water located in the auxiliary building. Fission products can be scrubbed if the transport path involves a
full pressuriser and a stuck open safety relieve valve. During Steam Generator Tube Rupture (SGTR)
accidents concurrent with the stuck-open safety relief valve, a good potential for aerosol scrubbing is
provided if the secondary side is filled with water. Another scenario common to any type of reactor is a
severe accident with vessel breach in which the molten material falls into the reactor pit or drywell and
attacks concrete. Corium concrete interaction causes release of medium and low volatile fission products as
well as the production of large amounts of concrete aerosols. The gas generated in the interaction will
transport the aerosol particles. If the corium is overlaid by a water pool with a certain height it the latter
also acts as an aerosol scrubber which attenuates the aerosol particle release to the containment
atmosphere. Containment venting filter systems employing water pools utilise also the pool scrubbing to
reduce the activity level out of a containment below limits defined by the regulatory bodies.
Several fundamental processes take place during aerosol pool scrubbing: diffusiophoresis, thermophoresis,
inertial impaction at the nearby of gas injection, gravity settling, centrifugal deposition and diffusion
during bubbles rise, Brownian diffusion, etc. Aerosol characteristics, i.e., size, hygroscopicity, etc, are the
key factors for the effectiveness of these removal processes. Gas hydrodynamics plays an essential role
determining key variables for pool scrubbing such as bubbles size and surface/volume ratio. In addition,
other parameters like pool depth water sub-cooling, carrier gas composition and temperature and velocity,
injection mode, water composition, etc., heavily influence individual pool scrubbing processes. In
Table 3.6-1 and Table 3.6-2 the ranges of some of these key variables during relevant severe accident
sequences [1, 2] are shown.
Table 3.6-1 Pool scrubbing boundary conditions in BWRs
Sequence
Particle
AMMD (µm)
Submergence
(m)
Injection
velocity
(cm/s)
Mass %
of steam
Temperature
SBO HP-ST
< 3
(“Quencher”)
0.2 – 1.5
(downcomer)
2 – 5
(“Quencher”)
1
(downcomer)
25-3000 /
1-15
10-97
subcooled pool
SBO HP-LT 25-3000
SBO LP-ST 3000-9000
SBO LP-LT 100-25000 / 1-15

NEA/CSNI/R(2009)5
89
Table 3.6-2 Pool scrubbing boundary conditions in PWRs
Sequence
Particle
AMMD (µm)
Submergence
(m)
Injection
velocity
(cm/s)
Mass %
of steam
Temperature
SGTR --- < 12 40 – 5000 10-90 saturated
RHR 0.75 – 2 100 - 250 3 - 97 saturated
Traditionally, the scrubbing efficiency has been expressed in terms of a Decontamination Factor (DF),
which is defined by the ratio of the aerosol mass flow rate entering (m
in
) and the leaving (m
out
) the pool:
out
in
m
m
DF =
Based on the different nature of hydrodynamic- and aerosol phenomena, the path of aerosols along the pool
height is usually split into three regions [3]: injection, rise and pool surface. Consistently, the overall
Decontamination Factor is a multiplication of individual Dfs of the three regions of the pool:
surriseinj
DFDFDFDF
⋅
⋅
=
The injection and surface decontamination processes are considered instantaneous whereas it is assumed
that several continuous aerosol scrubbing mechanisms are active during bubble rise which can be described
by:
sur
rise
n
A
ninj
DF
u
S
dA)r(v
V
1
expDFDF ⋅
⋅
∑
⋅
∫
⋅=
The depletion velocity of each individual mechanism is represented by v
n
and the time of the bubble in the
rise zone is the ratio of water height (S, submergence) and the bubble rise velocity (u
b
).
Injection zone
At the injection zone in the pool, the mechanical as well as the thermal gas-liquid interaction determine the
scrubbing process.
The gas injection velocity is a key variable in this region. The inlet gas regime is usually classified
according to the non-dimensional Weber number:
σ
vDρ
We
2
injinj
⋅⋅
=
l
as either jet regime (We≥10
5
) or globule regime (We<10
5
). Under the jet regime a steady jet cone attached
to the injection orifice is formed. Inside the cone a transition from pure gas flow to a churn-turbulent
two-phase flow occurs. Intermediated steps in the transition are the bubbly flow and entrained droplet flow.
Aerosol impaction on liquid surfaces, either at the cone gas-liquid interface or at surfaces of entrained

NEA/CSNI/R(2009)5
90
droplets, can effectively remove particles from the incoming gas flow. At moderate or low gas velocities
characterising the globule regime, other depletion mechanisms such as diffusion, sedimentation and
centrifugal deposition could become important. The latter process accounts for the removal of big particles
which cannot follow internal gas streamlines and eventually strike the gas-pool surface. Primary bubble
oscillations would also enhance aerosol scrubbing. In Fig. 3.6-1 [4] the globule (bubble) and jet regimes
for various relevant accident sequences as characterised by a Weber number range are displayed.
Fig. 3.6-1 Weber range of relevant accident sequences
The thermal interaction between gas and liquid is determined by the temperature difference between both
phases and by the gas composition as well. Any temperature difference between gas and water will initiate
heat exchange. In the case where gas is hotter than water, particles would be carried to the gas-water
interface by thermophoresis. If the gas contains steam and the water temperature is at lower than the
saturation temperature the mass transfer as a result of condensation will initiate aerosol removal by
diffusiophoresis.
Bubble rise zone
As in the injection zone, the bubble hydrodynamics is closely linked to the scrubbing efficiency. The
primary bubble is usually not stable and splits to form a swarm of smaller bubbles. Gas dynamics is quite
intense during the bubble rise and a combination of many processes defining bubble size and the
distribution will occur. Bubble splitting, growth by vapor flux into the bubble (by hydrostatic pressure
decrease) and coalescence coexist. Some key hydrodynamic variables in the aerosol scrubbing are the
bubble size distribution and shape and the rising velocity. Small bubbles are usually spherical (i.e., the
largest surface-to-volume ratio), which enhances decontamination. However, larger bubbles, either
ellipsoidal or cap-shaped, can become more easily deformed, which also contributes to aerosol removal.
The bubble residence time (i.e., S/u
rise
) or gas holdup ultimately determines the final aerosol mass being
removed.
Regardless of the shape of the bubbles the major pool scrubbing mechanisms are the diffusion,
sedimentation and centrifugal deposition. The combined action of these mechanisms would lead to a
minimum of decontamination efficiency at particle aerodynamic diameters around 0.1 µm. In addition to
the main aerosol removal processes, change in the particle size directly affects the pool scrubbing.
Particles could grow, if the conditions prevail, because of agglomeration and/or steam condensation and/or
hygroscopicity. Agglomeration can be ignored due to short bubble residence time. The effect of
condensation becomes more significant if the particles are hygroscopic. Until the bubbles reach a thermal
JET BUBBLE
NEA/CSNI/R(2009)5
91
equilibrium and depending on the steam content, and the temperature gradient diffusiophoresis and
thermophoresis could contribute to the aerosol depletion process during bubble rise.
Pool surface zone
At the pool surface bubbles rupture causing production of many micro-droplets (from the fragmented
bubble skin). Some of these droplets can be entrained by the gas flow and the others fall back due to their
size by the gravity. These entrained droplets transport the very fine aerosol particles as well as dissolved
fission products and hence cause accumulation of the activity in the gas space. The amount of droplet
entrainment depends primarily on the bubble size distribution reaching the water surface and the gas
velocity.
In addition a minor experimental programme was intended to assess the effect of water impurities in the
pool scrubbing process [3].
Major outcome of most recent investigations
• On theoretical basis, independent investigations have shown that decontamination by bubble
formation and equilibration in a water pool can be significant, both in BWR’s and PWR’s risk
relevant sequences. Under such scenarios carrier gas composition and flow rate are the key
variables determining the decontamination efficiency. For shallow pools, the relative significance
of the bubble formation and equilibration processes in determining the decontamination can be
even larger than that by the decontamination process during the bubble rise through the pool
height.
•
A peer review of hydrodynamic models in different codes showed that they are remarkably
different in both their bases and results. Given their significance in decontamination, bubble size
and shape are particularly relevant. No less important, several hydrodynamic phenomena are
missing in codes despite they could notably influence particle retention: jet injection, primary
bubble rupture, churn-turbulent flow and bubble oscillations and deformations.
•
The DF displays an inverted Gaussian type of trend as a function of particle diameter with a
minimum at about 0.1 µm.
•
Uncertainties in the particle size distribution at the inlet can largely influence DF estimates. The
effect of pool scrubbing on the particle size distribution is narrowing towards the particle size
yielding the minimum scrubbing efficiency.
•
Experiments under different conditions have confirmed that steam condensation at the injection
point, particle size, carrier gas flow rate and composition affect significantly the DF, even under
hot conditions.
•
DF increases smoothly and exponentially with submergence. Increased gas residence time
through the pool efficiently raises the DF.
•
The decontamination factor of hot water pools is notably larger than 1, a value which was
assumed in the past safety studies evaluating the source term from BWRs. This is the case even
for small sizes of aerosols with AMMD’s on the order 0.2-0.3 µm.

NEA/CSNI/R(2009)5
92
References
[1] D.A. Powers, J.L. Sprung A Simplified Model of Aerosol Scrubbing by a Water Pool Overlying
Core Debris Interacting with Concrete NUREG/CR-5901, SAND92-1422, 1993
[2] R.M. Bilbao, J.M. Fernández-Salgado, J.A. Fernández-Benítez, A. Alonso-Santos, J.V. López-
Montero Severe Accident Phenomenology in BWRs and the Role of PHÉBUS-FP. EUR 15297 EN,
1993
[3] K. Fischer Modelling of Retention Processes in Water Pools Battelle Ingenieurtechnik, December 1998
[4] V. Peyrés, L.E. Herranz Programa de Investigación SAC-PS: Influencia de sustancias
Contaminantes en la Retención de Aerosoles en Lechos Acuosos. DFN/SN-06/SP-00, 2000
3.7 Re-Entrainment
This chapter describes the re-entrainment process in general, its occurrence in reactor accidents, and the
status of analytical and experimental work. Actually re-entrainment processes are modelled in accident
codes in a very incomplete way. Proposals are made to reduce this deficit.
Re-entrainment process
When gas is flowing through a pool, droplets are formed at the pool surface and transported with the rising
gas flow into the atmosphere. Together with the droplets soluble and insoluble fission products are released
in aerosol form to the atmosphere. This process is called re-entrainment or wet resuspension because the
released material comes in general from aerosols deposited earlier.
Droplet generation depends essentially on the superficial velocity of the gas flow through the pool. At low
superficial velocities the gas flow consists of single bubbles rising through the pool (bubbly flow) and
bursting at the surface. Each bursting bubble produces several hundred small so-called film droplets and a
small number of larger so-called jet droplets.
At high superficial velocities bubbles of different sizes and shapes rise in a turbulent way (churn turbulent
flow). Droplet formation results from a direct momentum exchange between gas flow and liquid. Hollow
columns of liquid, whose upper part rapidly disintegrates into droplets due to surface tension, erupt at the
pool surface.
Under the accident conditions in a boiling reactor sump the transition from bubbly to churn turbulent flow
occurs at a superficial gas velocity of some cm/s. At this transition the droplet formation process changes
fundamentally. Therefore different models are required for each regime.
The re-entrainment
E is the ratio of the liquid (droplet) mass flux
l
m
&
to the gas mass flux
g
m
&
rising
through the pool surface. It can also be defined in terms of the density
ρ
and the superficial velocity
j
for
the liquid and the gaseous phases:
gg
ll
g
l
j
j
m
m
E
⋅
⋅
==
ρ
ρ
&
&
(Eq. 1)

NEA/CSNI/R(2009)5
93
For bubbly and turbulent flows the re-entrainment increases with an increasing gas velocity. Additionally a
strong dependence of
E on the bubble size exists for the bubbly flow regime. The re-entrainment is much
larger with small gas bubbles than with large ones.
Re-entrainment processes in reactor accidents
In a reactor accident re-entrainment processes can occur in the circuit and the containment at different
pools and in different accident phases (Table 3.7-1).
Fission product (FP) re-entrainment takes place on boiling sumps in PWR as well as BWR core melt
scenarios. Sumps can boil in case of an extreme decay heat release, or at contact with core melt. Another
case is sump flashing during rapid containment depressurization as consequence of a containment leak.
With controlled venting the pressure transient is smaller and re-entrainment will be reduced. Venting filters
may be loaded additionally by the released aerosol and its decay heat.
Moreover, all pool scrubbing processes, e.g. in a BWR suppression system, are accompanied by
re-entrainment phenomena. On the one hand aerosol particles are efficiently scrubbed by the pool water
but on the other hand a fraction of the aerosol material retained is re-entrained. Similar re-entrainment
processes occur in the suppression systems of the Russian-type reactors WWER-440/213 and RBMK 1000
and 1500.
Re-entrainment also occurs in core melt pools agitated by rising gases from the molten core concrete
interactions (H
2
O, H
2,
, CO
2
, CO, etc.). Together with the melt droplets non-volatile fission products are
released.
A discussed accident management strategy is to cool the spread melt by a water layer on top. However, the
decay heat of the melt can make the water boil which causes re-entrainment.
Table 3.7-1 Re-Entrainment processes in LWR accidents
Reactor type Design basis and degraded core
accidents
Core melt accidents
PWR • RPV during LOCA, core partly
dried out
• Boiling sump by FP heat release
• Pressuriser and pressuriser
relief tank at pressuriser leak
• Boiling sump at venting
• Steam generator pipe break • Flashing Sump at containment
leak
• Core melt agitated by gas
• Water on top of core melt pool
(EPR)
WWER-440 • Wet condenser during LOCA
BWR • Discharge into suppression
pool
• Boiling sump due to FP heat
release
• PPV during LOCA • Core melt agitated by gas
RBMK • Accident localisation system at
LOCA

NEA/CSNI/R(2009)5
94
The aerosol and fission product release rates by re-entrainment are relatively small compared to those of
other aerosol generation mechanisms, e.g. by evaporation/condensation processes during the core melt
down. Nevertheless re-entrainment can contribute significantly to the radioactive source term in the late
accident phase because the process is long lasting. At that time aerosols from other sources have already
been depleted to a large extent.
Modelling
In all accident codes re-entrainment is modelled in a very incomplete way as summarised in Table 3.7-2.
Very simple approaches which cannot describe this complex process sufficiently, e.g. constant re-
entrainment rates, are not considered in the table.
Table 3.7-2 Re-entrainment processes modelled in accident codes
Accident codes Re-entrainment model for
Boiling or
flashing sump
Suppression pool
with pool
scrubbing
Agitated core
melt pool
Containment
codes
COCOSYS no yes no
CONTAIN no no yes
Integral
codes
ASTEC no yes no
MAAP for iodine only no no
MELCOR no no yes
Re-entrainment from boiling or flashing sumps, the most important process in source term analyses, is
modelled only in MAAP and for iodine species only. In MAAP the re-entrainment of iodine droplets (CsI,
IO
3
-
, HOI) for bubbly flows is calculated by the oscillation model of Azbel [1]. For churn turbulent flows
the semi-mechanistic correlations of Rozen and Kataoka-Ishii are applied [2]. The Rozen correlation is
used with low superficial velocities. It delivers a higher re-entrainment than the correlation of
Kataoka-Ishii [3].
In COCOSYS [4] and ASTEC [5] as well as in the circuit code ATHLET-CD re-entrainment is only
treated in connexion with pool scrubbing. Re-entrainment is calculated by the module RECOM [6] coupled
to the pool scrubbing model SPARC [7]. RECOM uses an oscillation model with critical lamina thickness
based on Azbel. For the jet droplet re-entrainment, results of the highly mechanistic code RESUS are taken
[6]. RESUS solves the Navier-Stokes equations numerically by use of a finite difference approach. The
calculated number and size of the jet droplet is used in RECOM. In the churn turbulent flow regime the
re-entrainment is calculated by Kataoka-Ishii. For film droplets and the droplets generated under churn
turbulent flow conditions the droplet size distribution has to be given in the input.
In CONTAIN re-entrainment is modelled only for core melt pools [8]. In the module CORCON/VANESA
the Azbel model is used for bubbly flow regime and the Kataoka-Ishii correlation for the churn turbulent
flow regime [9]. The same applies to MELCOR [10] which also uses CORCON.
With all accident codes the re-entrainment from water as well as core melt pools is calculated by the
oscillation model of Azbel for bubbly flows and by the correlation of Kataoka-Ishii for churn turbulent
NEA/CSNI/R(2009)5
95
flows. Only in MAAP the correlation of Rozen for low velocities in the churn turbulent flow regime is
applied additionally [11]. Only in the module RECOM used in COCOSYS, ASTEC and ATHLET-CD the
jet droplet formation is explicitly treated. Some of the correlations have been modified compared to the
original versions.
Especially the re-entrainment models for boiling water pools need several improvements concerning the
following items:
−
Film droplet formation and dependence on bubble size distribution
−
Enrichment of insoluble material in re-entrained droplets
−
Re-entrainment spike at onset of boiling
−
Size distribution of re-entrained droplets
Conclusions
During a severe accident in a PWR or a BWR re-entrainment of fission products can occur at several water
and core melt pools. The release rates are relatively small but the sources are long lasting. Thus a
significant contribution to the source term by re-entrainment is likely in the late accident phase. However,
thereto no recent analytical investigations are available. One reason is the very incomplete modelling of
re-entrainment processes in accident codes.
Out of five codes only one is able to simulate the FP release from boiling or flashing sumps. In general
re-entrainment is modelled in the bubbly flow regime based on the oscillation model of Azbel and in the
turbulent flow regime by the semi-mechanistic correlation of Kataoka-Ishii. The largest uncertainties come
from the film droplet generation model and especially from the uncertain assumptions for the bubble size
distribution. Only in RECOM the jet droplet generation is explicitly considered. Only in a few experiments
(REST, REVENT, and ThAI re-entrainment tests) re-entrainment has been investigated under LWR
accident typical conditions.
References
[1] D. Azbel and A.L. Liapis Mechanisms of Liquid Entrainment Handbook of Fluids in Motion Ann
Abbor Science, Michigan (1983)
[2] I. Kataoka and M. Ishii Mechanistic Modelling of Pool Entrainment Phenomenon Int. J. Heat Mass
Tranfer, Vol. 27, No. 11, pp 1999 – 2014 (1984)
[3] T. Ginsberg Aerosol Generation by Liquid Breakup Resulting from Sparging of Molten Pools of
Corium by Gases Released During Core/Concrete Interactions Nucl. Sci. and Eng.: 89, 36 – 48
(1985)
[4] W. Klein-Heßling, S. Arndt, G. Weber COCOSYS V 1.2 User Manual GRS-P-3/1 (July 2000)
[5] F. Jacq, H.-J. Allelein ASTEC V0. 2 General Overview, Rev. 0 ASTEC-V0 /DOC/99-09 (April
2000)
[6] M.K. Koch et al. Radionuclide Re-entrainment at Bubbling Water Pool Surfaces J. Aerosol Sci.
Vol. 31, No. 9, pp 1015 – 1028 (2000)
NEA/CSNI/R(2009)5
96
[7] P.C. Owczarski, K.W. Burk SPARC-90: A Code for Calculating Fission Product Capture in
Suppression Pools NUREG/CR – 5765 (1991)
[8] K.K. Murata et al. Code Manual for CONTAIN 2.0: A Computer Code for Nuclear Reactor
Containment Analysis Sandia National Laboratories NUREG/CR-6533 (1997)
[9] D.R. Bradley et al. CORCON-MOD3: An Integrated Computer Model for Analysis of Molten Core-
Concrete Interactions NUREG/CR-5843 (1993)
[10] R.O. Gauntt et al. MELCOR Computer Code Manuals Vol. 1: Users' Guide for Version 1.8.5
NUREG/CR-6119 Rev.2 (2000)
[11] D.L.Y. Louie and D.J. Osetek MAAP-IMPAIR Interface for Analysis of Iodine Behaviour in
Advanced Reactor Accidents (Phase II) DOE/ID-10466 (March 1944)
3.8 Aerosol Formation during High Pressure Melt Expulsion from the Reactor Coolant System
The accident at Three Mile Island demonstrated that substantial core degradation and core debris relocation
to the lower head of the pressure vessel could occur while the reactor coolant system remained at elevated
pressure. Prior reactor accident analyses had assumed that depressurization would occur early in the course
of an accident, perhaps as part of the accident initiating event. The Three Mile Island accident raised the
possibility that molten core debris could penetrate a pressurised reactor vessel and be dispersed throughout
the containment.
Safety concerns associated with the pressurised expulsion of core debris from the reactor vessel focused on
issues of containment integrity. Initial concerns were that dispersed debris could heat the atmosphere to the
point containments failed by overpressure. This is the so-called “direct containment heating” scenario.
Further investigations suggested melt expulsion and dispersal might trigger hydrogen combustion events
that threatened containment integrity. These concerns prompted several experimental investigations. A
cross section of the multinational experimental efforts is reported in a CSNI state of the art report [1].
Following preparation of this state of the art report, several scaled tests were undertaken to support
analyses of the containment threats [2]. To a significant extent the concerns over prompt containment
failure associated with pressurised expulsion of core debris have been resolved favorably for large dry and
subatmospheric containments [3].
Though investigations of high pressure melt expulsion and direct containment heating were focused on the
containment loads, there were some early efforts to examine aerosol production associated with the
expulsion and dispersion processes [4, 5]. A sequence of frames from an open air test of high pressure melt
expulsion is shown in Fig. 3.8-1.
It is apparent that a very large amount of aerosol is produced. Efforts were made to identify aerosol
formation mechanisms and to characterise the aerosol produced in tests contained within the Surtsey test
facility (a 110 m
3
containment vessel). As might well be expected, all of the tests were done with simulant
materials rather than real core debris. Usually the simulants were mixtures of molten iron and aluminum
oxide produced by a thermitic reaction within a vessel pressurised with nitrogen or steam. Consequently, it
is not readily apparent how applicable the aerosol characterization results are to the analysis of reactor
accidents. It is thought that the aerosol formation mechanisms are, at least, qualitatively applicable.

NEA/CSNI/R(2009)5
97
Fig. 3.8-1 Open air test of melt expulsion from a vessel pressurised to 41.3 bar with nitrogen
Three mechanisms of aerosol formation were identified:
•
Vaporization from surfaces of high temperature melts,
•
Droplet formation by the effervescence of gas from the melt as it emerges from the pressurised
vessel, and
•
Comminution of melt droplets as the impact surfaces within containment models.
The three mechanisms produce characteristically different aerosol particles. Examples of these particles
are shown in Fig. 3.8-2. Vapors evolving from the high temperature melt rapidly transport to cooler
environments where they nucleate extremely fine primary particles. More detailed views of these fine
aerosol particles are provided in Fig. 3.8-3 and Fig. 3.8-4. It is suspected that the cooling of the vapor is so
fast and supersaturations so high that homogeneous nucleation is a predominant path for vapor
condensation rather than condensation on either structural surfaces or surfaces of mechanically produced
particles. There also appears to be a tendency for the primary particles to coagulate in chains and these
chains either fold or agglomerate to form very low density particles.
The second mechanism of aerosol production arises because gases including steam and hydrogen are
soluble at high pressure in molten materials. When the melt emerges from the pressure vessel, the
solubility drops dramatically and bubbles nucleate in the melt. Frid demonstrated using x-rays to monitor
the melt as it emerged from the pressure vessel that gas effervescence was sufficient to completely disrupt
the stream of melt emerging from the pressure vessel. As each bubble bursts at the surface of the melt it

NEA/CSNI/R(2009)5
98
cases off droplets in the size range of a few microns. These droplets are small enough that they remain
airborne until they have cooled to solidify as very nearly spherical particles.
Fig. 3.8-2 Examples of the qualitatively different types of aerosol produce in a high pressure melt
expulsion event
Fig. 3.8-3 Electron micrograph of very fine aeosols produced by vapor nucleation during a high
pressure melt expulsion experiment

NEA/CSNI/R(2009)5
99
Fig. 3.8-4 Electron micrograph of fine aerosols produced by vapor nucleation during a high
pressure melt expulsion experiment. Note the apparent tendency to form chain
agglomerates
Larger particles (10-100 µm) are produced by a combination of aspiration and comminution. As melt is
expelled from a pressure vessel, the hole in the pressure vessel enlarges. Part way through the expulsion
process, the hole is enlarged to the point that the pressurizing gas penetrates the liquid pool and two phase
expulsion takes place. The high velocity gas entrains melt droplets. Furthermore, gas also entrains melt
previously expelled from the vessel. Droplets accelerated in the gas phase disintegrate until a critical
Weber number of about 12 is reached. Further distintegration of the melt droplets can occur as they impact
surfaces at very high velocities.
About 1 % of the melt mass expelled from a pressurised vessel is thought to be converted to aerosol. This
can produce a substantial aerosol loading of the containment atmosphere. But, if the aerosol production is
not coincident with containment failure, the aerosol rapidly agglomerates and sediments so it may not
contribute significantly to the risk associated with reactor accidents.
Following resolution of concerns about the containment loads produced by pressurised melt ejection, little
effort has been devoted to further characterizing the associated aerosol production. Interest has been further
attenuated as accident management measures have been introduced to depressurise reactor coolant systems
during accidents involving core degradation. Most accident analysis codes do not include models of
aerosol formation associated with core debris expulsion from the reactor coolant system.
References
[1] Fauske and Associates and Sandia National Laboratories, State-of-the-Art Report (SOAR) on HPME
and DCH, OECD, 1996

NEA/CSNI/R(2009)5
100
[2] T.K. Blanchat, M.M. Pilch, M.D. Allen, Experiments to Investigate Direct Containment Heating
Phenomena with Scaled Models of the Calvert Cliffs Nuclear Power Plant, NUREG/CR-6469,
Sandia National Laboratories, Albuquerque, NM, January 1997, and references therein
[3] M.M. Pilch, M.D. Allen, B.W. Spencer, K.D. Bergeron, K.S. Quick, D.L. Knudson, E.L. Tadios,
and D.W. Stamps, The Probability of Containment Failure by Direct Containment Heating in Surry,
NUREG/CR-6109, Sandia National Laobratories, Argonne National Laboratory, Idaho National
Engineering Laboratory, May 1995, and references therein
[4] J.E. Brockmann and W.W. Tarbell, Nuclear Science and Engineering, 88 (1984)342
[5] J.E. Brockmann, Progress in Nuclear Energy, 19 (1987) 478
3.9 Aerosols from MCCI
An important source of aerosol input to reactor containment during an unarrested severe reactor accident
comes from the interactions of core debris with structural concrete. Classic reactor accident sequences
envisage a point at which core debris will penetrate the reactor pressure vessel and fall into the reactor
cavity (see Fig. 3.9-1). The core debris will be a mixture of molten uranium dioxide fuel, zirconium
dioxide and zirconium metal from the fuel cladding, structural steel and fission products. Much of the core
debris will be molten when it penetrates the reactor pressure vessel. If the core debris is not quenched as it
emerges from the vessel, it will thermally attack the structural concrete in the reactor cavity. If the core
debris is quenched but the quenched debris is not coolable, core debris will reheat and eventually become
hot enough to thermally attack the concrete.
Fig. 3.9-1 Photograph of a high temperature melt interacting with calcareous concrete and the
associated aerosol production

NEA/CSNI/R(2009)5
101
Aerosol production comes about during core debris interactions with concrete because the core debris is
sufficiently hot to produce significant vapor pressures of some core debris constituents and the constituents
of ablated and melted concrete. Aerosol production can become significant (see Fig. 3.9-2.) because the
gaseous products of concrete decomposition sparge through the core debris. Three mechanisms are usually
considered in the analysis of aerosol production during core debris interactions with concrete [1]:
•
vaporization from the free, upper surface of core debris,
•
vaporization into gas bubbles sparging through molten core debris, and
•
mechanical aerosol production when bubbles burst at the surface of molten core debris.
Time after start of core debris/concrete interactions (min)
0 50 100 150 200 250 300
Aerosol Source Rate (g/s)
0
200
400
600
800
1000
1200
REACTOR TYPE concrete
BWR calcareous
PWR calcareous
PWR siliceous
Fig. 3.9-2 Comparison of predicted aerosol production rates during core debris interactions with
concrete at different reactors with various concretes
The first of these mechanisms is usually found to be small in comparison to the second if the core debris is
molten.
Concretes used in the structural elements of nuclear power plants are typically classed as either calcareous
concretes that use limestone (CaCO
3
) or dolomite (CaMg(CO
3
)
2
) as aggregate or siliceous concretes that
use basalt, granite or other silica-rich materials largely free of carbonates as aggregate. Chemical
compositions of three representative types of concrete found in nuclear power plants [2] are shown in
Table 3.9-1. Clearly, the distinction between calcareous and siliceous concretes is the large amounts of
carbon dioxide that can be liberated in the thermal decomposition of calcareous concretes. The other
gaseous product of concrete decomposition is water vapor. All concretes have a significant amount of
water vapor. About half the water (often called 'free water') is present in the concrete as water in the pore
structure of concrete and water of crystallization. The rest of the water (bound water) in the concrete is in
the form of calcium hydroxide (Ca(OH)
2
) which is the binding agent that holds together the aggregate. At
sufficiently high temperature, this calcium hydroxide decomposes to produce calcium oxide and water

NEA/CSNI/R(2009)5
102
vapor. Temperature ranges over which the various gaseous concrete decomposition products are released
are [3]:
•
Free water: ambient to 230 °C
•
Bound water: 300 to 450 °C
•
Carbon dioxide: 600 to 1100 °C
Table 3.9-1 Chemical compositions of some representative concretes at nuclear power plants
2
Chemical
Constituent
Mildly Siliceous
Concrete*
(weight %)
Calcareous
Concrete
(weight %)
Limestone/
Common Sand Concrete
(weight %)
SiO
2
54.7 3.6 35.7
CaO 8.8 45.4 31.2
Al
2
O
3
8.3 1.6 3.6
MgO 6.2 5.67 0.5
Fe
2
O
3
6.2 1.2 1.4
K
2
O
5.4 0.7 1.2
TiO
2
1.0 0.15 0.2
Na
2
O
1.8 0.08 0.8
MnO 0.4 0.01 0.03
Cr
2
O
3
0.2 0.004 0.014
H
2
O
5.0 4.1 4.8
CO
2
1.5 35.7 22.0
* Siliceous aggregates are quite variable in composition and may contain much higher concentrations
of silicon dioxide than basaltic aggregate.
Siliceous concretes melt at temperatures somewhat above 1100 °C and calcareous concretes melt at
temperatures from 1200 to 1600 °C. During thermal attack on concrete, there are fronts of gas generation
propagating through the concrete ahead of the ablating interface between concrete and the core debris.
The gases liberated from the concrete are observed to pass relatively easily through substantial heads of
molten core debris. The oxidizing gases from the concrete, CO
2
and H
2
O, react with the metallic
constituents of core debris, predominantly Zr and Fe, to form CO and H
2
. The very exothermic reaction of
the oxidizing gases with zirconium metal in the core debris can be a significant source of heat that sustains
2
Note that in addition to these chemical constituents of concrete, structural concrete at nuclear power plants contains about
0.25 g/cm
3
reinforcing steel which is mostly iron

NEA/CSNI/R(2009)5
103
high temperatures for protracted periods in the core debris. Such high temperatures, as well as the reactive
nature of the gases mean that constituents of the melt will vaporise into the bubbles of gas sparging
through the liquid. When these vapor-ladden bubbles escape the core debris, the vapors are released into a
cooler environment and they condense to form aerosol particles.
Gases sparging through the core debris at sufficiently high velocities can entrain molten material in the
form of droplets [4] that have dimensions small enough to be considered aerosol (< 20 µm). At lower gas
generation rates, gases sparging through the core debris emerge as bubbles that burst at the surface. The
bursting of these bubbles imparts very high accelerations to the liquid films (~10.000 g). Such high
accelerations can launch small liquid droplets into the gas flow as drinkers of carbonated beverages well
know.
Aerosol production during core debris interactions with concrete, then, depends on the composition of the
core debris, especially the zirconium metal content, and the amount of gas that can be produced by the
thermal decomposition of the concrete. Comparisons of the aerosol production rates predicted to occur in
reactor accidents of different types are shown in Fig. 3.9-3. The highest aerosol production rates occur
soon after core debris accumulates in the reactor cavity. The greatest production of aerosol occurs in the
case of the boiling water reactor with calcarous concrete. Aerosol production is extremely high in this type
of accident because of the large inventory of zirconium metal in a boiling water reactor much of which is
not oxidised at the time core debris penetrates the reactor vessel.
fp fuel+structural concrete
0
1000
2000
3000
4000
5000
fission products
fuel & structures
concrete
Fig. 3.9-3 Sources of aerosolised materials during core debris interactions with concrete [in kg]

NEA/CSNI/R(2009)5
104
Without this large inventory of zirconium metal in the core debris, aerosol production predicted for an
accident at a pressurised water reactor with calcareous concrete is much attenuated though still significant.
Aerosol production when pressurised water reactor core debris interacts with siliceous concrete is smaller
still.
Aerosol production is persistent during core debris interactions with concrete. Even after the core debris
has solidified, temperatures are sufficiently high that concrete decompositions continues and the gaseous
products of decomposition sweep vapors of the more volatile species into cooler environments where they
condense to form aerosol particles.
Much of the aerosol produced during core debris interactions with concrete is nonradioactive material.
Most comes from constituents of concrete and structural materials as is shown by the comparisons in Fig.
3.9-3 for an accident involving boiling water reactor core debris interacting with calcareous concrete.
Nevertheless, significant releases of radionuclides can occur during core debris interactions with concrete.
Release fractions for various classes of radionuclides derived from tests and model predictions of core
debris interactions with concrete and used for regulatory analyses in the USA [6] are shown in Table 3.9-2.
But recent investigations lead to the assumption that the release of the volatile radionuclides (halogens,
alkali metals and to a less extend Te) are not coming from the MCCI. They are in-vessel release from fuel
remaining in the RPV, but being released during the ex-vessel phase of the accident.
Table 3.9-2 Radionuclide release fractions associated with core debris concrete interactions at
BWRs and PWRs
Boiling Water Reactor Pressurised Water Reactor
Radionuclide Release
Duration (hr)
3.0 2.0
Fraction of Initial Core Inventory of Radionuclide Released During Core
Debris/Concrete Interactions
Halogens (I, Br) 0.30 0.25
Alkali Metals (Cs, K) 0.35 0.35
Tellurium 0.25 0.25
Ba, Sr 0.10 0.10
Ru, Mo, Pd 0.0025 0.0025
Ce 0.005 0.005
La 0.005 0.005
Releases of nonradioactive isotopes of important fission product elements observed in the ACE tests [5]
are shown in Fig. 3.9-4. Only the relative releases can be compared to results of accident analyses since
total release is quite dependent on details of melt composition and the accident scenario. Surprising
features of the tests are the measured releases of Mo and Ru which are not predicted by the computer
models of fission product release during core debris interactions with concrete. This has been attributed to
improper modeling of the partitioning of fission products between the oxide and metal phases of core
debris interacting with concrete.

NEA/CSNI/R(2009)5
105
Relative Release Fraction
1e-5
1e-4
1e-3
1e-2
1e-1
1e+0
Ba
Ce
La
Mo
Ru
Sr
Te
U
Zr
Fig. 3.9-4 Relative release fraction observed in the ACE L6 test
Some attempts have been made to characterise the particle size distribution of aerosols evolved during core
debris interactions with concrete [7]. Much of this effort has been directed at determining the fraction of
aerosol formed by entrainment and the fraction formed by the condensation of vapors. In general, aerosols
produced by entrainment are expected to be larger than those produced by vapor condensation.
Furthermore, the aerosol particles produced by entrainment should have compositions much like the bulk
melt whereas aerosol particles produced by vapor condensation should have compositions reflecting the
relative vapor pressures of the melt constituents. It is, however, difficult to get reproducible data
immediately above the melt where the environment is very dynamic and farther from the site of melt
interactions with concrete, coagulation of the aerosol obscures differences in aerosol produced by
mechanical and vaporization processes.

NEA/CSNI/R(2009)5
106
Aerodynamic Particle Diameter, D
p
, (µm)
0.1 1 10 100
Mass-weighted Probability Density
Fig. 3.9-5 Typical aerosol size distribution derived from impactor data taken during core debris
interactions with concrete
A typical mass-weighted aerodynamic particle size probability density function produced from data
collected by aerosol impactors during melt interactions with concrete is shown in Fig. 3.9-5. Aerodynamic
mass mean particle sizes are typical around 1 µm. The geometric standard deviation values are variable
exceeding 3 when interactions are very vigorous. This breadth of the aerosol particle size distribution when
melt/ concrete interactions are vigorous is attributed to multiple mechanisms of aerosol production being
operative. As interaction vigor subsides, aerosol size distributions are typically found to be narrower with
geometric standard deviations sometimes less than 2. There is some evidence of compositional variability
across the size distribution, but it is not especially pronounced.
A common accident management strategy is to provide water to cover any core debris that escapes to the
reactor cavity. Though it has not been demonstrated that the water will quench core debris in a reactor
cavity and prevent interactions with concrete, it has been shown that a water pool overlying core debris can
attenuate aerosol production rather significantly. Attenuation of the aerosol production during core debris
interactions with an overlying water pool is thought to occur by two processes. The water pool will
typically cause a crust to form over the core debris that interferes with or filters aerosol produced by the
entrainment of molten core debris in the gas flow and aerosol production by bubble bursting. Vapors can
also condense as they pass through the crust. The water body will also scrub aerosol and vapors from
bubbles emerging from the core debris and sparging through the water much as does a steam suppression
NEA/CSNI/R(2009)5
107
pool. That is, aerosols are removed from bubbles by a combination of diffusion, inertial impaction and
sedimentation. As little as 30 cm deep pools of saturated water have been observed to reduce aerosol
production during tests of core debris interactions with concrete by a factor of up to 15 [8].
Models of aerosol production during core debris interactions with concrete
Most of the important accident analysis codes have some modeling of aerosol production during core
debris interactions with concrete. The most thoroughly documented of these models is the VANESA model
[1] that is now part of the MELCOR computer code [9]. The models of aerosol production have to be
coupled with a model of core debris attack on concrete such as the CORCON model [10] in MELCOR.
The models of core debris attack on concrete provide melt temperatures, melt compositions, gas production
rates and geometrical data for the aerosol production models. All of the models estimate the vapor
pressures of important melt constituents and the mass transport of these vapors into bubbles of the gas
sparging through the molten core debris. Correlations are based largely on data obtained for bubbles
sparging through water or similarly conventional liquid [4]. Some of the models account for the
mechanical production of aerosol by entrainment or bubble bursting. Entrainment modeling is usually
based on data obtained for gas sparging through water. Typically, the detailed behaviour of vapors released
from the core debris via the sparging gases is not modeled. It is more typical for the vapor mass to be
assumed to nucleate particles that populate the smallest bin in an sectional representation of the aerosol
size distribution in the reactor containment atmosphere. The subsequent coagulation and deposition of
these aerosols along with aerosols from other sources are modeled using the aerosol physics models in the
accident analysis codes.
References
[1] D.A. Powers, J.E. Brockmann, and A.W. Shiver, VANESA: A Mechanistic Model of Radionuclide
Release and Aerosol Generation During Core Debris Interactions With Concrete, NUREG/CR-4308,
Sandia National Laboratories, Albuquerque, NM, July 1986
[2] D.A. Powers and F.E. Arellano, Large-scale Transient Tests of the Interaction of Molten Steel with
Concrete, NUREG/CR-2282, Sandia National Laboratories, Albuquerque, NM, January 1982
[3] D. A. Powers, "Empirical Models for the Thermal Decomposition of Concrete", Transactions of the
American Nuclear Society
26, (1977) 401
[4] I. Kataoka and M. Ishii, International Journal of Heat and Mass Transfer,
27 (1984) 1999
[5] J.K. Fink, D.H. Tompson, D.R. Armstrong, B.W. Spencer, and B.R. Sehgal, High Temperature and
Materials Science,
33 (1995) 51
[6] L. Soffer, S.B. Burson, C.M. Ferrell, R.Y. Lee, J.N. Ridgely, Accident Source Terms for
Light-Water Nuclear Power Plants, NUREG-1465, U.S. Nuclear Regulatory Commission,
Washington D.C., February 1995
[7] J.E. Brockmann, Progress Nuclear Energy,
19 (1987) 7
[8] R.E. Blose, J. Gronager, A. Suo-Antilla, D. Bradley, and J.E. Brockmann, SWISS: Sustain Heated
Metallic Melt Concrete Interaction with an Overlying Water Pool: Experiments and Analyses,
SAND85-1546, Sandia National Laboratories, Albuquerque, NM, 1985
NEA/CSNI/R(2009)5
108
[9] R.O. Gauntt, R.K. Cole, C.M. Erickson, R.G. Gido, R.D. Gasser, S.B. Rodriguez, and M.F. Young,
MELCOR Computer Code Manuals, NUREG/CR-6119, Rev.2, Sandia National Laboratories,
Albuquerque, NM, December 2000
[10] D.R. Bradley and D.R. Gardner, CORCON-Mod3: An Integrated Computer Model for Analysis of
Molten Core Concrete Interactions: Users Manual, NUREG/CR-5843, Sandia National Laboratories,
Albuquerque, NM, 1992
3.10 Aerosols from Fire
Fire is a hazard that can afflict all nuclear power plants. On average, a plant will have a reportable fire
about once every two years. In most cases, these fires are readily suppressed and extinguished using the
fire protection features of the plant. Occassionally fires of such magnitude that they threaten the safety of
the plant. Of course, the most famous of the threatening fires was that at the Browns Ferry nuclear station
[1] in 1975. Many enhancements to fire protection were made at nuclear plants following the incident at
Browns Ferry. Still, significant fires occur [2]. Risks of fires leading to core damage have been assessed by
all operating nuclear plants in the USA [3]. As shown in Fig. 3.10-1, the risk of fire leading to core damage
is typically commensurate with the risk that other, internal plant events more familiar in accident analyses
will lead to core damage. The risk analyses have shown that the major types of fires at nuclear power
plants include combustion of hydrogen used to cool turbines, lubricating oil fires, and cable fires. Of these,
cable fires are of the most safety concern. The cables of interest include power cables, control cables and
instrumentation cables. Combustion of the insulation on these cables can lead to electrical shorts that can
cause spurious operation of equipment, loss of safety functions and misleading control room information.
Cable fires can be the source of an enormous amount of aerosol. A photograph of smoke coming from a
cable fire at a non-nuclear power plant is shown in Fig. 3.10-2. Fire and smoke from the burning of a
transformer at a nuclear power plant substation is shown in Fig. 3.10-3. The smoke from cable fires is
known to be quite corrosive and often contains substantial hydrochloric acid. There is a concern, then, that
smoke produced in any fire, but especially smoke from cable fires, could damage equipment in plants.
Because of aerosol transport, the equipment damage by deposited, corrosive aerosol particles could occur
at locations well removed from the site of the fire. The effects of smoke from burning cable insulation on
digital circuits that might be used in nuclear power plants have been investigated [4]. Their investigations
identified types of circuits that were susceptible to smoke damage. There is, then, safety reasons to want to
understand the behaviour and transport of aerosol produced by cable fires aside from interest in the
interaction of fire aerosol with radioactive aerosol from a core degradation accident.

NEA/CSNI/R(2009)5
109
Internal Events Core Damage Frequency (yr
-1
)
1e-6 1e-5 1e-4 1e-3
Frequency of Fire-induced Core Damage (yr
-1
)
1e-6
1e-5
1e-4
1e-3
PWR
BWR
Fig. 3.10-1 Frequency of core damage caused by fire plotted against the expected frequency of core
damage caused by all other credible events during plant operations for US nuclear power
plants. Points are shown for US boiling water reactors (BWR) and US pressurised water
reactors (PWR). Points above the diagonal black line indicate plants with greater risk from
fire than from other internal initiators of plant damage. In all cases, the fire risk is
commensurate with risk from other internal events.
Fig. 3.10-2 Smoke from a cable fire at a non-nuclear power plant

NEA/CSNI/R(2009)5
110
Fig. 3.10-3
Fire and smoke produced during a substation fire
Whereas much is known about smoke and soot aerosols produced in hydrocarbon fires, relatively little is
known about the aerosol generated when cable insulation burns. The extinction coefficient of aerosol was
measured in smoke tests with digital equipment [4]. Also the relative amounts of aerosol deposition on
horizontal and vertical surfaces in a 92x92x123 cm test chamber were measured. Examples of these results
are shown in Fig. 3.10-4 and Fig. 3.10-5. Otherwise, no quantitative information has been found about the
characteristics of cable fire aerosols such as size distribution, shape factors and production rates. There are
plans in ongoing cable fire tests being sponsored by the US Nuclear Regulatory Commission to collect
some limited amounts of information about cable fire aerosol.
Optical Turbidity
Time (hour)
0.00 0.25 0.50 0.75 1.00
Extinction Coefficient (cm
-1
)
0.0
0.1
0.2
0.3
0.4
0.5
0.6
1.060 µm light
0.4579 µm light
Fig. 3.10-4 Optical extinction coeffiient of aerosol-laden gas phase during test of digital equipment
in a cable fire. Extinction coefficient was measured at two different wave lengths each
over path lengths of 1.9 and 3.2 cm to correct for the deposition of aerosols on lens
surface

NEA/CSNI/R(2009)5
111
Aerosol Deposition on Surfaces
Time (hour)
0.00 0.25 0.50 0.75 1.00
Mass Deposited (µg/cm
2
)
0
1
2
3
4
5
6
7
8
9
10
Vertical Surfaces
Horizontal Surfaces
Fig. 3.10-5 Deposition of cable fire aerosols on vertical and horizontal surfaces during test of digital
equipment
References
[1] R.L. Scott “Browns Ferry Nuclear Power Plant Fire on March 22, 1975” Nuclear News, 17 (1976) 592
[2] S.P. Nowlen, M. Dazarians, F. Wyant Risk Methods Insights Gained From Fire Incidents,
NUREG/CR-6738, Sandia National Laboratories, Albuquerque, NM, September 2001
[3] Division of Risk Analysis and Application, Office of Nuclear Regulatory Research, Perspectives
Gained From the Individual Plant Examination of External Events (IPEEE) Program, NUREG-1742,
Volumes 1 and 2, U.S. Nuclear Regulatory Commission, Washington, DC, April 2001
[4] T.J. Tanaka, S.P. Nowlen, and D.J. Anderson, Circuit Bridging of Components by Smoke,
NUREG/CR-6476, Sandia National Laboratories, Albuquerque, NM, October 1996, and references
therein
3.11 Spray Systems
The reactor containment buildings of most pressurised water reactors and the drywells of most boiling
water reactors are equipped with water spray systems. These spray systems were installed to condense
steam and reduce the pressure threat to containment or drywell integrity in the event of a design-basis,
large break in the reactor coolant system. Sprays are also very effective at removing aerosol particles from
the containment or drywell atmospheres during severe reactor accidents [1, 2].
Spray systems consist of a large number of spray nozzles oriented differently near the top of the
containment or drywell. These nozzles discharge large numbers of water droplets that fall along ballistic
trajectories through the atmosphere and sweep out aerosol particles. Some characteristics of two spray
nozzles commonly used in US reactors are shown in Fig. 3.11-1 and Fig. 3.11-2. The Whirljet spray nozzle
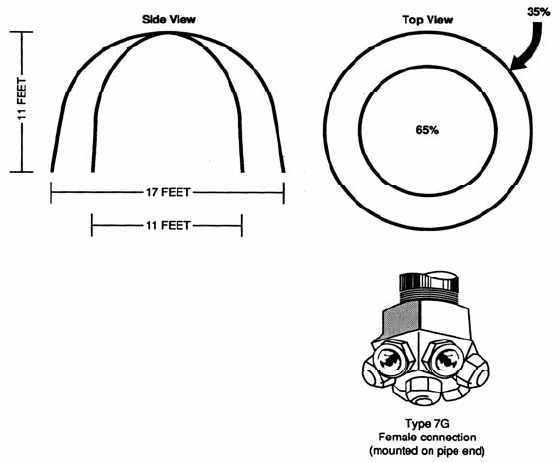
NEA/CSNI/R(2009)5
112
discharges water through multiple orifices over a circular pattern when directed downward so that at a
distance of 3.35 m from the nozzle, 65 % of the water flow is relative uniformly dispersed over a region
3.35 m in diameter and the remaining 35 % of the flow is over an annular region with inner diameter 3.35
m and outer diameter 5.2 m. The Sprayco Model 1713-A nozzle discharges water droplets through a single
nozzle. The diameter of the sprayed region is 2.58 m at 3.05 m from the nozzle, 3.60 m at 4.57 m from the
nozzle and 5.8 m at a distance of 30.5 m from the nozzle. The water distribution over the sprayed region is
not entirely uniform even at large distances from the nozzle as shown in Fig. 3.11-3. To achieve more
uniform droplet distribution over the sprayed volume of a containment or drywell, spray patterns are
overlapped.
Spray droplets remove aerosol particles from the containment or drywell atmospheres by several
mechanisms:
•
Diffusiophoresis: Steam condensing on the droplets sweeps aerosol particles into the droplet.
•
Impaction: Aerosol particles unable to follow streamlines of flow around a droplet collide with
the droplet.
•
Interception: Because of their finite dimensions, aerosol particles with centers of mass moving
along streamlines of flow contact and adhere to the droplets.
•
Diffusion: Brownian motion carries particles across streamlines of flow into contact with falling
droplets.
Fig. 3.11-1 Characteristics of a whirljet spray nozzle

NEA/CSNI/R(2009)5
113
Fig. 3.11-2 Characteristics of a sprayco model 1713-A spray nozzle
Fig. 3.11-3 Nonuniformity of spray droplet distribution from a sprayco model 1713-A spray

NEA/CSNI/R(2009)5
114
The diffusiophoresis mechanism is only important early in an accident when the atmosphere is steam rich
and aerosol concentrations are quite low. Consequently, this mechanism is not usually considered in the
analysis of the steady state effectiveness of aerosol removal by sprays.
Water droplets falling through a gas are approximately oblate ellipsoids. The droplet presents a
cross-section characterised by an effective diameter D
d
(e) as it falls through the gas. Were the aerosol
particles fixed, the water droplet would sweep out aerosols within the volume defined by the droplet
cross-sectional area times the length of it trajectory. Aerosol removal would be independent of particle
size. In actuality, the aerosols will try to follow the streamlines of flow around the falling droplets. Because
some particles will flow around the falling droplet, there is an inefficiency in the aerosol removal by falling
droplets relative to removal of fixed aerosol particles. The efficiency of aerosol removal by impaction,
interception and diffusion is expressed as the ratio of the number of particles actually removed from the
atmosphere by a particular mechanism to the number of fixed particles that would be removed by a droplet
along the same trajectory.
()
(
)
() ()
LineD
iN4
i
2
d
π
=∈
∗
where:
()
i∈ = removal efficiency of particles of size class i
N*(i) = actual number of particles of size class i removed
()
eD
d
= effective droplet diameter
()
in = concentration of particles of size class i in the atmosphere
L = pathlength of droplet trajectory
Because the hydrodynamics of flow around a droplet, especially in a field of other droplets, can be
complicated, there are different descriptions of the particle collection efficiency especially for impaction
and interception mechanisms. Some commonly used expressions are [3]:
•
Impaction
()
(
)
(
)
60/Re1
60/potentialReviscous
impaction
d
d
+
∈
+
∈
=∈
where:
()
impaction∈ = efficiency of particle removal by impaction

NEA/CSNI/R(2009)5
115
()
()
<<−
δ+
≥
δ+
≤
=∈
2.0Stk08334.0for08334.0Stk
Stk
Stk
57.8
2.0Stkfor
Stk
Stk
08334.0Stkfor0
potential
2
2
()
()
>
−
+
≤
=∈
214.1Stkfor
214.1Stk
Stk2n175.0
1
1
214.1Stkfor0
viscous
2
Stk = Stokes number =
()
χµ
ρ
eD9
UdC
dg
Tg
2
p
(
)
g
dgT
d
eDU
numberynoldsRedropletsRe
µ
ρ
==
d
p
= aerosol particle diameter
D
d
(e) = effective droplet diameter
U
T
= terminal velocity of the falling droplet
δ = uncertain constant 0.25 < δ < 0.75
g
µ = gas viscosity
g
ρ = gas density
χ = dynamic shape factor for aerosol particle
•
Interception
()
()
(
)
60/Re1
60/potentialReviscous
int
d
d
+
Ψ
+
Ψ
=∈
where:
()
potentialΨ = 3I
()
viscousΨ =
()
()
()
+
+
+
−+
2
2
I1
5.0
I1
5.1
1I1
I =
()
eD
d
d
p
γ

NEA/CSNI/R(2009)5
116
and γ is the collision shape factor of the aerosol particles. Gieseke and Lee [4] have discussed the
complications and approximations involved in these particle removal efficiencies for the interception
mechanism.
•
Diffusion
Many expressions have been developed for the removal of aerosol particles by water droplets by diffusion.
Among these are:
()
(
)
8/32/1
d
ScRe557.01
Pe
4
diffusion +=∈
()
3/2
Pe
18.3
diffusion =∈
()
()
eDPe2
1
diffusion
d
=∈
()
()
Pe
3.0
eD
d
for
Pe
18.2
diffusion
d
p
<=∈
where:
d
ReScnumberPecletPe ==
TkC
d3
numberSchmidtSc
g
p
2
g
ρ
πµ
==
k = Boltzmann constant
C = Cunningham slip correction factor
These expressions are based on the collection by diffusion to an isolated sphere. Of course water droplets
are neither spherical nor isolated. It is known [5] that the mass transport to a sphere is affected by the
presence of another spherical collector.
Terminal water velocities and drag coefficients on water droplets falling through air are discussed in
conventional sources [6] and include the model [7]:
[
]
2
DDT
Nn101912.0Nn101.1126.3Ren1 −+−=
3550Re1.010N4.2
T
7
D
<<<<
where:
T
Re = terminal Reynolds number =
(
)
gdgT
/eDU µρ
D
N = Best number =
(
)()
2
g
3
dg
3/eDg4 µρρ
l
D
C = drag coefficient =
2
TD
Re/N

NEA/CSNI/R(2009)5
117
The combined effects of impaction, interception and diffusion on the removal of aerosol are modeled either
additively:
() ( )
(
)
(
)
diffusionintimpactiontotal ∈+∈+∈=∈
or with a compound model:
()
(
)
[]
(
)
[
]
(
)
[
]
diffusion1int1impaction11total ∈−∈−∈−−=∈
The removal efficiency is highly dependent on both the particle size and the effective droplet diameter.
Diffusion is effective at the removal of very small aerosol particles (<0.1 µm) Impaction affects mostly
aerosol particles larger than about 5 µm. Interception affects particles in the size range of 0.5 to 2 µm.
Consequently, as shown in Fig. 3.11-4, there is a minimum in the total aerosol removal efficiency when
plotted against aerosol particle size. This minimum depends on the droplet diameter. For droplets on the
order of 1000 µm, this minimum is in the vicinity of 0.1 to 0.2 µm. For smaller droplets, the minimum
shifts to larger particle sizes. The effect of the minimum in the aerosol capture efficiency is that sprays not
only reduce the amount of aerosol present in the containment atmosphere, they also sharpen the size
distribution of the aerosol around the size of minimum removal efficiency. This effect is shown for an
example calculation in Fig. 3.11-5. For this example calculation, an initial aerosol with a mean diameter
near 1 µm and a broad size distribution evolves under the action of a spray to become an aerosol with a
much narrower size distribution centered round about 0.3 µm.
Fig. 3.11-4 Overall aerosol removal efficiency by a spray droplet as a function of particle size and
droplet size. Note that the aerosol particle size least efficiently removed by spray
droplets varies with the size of droplet

NEA/CSNI/R(2009)5
118
Fig. 3.11-5 Evolution of the aerosol size distribution and mass concentration during spraying.
Curves are labeled by the total decontamination achieved by the spray. Note both the
attenuation of the aerosol as well as the shift and narrowing of the size distribution
Many models of the effects of spray on aerosol in reactor accident consider only a single droplet size and
often predict a persistent residual aerosol concentration that is only very slowly removed from the
atmosphere. In fact, spray nozzles produce a distribution of droplet sizes. The number distribution of
droplets from two types of spray nozzles are shown in Fig. 3.11-6 and Fig. 3.11-7. The number
distributions are not simple, but they are peaked for reasonably small droplets. On the other hand, the mass
weighted distribution of the spray droplet sizes are peaked in both cases above 1000 µm.
Whirjet Spray Head
Droplet Diameter (µm)
0 500 1000 1500 2000
Relative Number Frequency
Fig. 3.11-6 Number distribution of spray droplet sizes for a whirljet spray head

NEA/CSNI/R(2009)5
119
To avoid an artificial prediction of a persistent aerosol in a sprayed atmosphere, it is necessary to account
for the distribution of spray droplets sizes. A complication in doing this is that spray droplets collide with
each other. A commonly used expression for the efficiency of droplet-droplet interactions is:
()
(
)
() ()
[]
() ()
jDiDfor
jDiD
iD
dropletdroplet
dd
2
dd
2
d
ij
>
+
=−∈
Experimental evidence suggests that this expression over estimates the interactions of droplets with other
droplets of similar size. A more empirical expression consistent with available experimental data is [8]:
()
(
)
()
(
)
()
<−
=−∈
otherwise0
8
1
iD
jD
for
iD
jD
1
dropletdroplet
d
d
d
d
ij
Sprayco Model 1713-A
Droplet Diameter (µm)
0 500 1000 1500 2000
Relative Number Frequency
Fig. 3.11-7 Number distribution of spray droplet size for a sprayco model 1713-A nozzle
The evolution of the spray droplet size distribution as a function of fall distance is shown in Fig. 3.11-8.
The effect of droplet-droplet interactions is to remove from the distribution the smaller droplets which are
more effective at trapping aerosol particles.
There has not been a great incentive to improve models of spray removal of aerosol particles since sprays
are enormously effective at decontaminating a atmosphere. Reductions in the aerosol concentration by a
factor of 10 can initially be achieved in a time on the order of one hour. Further reductions in the aerosol
concentration are slower because the action of the spray alters the size distribution of the aerosol so that
particles are less efficiently removed. Nevertheless, decontamination factors in excess of 1000 are
practically achieved.

NEA/CSNI/R(2009)5
120
Watanabe
et al. [9]. have reported integral tests to validate the modeling of spray removal of aerosols in
the MELCOR accident analysis model. The tests were done in a facility 18 m tall with a volume of 12.2
m
3
. CsI particulate were used in the test. Other tests in the effort used latex particles. The investigators
were able to obtain good agreement between test results and model predictions.
Fig. 3.11-8 Evolution of droplet size distribution as a function of fall distance based on the empirical
model of droplet-droplet interactions
References
[1] R.K. Hilliard, et al Nuclear Technology, 10 (1971) 499
[2] M. Tanaka, et al Nuclear Technology, 54 (1981) 54
[3] D.A. Powers and S.B. Burson A Simplified Model of Aerosol Removal by Containment Sprays,
NUREG/CR-5966, Sandia National Laboratories, Albuquerque, NM, June 1993
[4] K.W. Lee and J.A. Gieseke J. Aerosol Sci., 11 (1980) 335
NEA/CSNI/R(2009)5
121
[5] A.R.H. Cornish Trans. Institute of Chemical Engineers, 43 (1965) 332
[6] R. Clift, J.R. Grace and M.E. Weber Bubbles, Drops and Particles, Academic Press, 1978
[7] C.S. Pemberton J. Air Pollution, 3 (1960) 168
[8] N. Arbel and Z. Levin Pure and Applied Geophysics, 115 (1977) 869
[9] A. Watanabe, H. Nagasaka, S. Yokoobori, and M. Akinaga
http://www.nupec.or.jp/database/paper/paper_11/
3.12 The Impact of Catalytic Hydrogen Recombiners
Background
Passive hydrogen re-combiners have been studied for many years as a means of preventing accumulation
of hydrogen in the containment of a water-cooled reactor following a design-basis or severe accident [1, 2].
Their installation is now an established and sometimes mandatory measure. Back-fitting of such devices on
existing nuclear power plants has been performed or is in progress in many countries while Generation III
reactor designs (AP600, EPR, etc.) are already equipped with them.
Passive autocatalytic recombiners (PAR) are usually based on palladium and/or platinum dispersed on
some substrate medium. A PAR comprises a vertical conduit with the catalytically-active part near the
bottom. If hydrogen is present in the containment, the hydrogen molecules making contact with the
noble-metal catalyst react with the oxygen of the containment atmosphere producing steam and heat. The
reaction heat provokes heating up of the catalytic elements inducing natural convection which draws more
of the containment atmosphere into the PAR from below. The effect is not only to recombine hydrogen
with oxygen as it passes through the catalytic elements but to mix the containment atmosphere eliminating
any pockets where hydrogen concentrations may be elevated. We note also that carbon monoxide is
oxidised on the catalysing surface. While the operating principle of PARs is well understood, there remains
some progress to be made before it can be said that a thorough understanding exists of the sensitivity of
PARs to the conditions expected to be produced by design-basis or severe accidents. It should be noted,
however, that while little information is in the public domain (e.g., see [2, 3]) much more probably remains
proprietary. There are a number of companies marketing PARs, e.g., Atomic Energy of Canada Limited,
AREVA/ Framatome-ANP, Nuklear Ingenieur Service mbH, Electrowatt-Ekono AG, and each design is
different having its own operating characteristics.
There is a potential problem with the use of PARs in relation to aerosol particles suspended in the
containment atmosphere. As these pass through the catalytic elements they will be heated up along with the
gases and this will inevitably lead to partial evaporation of volatile species from the aerosols. Peak
temperatures of the catalytic elements varies according to the manufacturer but is in the range 500 - 900
°C, i. e., high enough to evaporate many fission-product species. These fission-product vapors may well
interact chemically with each other and/or with the gases of the atmosphere (in general a combination of
nitrogen, oxygen, steam, carbon monoxide and carbon dioxide), especially oxygen. There is therefore the
possibility that reactions in PARs could lead to formation of more volatile forms of fission-product species
aggravating the source term by converting easily-filtered aerosol material into more troublesome vapors
and gases.
Current knowledge
Only a single series of experiments, known as RECI, has been performed to investigate the thermal
decomposition of fission-product species in conditions related to those of a severe accident [4, 5]. The
NEA/CSNI/R(2009)5
122
objective of the RECI experiments was measurement of any creation of more volatile forms of iodine, viz.
I
2
, HOI and HI, from metal-iodide species expected in severe accidents, viz. AgI, InI, CdI
2
and CsI. Two of
these species, cesium iodide or cadmium iodide, in an atmosphere of humidified air were injected as
aerosols into a heated tube in tests both with and without the presence of a catalysing surface. The
experiments comprised separate tests for aerosols of each of the two pure substances. The peak
temperature of the heated tube was varied between 500 and 950 °C. The gas-phase iodine species were not
measured in the heated tube but downstream where temperature had once again become ambient. It was
found that thermal decomposition producing molecular iodine could occur even for the more stable of
these species, cesium iodide, where the presence of a catalyst increased the iodide to iodine conversion by
a factor of two to three. At the highest temperatures, conversion rates of more than 10 % were measured
for cesium iodide. Conversion rates for cadmium iodide were significantly greater. Sensitivity to
parameters such as particle size and transit time through the heated zone was checked where longer transit
times and smaller particles led to higher conversion rates. A further effect of the partial evaporation of the
aerosols was to produce a population of small particles as the vapor(s) re-condensed during cooling
downstream of the heated tube. This new population resulting from homogeneous nucleation was
significantly smaller than any of the source particles injected into the heated tube.
A potential effect of the molecular iodine production would be to poison the catalyst with respect to
hydrogen conversion. However, in separate tests, this poisoning was found to be very limited [3].
Initial analysis of the RECI tests [6] supports the idea that the kinetics of the chemical reactions
downstream of the heated zone is the key to understanding the conversion rates. In other words, if a
thermodynamic approach to chemistry is assumed (i.e., equilibrium chemistry) as the flow cools then the
volatile species convert back to less volatile forms and conversion is virtually zero. Furthermore, the
conversion rates calculated at the peak temperature, i.e., in the heated tube, are close to those measured at
ambient temperature implying almost complete quenching of chemical reactions once they left the heated
tube.
It should be understood that these experimental results are simply a confirmation of the potential for iodine
species from containment aerosols to convert to more volatile species while in transit through a PAR. A
number of representativity aspects prevent these results from being extrapolated to the reactor case. In the
first instance, the aerosols investigated were pure substances: the consequences of using prototypical
mixed-substance aerosols will necessarily alter the gas-phase chemistry produced in the PARs. In addition,
the presence of mixed aerosols with refractory kernels will perhaps facilitate re-condensation of evaporated
species during cooling onto existing aerosols rather than formation of new ones, i. e., heterogeneous rather
homogeneous nucleation. The gas mixture used in these tests was humidified air where, in the
containment, at least during a severe accident, a less-oxidizing mixture containing a higher steam fraction
as well as hydrogen will be present: it is known that reducing conditions are thermodynamically less
favourable to formation of volatile iodine species. Finally, the cool-down characteristics of the flow
leaving the PARs have not been reproduced in the RECI tests: this is crucial to the propensity for vapors to
re-convert as they cool where more rapid cooling will not favour this re-conversion to a gas-vapor-aerosol
mixture closer to that at equilibrium at ambient temperature.
References
[1] F. Fineschi, G. Koroll, J. Rohde “Mitigation of hydrogen hazards in water cooled power reactors”,
IAEA-TECDOC-1196 (2001)
[2] E. Bachellerie, F. Arnould, M. Auglaire, B. de Boeck, O. Braillard, B. Eckardt, F. Ferroni, R.
Moffett "Generic approach for designing and implementing a passive autocatalytic recombiner PAR-
system in nuclear power plant containments” Nucl. Eng. Des. 221(1-3), 151-165 (2003)
NEA/CSNI/R(2009)5
123
[3] F. Morfin, J.-D. Sabroux, A. Renouprez “Catalytic combustion of hydrogen for mitigating hydrogen
risk in case of a severe accident in a nuclear power plant: study of catalysts poisoning in a
representative atmosphere”, Applied Catalysis B: Environmental 47, 47-58 (2004)
[4] F. Deschamps, J.-C. Sabroux “Etude de la production d’iode gazeux par un aerosol d’iodure de
césium soumis à des temperatures élevées dans l’air humide” Proc. 18
th
French Aerosol Conference,
Paris, 11-12 Dec. 2002, ASFERA (2002)
[5] F. Deschamps, J.-C. Sabroux “Particulate iodide to gaseous iodide conversion in a passive
autocatalytic hydrogen recombiner” J. Aerosol Sci. 34, S1087-S1088 (2003)
[6] N. Baltzer, M.P. Kissaneprivate communication (2005)
3.13 Filters
Type of filters in use
The requirements for the design of a filter system in removing the fission products depend on the thermal
hydraulic conditions (temperature, pressure, humidity level or steam condensation, flow rate through the
filter system) and concentration of the fission products in gaseous and aerosol form. The severity of the
conditions imposed by the normal operational conditions or accidents (design basis or severe accidents
involving core damage) produce the challenge for the design of the systems.
Normal operation and design basis accidents
During operational conditions containments are normally kept sub atmospheric in order to avoid any
accidental release of even small activity into the environment. Ventilations systems, depending on the
design and regulatory requirements, may contain parallel trains of filtration systems. A typical filter train
contains the following sequential components: (1) a moisture separator to remove entrained water droplets,
(2) a heater to control relative humidity (RH) when the RH of the air entering the carbon adsorber exceeds
nominally 70 %, (3) prefilters, (4) HEPA filters, (5) a charcoal adsorber, (6) HEPA filters downstream of
the adsorbers, and (7) a fan. Fig. 3.13-1, adopted from [1], displays a typical filtration unit. Ducts, valves,
and dampers are also included for system isolation and flow control, as well as related instrumentation.
When the moisture and dust loads are low for all credible operating modes, the prefilter and moisture
separator may not be required.
The source of activity in the containment originates from the release of dissolved activity (e.g., iodine) in
the primary coolant water as a result of a leak from the circuit. The source of the activity in the circuit
could be due to leaking fuel elements or due to iodine spiking. The maximum permissible activity level in
the circuit and in the containment is defined by regulations.

NEA/CSNI/R(2009)5
124
Fig. 3.13-1 A typical air cleaning system [1]
By definition design basis accidents (DBA) involving loss of coolant foresee rupture of cladding of certain
number of fuel rods, which then causes the release of fuel cladding gap inventory into the primary coolant
water. The inventory is mostly composed of noble gases, and volatile fission products (iodine, cesium).
The release of the primary coolant water into the containment causes the activity release into the
containment. If the accident is a containment by-pass accident then the activity is released directly either
into the auxiliary/reactor building (V-sequence) or through the broken steam generator tube(s) (SGTR) into
the steam generator secondary side and after some scrubbing in the secondary water, eventually directly
into the environment. Loss of coolant accidents due to SGTR with few tube failure normally do not cause
any fuel cladding failure, but a certain fraction of the dissolved activity in the primary circuit at the time of
the accident may be released into the environment in a combination of gas and in water dissolved form.
Release of water droplets or continuous water flow will be the transport media for the dissolved activity
out of the steam generator secondary side. The break location determines the extent of each of such release.
Containment or auxiliary (reactor) building filtration systems are designed to avoid any substantial release
of activity transported by aerosol particles and gaseous iodine. Of course the main assumption at the
background of this statement is that the containments are isolated and there are no uncontrolled leak paths.
Severe accidents
Severity of the conditions during severe accidents varies depending on the success of the accident
management measures attempted. However, anticipated conditions: high temperature, high pressure, high

NEA/CSNI/R(2009)5
125
steam concentrations, hydrogen burns or detonations, high aerosol and gaseous fission product
concentrations, and resulting high activity levels, are very much depending on the accident progression
driven by the status of the hardware as well as the accident management efforts. Contrary to the
operational or design basis accident conditions the anticipated severe accident conditions cannot be used as
the design parameters for the conventional filtration systems within the practical limitations. However, as a
result of the emerging new regulatory requirements for the severe accidents, which can not be ‘normally’
fulfilled by the conventional filtration systems new filtration concepts were developed in 1980s to backfit
the current operating reactors in some countries. The main emphasis in the new regulatory requirements is
to keep the pressure in the containment under the design limits in order to avoid catastrophic containment
failures by relieving the pressure by venting through a containment venting filter, which should at the same
time remove the aerosol particles and molecular gaseous iodine with certain efficiencies.
Some of the new developed systems by various vendors at that time were tested by an international project,
Advanced Containment Experiments (ACE) Phase A, 1988-1992 [2]. The following section summarises
the filter concepts and the results achieved from the ACE experiments. Another containment venting filter
unit developed and tested in Switzerland is also introduced.
Characterisation of filter performance
There are several parameters currently in use to describe the effectiveness of a filtration device. These are,
however, all based on the mass of material injected to a device, m
in,
and the mass of material exhausted,
m
out
In the nuclear industry the most commonly used parameter is the Decontamination Factor, DF, which
is defined as the ratio of the injected to exhausted mass:
out
m
in
m
DF
≡
Intimately related to the DF is the penetration, Pt
,
which is defined as the ratio:
in
m
out
m
t
P
≡
This is just the inverse of the DF. The collection efficiency, η, is defined the ratio of the collected to the
injected mass. This can be written in terms of the injected and exhausted masses as:
in
out
m
m
1 −≡η
For most filtration devices, the efficiency of collection depends strongly on the particle size. Hence it is useful
to introduce the concept of a "fractional efficiency" where the definitions above apply for particular particle
size ranges. This definition introduces a difficulty for processes where the particles change size within the
filtration device. For example, hygroscopic particles can grow substantially [3] in wet scrubbers. In this
situation, the amount of exhausted mass in a particular size range must be based on the inlet size
distribution. Unfortunately, this is impossible to do experimentally, where only inlet and outlet size
distributions are measured, but the inlet and outlet particle concentrations in each size range cannot be
related. The only ways to determine this information are to either use aerosols, which do not grow, or less
ambiguously, inject only monodisperse aerosols.

NEA/CSNI/R(2009)5
126
The penetration can be quantified on the basis of a one dimensional filtration model as illustrated in Fig.
3.13-2
Fig. 3.13-2 Scheme of a one-dimensional filtration model
If the flow of aerosols through a control volume of length dz is considered and additionally a deposition
velocity v
dep
and a deposition area of P
dep
dz are postulated, a mass conservation equation for aerosols can
be written as:
Aerosols in
cg
Au
2
dn
n
−
- Aerosols out
cg
Au
dn
n
+
2
=
n
dn
− =
= Aerosols deposited
dzPvn
depdep
dz
Q
Pv
g
depdep
and after the integration as:
−=≡−≡≡
g
depdep
in
out
t
Q
Av
n
n
DF
P expη1
1
−=
g
depdep
V
Av
τ
exp
These expressions for overall penetration or efficiency apply to all the filters considered.
Nomenclature
Latin Symbols
A
c
Cross sectional flow area
A
dep
Deposition area
DF Decontamination factor
m
in
Mass of aerosol particles injected to filtration system
m
out
Mass of aerosol particles exhausted from filtration system
m
p
Particle mass
n Aerosol particle number
NEA/CSNI/R(2009)5
127
n
in
number of particles entering in the filter
n
out
number of particles leaving the filter
P
dep
Deposition area in the vertical surface of a filter slice along the integration direction
P
t
Penetration
Q
g
Volumetric flow rate of gas
u
g
Gas velocity
dep
v Deposition velocity
z Axial distance along venturi from the water injection point
Greek Symbols
η Overall collection efficiency
References
[1] DOE handbook, nuclear air cleaning handbook, DOE Technical Standards, DOE-HDBK-1169-2003,
November 2003
[2] M. Merilo, I.B. Wall “Containment Filtration Systems Tests, Summary Report” Electric Power
Research Institute, ACE Phase A, TR-A22, February 1992
[3] M.S. Hoseyni, A.T. Wassel "Growth of Aerosol Particles in a Steam Environment and its Effect on
Removal", Nuclear Eng, & Des, Vol. 97, 103 - 109, (1986)
3.14 Two Phase Flashing Jets and Water Aerosol Behaviour
The scenario for generation of a two-phase flashing jet in a reactor accident involves pressurised coolant
upstream of a break being released into a region of lower temperature and pressure. The value of the
superheat (T
sh
) for the pressurised water depends upon its initial temperature, and the saturation
temperature of the atmosphere to which it is released, T
sat
(P
∞
). If the saturation temperature is less than the
initial temperature of the liquid, then the release is defined to be superheated, with the degree of superheat
equal to T
sh
= T
0
- T
sat
(P
∞
). If the liquid is released into standard atmospheric conditions, this simply
represents the amount the initial temperature exceeds the normal boiling point of that liquid (T
sh
= T
0
- T
b
).
The initial state of the water is termed sub-cooled. If there is a break in the heat transport system, and the
water remains subcooled at the exit of the break, it would emerge as a single-phase homogeneous jet that
would disintegrate through mechanical processes. If downstream conditions lie below the liquid/vapor
phase line, (T
sh
> 0), the liquid pressure in the vicinity of the break may drop below the local saturated
vapor pressure, and the process known as flashing begins. The flashing process would be expected to be
the dominant mechanism for formation of water droplet aerosols after breaks in the high-pressure
primary-heat transport system (HTS).
Most current jet dispersion codes divide the process of atomisation or flashing of superheated jets into two
possible outcomes governed by mechanisms that operate independently, and whose relative importance
depend on the degree of superheat of the liquid: the first is termed mechanical break-up, the second
flashing break-up. However, there is no consensus regarding the relative contributions of these two
processes to the droplet size distribution from a flashing jet.
The behaviour of the two-phase (water-droplet and steam) jet has important implications for reactor
accident safety analyses. High enthalpy coolant flashing can cause the containment pressure to rise above
atmospheric, thereby increasing the potential for airborne fission products to leak out of containment. The
water droplets generated in the jet can “wash” previously released airborne aerosols and gaseous fission

NEA/CSNI/R(2009)5
128
products out of the atmosphere. The jets themselves are also a primary means by which fission products
enter containment. Water droplets formed by the jet discharge can coalesce to form larger droplets, settle to
the floor of the discharge room, impinge upon containment walls and structural surfaces, or remain
suspended, where they could be carried to the atmosphere through containment leaks, or to another room in
containment. Consequently, evaluation of the radiological consequences of nuclear reactor accidents
requires models for two phase flashing jets.
Water droplet aerosols generated by two-phase flashing jets are subject to the same aerosol removal
processes that are modelled routinely for dry aerosols in atmospheric aerosol codes (see Chapter 2).
However, the large momentum of the jets from an HTS break can result in inertial impaction becoming a
uniquely dominant removal mechanism if there are any obstacles in the jet path [1, 2]. The combination of
processes such as inertial impaction and turbulent deposition (see Chapter 2) that act to remove water
droplets after jet-obstacle interaction is referred to as impingement. The solid surface acts as an aerosol
collection device, with a collection efficiency
3
that depends on droplet thermophysical and transport
properties (size, angle of incidence, velocity), and surface roughness.
Aerosol collection efficiencies for inertial impaction are generally correlated to the droplet Stokes number
(St
d
), defined as the ratio of particle stopping distance, or inertial range (τ) at a given velocity, to the nozzle
(or jet) radius (see Chapter 2). Assuming that the velocity and droplet size distribution are known at the
region where jet impaction takes place, and that correlations between collection efficiency and droplet
Stokes number hold, jet impingement could be modelled using the same correlations. However all of the
data correlating collection efficiencies to Stokes numbers was obtained at Reynolds numbers of less than
1 × 10
4
, [3, 4, 5] whereas Reynolds numbers for inertial impaction from 10 MPa discharges could be more
than an order of magnitude higher [Chiang, 1998]. There are no studies of impactor collection efficiencies
at high Reynolds numbers.
A large body of data on the behaviour of flashing liquid propane is available from a European Union
funded program performed by the CEA in Grenoble [7, 8]. The propane release behaviour was examined
as a function of orifice diameter and initial storage pressure. The experiments measured the void-fraction,
pressure and temperature data within the blowdown vessel. Droplet size and velocity measurements were
taken at 3 downstream axial locations, and the distributions have been described as well-behaved functions
that could be adequately represented by general size distribution functions such as the lognormal or Rosin-
Rammler
4
[9]. Unfortunately, there are very few experiments suitable for validating models on the
behaviour of flashing jets from high temperature, high pressure water releases, and even fewer for
validation of processes such as impingement
5
.
The WALE facility experiments [1, 2] represent the largest collection of data on flashing water jet releases,
and are the only intermediate scale studies performed on droplets generated by flashing and removed by
impingement on obstacles. The studies were performed in a 19 m
3
cylindrical pressure vessel, with
discharge of liquid water at 1 to 10 MPa, and various degrees of sub-cooling. The effects of nozzle
geometry (size, length to diameter ratios), impingement plate characteristics (size, orientation with respect
to the jet and distance from break) were examined. Droplet velocities and size were also measured,
although experimental difficulties were encountered with measurement of the former. In general, the data
3
defined as the ratio of the mass of droplets or particles deposited on the solid surface per unit time to the total mass of droplets or
particles moving with the jet per unit time.
4
The weight-size distribution proposed by Rosin and Rammler in 1933 is
where M(>ℓ) is the cumulative mass of all particles of mass greater than size ℓ, M
T
is the total mass of the distribution, Φis a
size related to the average size of the distribution, and the exponent k is a free parameter. [10]:
5
Small-scale studies published by [11] have been used to correlate liquid collection efficiency for a two-phase jet impinging
normally on a flat surface.
NEA/CSNI/R(2009)5
129
showed that, for the entire range of conditions studied, more than 99 % of the water droplets were removed
from the vessel by various mechanisms.
The behaviour of flashing jets, including their production of water droplets, is reasonably well understood
qualitatively. However, there is no consensus in the literature regarding the prediction of water aerosol
droplet sizes from these jets, and very little data with which to validate models for aerosol removal from
this high temperature, high pressure flashing jet releases.
References
[1] R.J. Fluke, K.R. Weaver, G.L. Ogram, L.N. Rogers, C.F. Forrest The Water Aerosol Leakage
Experiments: Programme Description and Preliminary Results In Proceedings of the Second
International Conference on Containment Design and Operation, Toronto, 1990A
[2] R.J. Fluke, G.L. Ogram, L.N. Rogers, K.R. Weaver Aerosol Behaviour in the Water Aerosol
Leakage Experiments In Proceedings of the Second International Conference on Containment
Design and Operation
, Toronto, 1990B
[3] V.A. Marple A Fundamental Study of Inertial Impactors. Ph.D. Thesis, University of Minnesota,
Minneapolis, MN, 1970
[4] V.A. Marple, B.Y.H. Liu Characteristics of Laminar Jet Impactors Environmental Science and
Technology, 8. 648, 1974
[5] V.A. Marple, K.L. Rubow Theory and Design Guidelines In Cascade Impactor Sampling and Data
Analysis, American Industrial Hygiene Association Monograph, J.P. Lodge and T.L. Chan (editors),
1986
[6] H.W. Chiang A Model for the Removal of Water Droplet Aerosols from a Flashing Jet Impinging
onto a Plate In Proceedings of an OECD/CSNI Workshop on Nuclear Aerosols in Reactor Safety,
Cologne Germany, NEA/CSNI/R(98)4,1998
[7] E. Hervieu, T. Veneau Experimental Determination of the Droplet Size and Velocity Distributions at
the Exit of the Bottom Discharge Pipe of a Liquefied Propane Storage Tank During a Sudden
Blowdown J. Loss Prev. Ind., 9, No. 6, 413-455, 1996
[8] S. Vandroux-Koenig, G. Berthoud Modelling of a Two-Phase Momentum Jet Close to the Breach, in
the Containment Vessel of a Liquefied Gas J. Loss Prev. Ind., 10, No. 1, 17-29, 1997
[9] H.W.M. Witlox, P.J. Bowen Flashing Liquid Jets and Two-Phase Dispersion a Review Health and
Safety Executive (HSE) Contact Research Report 403. St Clements House, 2-16 Colegate, Norwich,
UK, 2002
[10] W.K. Brown, H.K. Wohletz Derivation of the Weibull Distribution Based on Physical Principles and
Its Connection to the Rossin-Rammler and Lognormal Distributions Journal of Applied Physics
78,
No. 4, 2758-2763, 1995
[11] N.A. Fuchs, C.N. Davis (editors) The Mechanics of Aerosols Pergamon Press, Oxford England,
1964
NEA/CSNI/R(2009)5
130
3.15 Penetration Leakages
3.15.1 Introduction
An understanding of the aerosol-removal and transport in containment leak paths is important both from
the perspective of calculating the amount of airborne activity released into the environment and in
estimating the doses to containment for equipment qualification and habitability assessment.
In the event of a reactor accident in which the containment envelope becomes pressurised, there is a
potential for aerosol and gas leakage to the outside atmosphere through a variety of paths that can be
categorised as belonging to one of three general types:
•
valves and seals
•
concrete joints, cracks and penetration gaps (e.g., process and control wiring and piping), and
•
pores in intact concrete.
Leakage past seals and valves in containment would involve a sudden change in the flow cross-sectional
area and short path lengths relative to those of the other flow paths. Leak paths along concrete-penetration
gaps, joints and cracks are more tortuous and significantly longer. Finally, leak paths through concrete
pores are characterised by small diameter cross-sectional areas, long and complex flow channels and high
flow resistances. Depending upon the temperature of and flow through these paths, and the size of the
aerosols, significant aerosol retention might be expected. However, many safety analyses still assume that
aerosol release rates and gas release rates are identical.
Most experimental investigations on aerosol retention in leak paths [1, 2, 3, 4] have focused on small leaks
and capillaries of diameters ranging from few microns to few millimetres, submitted to pressured
differences up to several bars. However, large scale experiments were conducted in the Containment
System Experiments (CSE) programme which used a one-fifth linear scale model of a typical 1000 MWe
PWR [5]. The CSE results indicated aerosol decontamination factors from 10 to 100 under dry conditions
(15 for iodine and 100 for cesium), and complete retention under wet conditions. More recently, [6]
performed large-scale experiments on actual containment penetrations of BWR containments and they
found decontamination factors for CsI under dry conditions ranging from 10 to 1000.
Some theoretical developments have been also undertaken. [7] proposed a broadly accepted correlation
(Equation 1) that relates the total aerosol mass, m (g), leaked before reaching a complete plugging of the
crack to duct of diameter D (cm
3
),
3
D
k
m
⋅
=
(1)
where k (30 ± 20 g/cm
3
) is an empirical constant determined by fitting data obtained from
straight and smooth ducts 20 µm to 26.5 cm in diameter with circular cross sections, submitted to pressure
differences ranging from 0.3 kPa to 0.7 MPa.
The theoretical basis for aerosol penetration in cracks was reviewed by [8]. However, a mechanistic model
based upon this theory would be too complex to be implemented in current safety analyses codes.
Intermediate approaches between empirical correlations and mechanistic models look to be the most
promising. Anyway, whatever modelling nature, models used in containment codes must be validated over
a range of conditions (e.g., leak path geometries, temperatures, pressures etc.,) that may be reactor and
accident specific. Presently, existing models are not mature enough and a sound, reliable and representative
database against which to validate them is still missing.

NEA/CSNI/R(2009)5
131
The first subchapter presents the status of current modelling and experimental studies on aerosol leakage.
The first summary describes work being carried out within the Severe Accident Research NETwork
(SARNET) project of the 6
th
Framework Programme of the European Commission, and it is based on a
recent paper presented at the International Conference on Nuclear Energy for New Europe 2005 by [9].
The second subchapter is CANDU specific work being performed at AECL to characterise wet aerosol
leakage through containment leak path geometries.
3.15.2 Current modelling and experimental studies
The factors influencing aerosol retention in a leak path have been identified and classified as follows:
•
Thermo-hydraulics; the most important variables are the pressure inside the containment, the
gas composition, the pressure drop and the wall temperature along the crack. Factors which
influence steam condensation onto crack surfaces will be particularly relevant.
•
Crack geometry; the important parameters are primarily the crack path length and hydraulic
diameter; crack section shape (likely flat) and curvature are also very important.
•
Aerosol characteristics; the reference parameters would be in-containment average
composition, concentration and size distribution.
It is worth noting that variables considered highly uncertain at the time the leak path initiates (like
composition and morphology of aerosols), have been disregarded. Otherwise, accurate models relying on
those variables would not yield reliable estimates.
The values of these variables should encompass two bounding scenarios: the “short term scenario”, in
which energetic phenomena, such as hydrogen deflagrations and/or steam explosions might result in an
early containment impairment; and the “long term scenario” where steam and gas released from the molten
core-concrete interaction would cause containment over-pressurization. In the former, the in-containment
aerosol concentration could reach high values (1-10 g/m
3
) and size distribution would be shifted toward
particles of the order of some microns. In the latter, the aerosol concentration would be lower and the size
distribution would be weighed more heavily in the range of sub-micron particles. According to
experimental data available, the maximum interest from a safety point of view should be placed on
particles around 0.1 µm (since they would undergo the lowest retention).
Table 3.15-1 Some variables influencing the aerosol retention inside containment cracks
Crack path ≥ wall thickness (1.0 – 1.4 m)
Crack cross section and shape << 2-3 cm
2
- flat, in the case of long term scenario
Containment internal pressure 5 – 10 bar
Crack surface temperature room to containment gas temperature
Atmosphere composition depending on accident scenario and evolution
Aerosol size distribution 0.1 – 5 µm
Two different approaches are being used to model aerosol retention: Eulerian and Lagrangian. A brief
description is given next. In-crack flow dynamics and heat transfer studies [10, 11], even though highly
important for aerosol behaviour, are not reported here.

NEA/CSNI/R(2009)5
132
An experimental programme on aerosol retention within concrete cracks is being conducted by
IRSN [12, 13]. Reinforced concrete samples (128 cm x 75 cm x 10 cm) are being subjected to shear
stresses up to 645 kN. The resulting cracked wall is placed between two identical sealed boxes.
Fluorescein particles are injected in the upstream box and their mass concentration is measured in
both upstream and downstream boxes. Particles having diameters of 1
µm and 4 µm in dry
atmospheres have been tested so far, and it is planned to conduct tests with 50 nm-particles. The
maximum pressure drop across the wall has been 80 mbar
.
Fig 3.15-1 is a scheme of the IRSN facility.
Fig. 3.15-1 IRSN facility to investigate aerosol retention in containment cracks
Total retention of aerosol particles was observed for 4 µm particles under all the velocities tested.
However, only a fraction of the 1 µm aerosols was retained. The main retention mechanisms involved were
diffusion, sedimentation and impaction (at the crack inlet). Experiments with air-steam mixtures are
planned to study the effect of wet conditions in the crack decontamination factor.
Presently, another experimental facility, named COLIMA (CEA), is being considered as a future candidate
in which to conduct experiments since it has appealing characteristics like the ability to generate
prototypical MCCI aerosols, design pressure and temperature of 5 bar and 140 ºC, respectively, and the
capability of producing steam.
3.15.3 Measurement of the retention of wet aerosols
Wet aerosols (droplets containing suspended or dissolved fission products) are more prevalent than dry
aerosols in most postulated design basis CANDU accident scenarios. However, the published literature on
aerosol behaviour in containment leak paths is predominantly for dry aerosols, as are the empirical
correlations used to describe the behaviour. Although some empirical deposition models may be applicable
to wet aerosol behaviour, aerosol characteristics such as particle shape, and deposit characteristics (fluid
rather than solid) could cause somewhat different behaviour in potential leak paths. Over the past few
years, experiments and modelling studies have been performed at AECL to characterise wet aerosol
leakage through containment leak path geometries. The following section describes experiments on aerosol
droplet deposition and transport through paths that are representative of seals and valves in containment.
P
1
-Patm
P
1
P
2
∆P=P
1
-P
2
Pressure regulator
Pressure gauges
Upstream aerosol box Downstream aerosol box
Wall cracked by shear loading
10 cm
Cracks
Pump
Valve
HEPA sampling
Filter
Fluoresceine
Aerosol
(known
particles
massflow)
Mass
Flowmeter
C
downstream
Vibrating Orifice
Aerosol Generator
Filter
Excess
Neutralisation
source
(600 MBq
85
Kr)
C
upstream
P
1
-Patm
P
1
P
2
∆P=P
1
-P
2
Pressure regulator
Pressure gauges
Upstream aerosol box Downstream aerosol box
Wall cracked by shear loading
10 cm
Cracks
Pump
Valve
HEPA sampling
Filter
Fluoresceine
Aerosol
(known
particles
massflow)
Mass
Flowmeter
C
downstream
Vibrating Orifice
Aerosol Generator
Filter
Excess
Neutralisation
source
(600 MBq
85
Kr)
C
upstream
NEA/CSNI/R(2009)5
133
Flow paths and conditions
As described earlier, aerosol leakage through valves and airlock-door seals in containment will be
characterised by an abrupt change in the cross-sectional flow area, where gas and aerosol flows move from
a high pressure (containment) region, through small gaps resulting from seals or valves being improperly
seated, to a lower pressure region. A diagram of the generalised leak path through a single contraction is
shown in Fig. 3.15-2. Note that the leak path from containment to the environment through airlock door
seals and isolation valves generally involves more than one such abrupt contraction.
Fig. 3.15-2 Diagram of a generalised leak path
The abrupt change in flow area for a pressurised flow is expected to lead to aerosol leakage occurring
under choked-flow (or sonic) conditions at the contracted portions of the leak paths. The flow through an
opening of a given diameter increases with increasing pressure differential until a pressure wave, created
within or near the exit of the orifice, results in sonic flow. A further reduction in downstream pressure
cannot increase the velocity through the opening, and the gas velocity through the hole will be maintained
at the speed of sound
6
. A choked-flow condition results in a constant mass-flow rate, at the speed of sound,
through a nozzle or an opening. The criterion for choked flow is a downstream absolute pressure of less
than 53 % (for air) of the upstream absolute pressure [14].
An experimental benefit resulting from a choked-flow condition is that the leak paths are self-regulating to
ensure a constant flow rate. Choked-flow conditions can be achieved by either pressurising the upstream
side of the leak paths or by maintaining a sufficiently low pressure downstream of the leak paths to ensure
that the downstream-to-upstream pressure ratio is lower than 0.53
7
. The latter choice was selected because
it was expected to adequately simulate aerosol leakage from containment, but without the experimental
difficulties associated with a design in which the upstream chamber would be at an elevated pressure.
Experiments
Experiments on aerosol leakage were performed in a cubic plexi-glass chamber fitted with an aerosol
characterization port and a pair of filtration ports. The filtration ports are shown schematically in Fig.
3.15-3. A deflector was installed above each port to prevent collection of surface runoff from the vertical
surface in to the port entrance. The constricted leak path portion of an isolation-damper valve was
simulated using commercially available copper tubing, with diameters and lengths representative of
6
The sonic velocity U
sonic
(m·s
-1
) for a gas is: where: R = gas constant (=287 m·N·kg
-1
·K
-1
), T
u
= upstream temperature (K) and =
specific heat ratio (= 1.4) [15].
7
The atmospheric (101 kPa) to containment (225 kPa) pressure ratio following an accident is estimated to be 0.45 in CANDU
reactors.

NEA/CSNI/R(2009)5
134
damper valve leak paths possible in CANDU stations. The simulated constricted flow path of the
airlock-door seals was fabricated in-house, using cylindrical copper tubing of much smaller dimensions.
Fig. 3.15-3 Schematic of filtration sampling lines
The filtration assembly shown in Fig. 3.15-3 consisted of two separate flow lines (U1 and U2) containing
matched leak paths. The U1 line consisted of a high efficiency filter assembly to collect water droplets,
upstream of the prototypical leak path, whereas in the U2 line, the filter assembly was positioned
downstream of the leak path. Each line was connected to a rotameter through a valve to measure the flow;
the valves were used to match the flow rates through the U1 and U2 lines. A vacuum pump was connected
to the downstream port of the rotameters to maintain low pressures and ensure choked-flow conditions
through the leak path.
A Cyclone Fogger (Curtis Dyna-Fog
®
, Model 3000) containing a solution of an uranine dye in water was
used for aerosol generation. The uranine (sodium fluorescein) dye fluoresces at a characteristic wavelength
and concentrations of the uranine-water retained on the filter assemblies and in the leak paths were
determined using fluorescence spectrophotometry. In a typical experiment, the vacuum pump was started,
and the flow valves for each line were adjusted so that the rotameter reading on each line was the same.
The fogger was switched on to inject aerosols into the cubic reservoir, and a phase-Doppler anemometer
(PDA) focused through the aerosol characterisation port was used to measure the mean (average) diameter
of wet aerosols. The mean droplet size generated for these experiments was 9.7 µm. Droplet mass
concentration was not measured, but can be estimated from the ratio of the aerosol injection rate and the
volumetric flow rate through the filtration port to be around 5 g·m
-3
for the isolation damper valve
experiments. The experiments described here were performed at ambient temperatures.
Filters and leak path assemblies were removed after each experiment and washed thoroughly with known
quantities of distilled water, to re-dissolve the deposited uranine dye. Samples of the filter and leak path
washes were then submitted for fluorescence analysis to determine the uranine concentration. The
aerosol-penetration and aerosol-deposition efficiencies were estimated directly from the measured uranine
concentrations. The method has been adapted from one reported by [16].
Results in Table 3.15-2 show that for the simulated damper-valve leak paths, the average penetration
efficiency,, is 36 % ± 5% (1σ), and the average deposition efficiency,, is 64 % ± 6 % (1σ). There is no
significant effect of tube length on the deposition efficiency. For airlock-door seal leak paths, the average
penetration efficiency,, is 80 % ± 2 % (1σ), and the average deposition efficiency,, is 20 % ± 2 % (1σ).

NEA/CSNI/R(2009)5
135
Table 3.15-2 Retention and transmission efficiency in an idealised isolation-damper valve contraction
Test No.
I
p
η
(%)
I
d
η
(%)
(a) 9-cm long tube
D9R1
D9R2
D9R3
46
26
37
54
74
63
(b) 6-cm long tube
D6R1
D6R2
D6R3
44
36
34
56
64
66
(c) 3-cm long tube
D3R1
D3R2
D3R3
34
35
31
66
65
69
Average 36 64
Table 3.15-3 Retention and transmission efficiency in an idealised airlock-door seal leak contraction
Test No.
II
p
η
(%)
II
d
η
(%)
II
d
II
p
ηη
+ (%)
I
p
η
(%)
I
d
η
(%)
0.6-cm long tube
A6R1
A6R2
A6R3
113
69
85
33
17
18
146
86
103
77
80
82
23
20
18
Average 89 23 112 80 20
Leak path plugging
From earlier measurements of depressurisation tests performed with a simulated isolation-damper valve
leak paths, it was shown that the post-accident elevated pressure in a CANDU containment building would
level off (from 140 kPa(g) to zero) in about 15 minutes. Hence, tests were performed to monitor aerosol
flow through the U2 lines for the same duration of time to examine whether leak path plugging would
occur. The experiments indicated that there would be no leak path plugging during containment
overpressurization for an aerosol mass density of about 5 g·m
-3
.
NEA/CSNI/R(2009)5
136
References
[1] C.T. Nelson, R.P. Johnson Aerosol leakage tests -Status of Technology for Radiological
Consequence Assessment of postulated Accidents in LMFBR’s, ERDA-56, Springfield, USA, 1975
[2] S.L. Sutter Depleted Uranium Dioxide Powder Flow Through Very Small Openings NUREG/CR-
1099, PNL-3177, 1979
[3] J.P. Mitchell, R.T. Edwards, H.M.E. Ball The Penetration of aerosols Through Fine Capillaries
Journal of Radioactive Materials Transport (RAMTRANS), n. 3, 5-17, 1992
[4] D.A.V. Morton, J.P. Mitchell Aerosol Penetration through Capillaries and Leaks: Experimental
Studies on the Influence of Pressure Journal of Aerosol Science, n. 26, pp 353-367, 1995
[5] R.K. Hilliard, A.K. Postma Large-Scale Fission Product Containment Tests
Nuclear Technology,
Vol. 53, n. 2, pp 163-175, 1981
[6] A. Watanabe, T. Hashimoto, M. Osaki Fission Product Aerosol Trapping Effects in the Leakage
Path of Containment Penetration under Severe Accident Conditions in Proc. 3
rd
OECD Specialist
Meeting on Nuclear Aerosols in Reactor Safety, Cologne, Germany, 1998
[7] E.U. Vaughan Simple Model for Plugging of Ducts by Aerosol Deposits Trans. Am. Nucl. Soc., 28,
507, 1978
[8] C.F. Clement Aerosol Penetration through Capillaries and Leaks: Theory Journal of Aerosol
Science, 26, 369, 1995
[9] F. Parozzi, S. Paci ECART Code Integrated Approach for Thermal-Hydraulic-Source Term
Analysis, Proc. 4
th
International Conference on Nuclear Option in Countries with Small and Medium
Electricity Grids, 16-20 June, 2002, Dubrovnik, Croatia, 2002
[10] H. Simon, N. Coulon, R. Tomassian, G. Nahas A model for two-phase flow through small opening
cracks 4
th
European Thermal Sciences Conference, 29-31 March 2004, Birmingham, UK, 2004
[11] H. Simon, N. Coulon, R. Tomassian, G. Nahas Air-steam leakage through cracks in concrete walls.
NURETH-11, 2-6 October, 2005, Avignon, France
[12] T. Gelain, F. Gensdarmes, J. VendelExperimental study on aerosol penetration through cracked
concrete wall, Congress EAC 2004 Budapest, September 6-10, 2004
[13] T. Gelain, J. VendelDétermination de modèles de dépôt d'aérosols dans un réseau de fissures,
Congrès français sur les aérosols (CFA) Paris 14-15 décembre 2005
[14] H.C. HindsAerosol Technology: Properties, Behaviour, and Measurement of Airborne Particles,
John Wiley & Sons, Toronto, 1982
[15] V.L. Streeter, E.B. Wylie Fluid Mechanics, McGraw-Hill Book Co., New York, 1979
[16] J.K. Agarwal Aerosol Sampling and Transport Ph.D. Thesis, University of Minnesota, 1975
NEA/CSNI/R(2009)5
137
4. MODELLING APPROACHES IN CODES (INCLUDING BASIC VALIDATION)
4.1 Integral Codes
4.1.1 MELCOR
4.1.1.1 Introduction
MELCOR [1] is a systems-level model for the prediction of the progression of accidents in light water
nuclear power reactors and other nuclear facilities. It was developed initially by the U.S. Nuclear
Regulatory Commission (NRC) as a model to support the quantitative estimation of risk to the public
associated with nuclear facilities and especially nuclear power plants. This initial thrust of code
development has been augmented, and MELCOR has become a tool for the mechanistic analysis of reactor
accidents. MELCOR has become the repository used by the NRC for the preservation of knowledge and
understanding of severe accidents developed in a variety of experimental and analytical research efforts.
For the purposes of reactor accident analyses, the code is intended to predict accident progression from the
initiating event, to the point of core uncovery, through vessel failure and the expulsion of core debris into
the containment, to the point of containment failure and the prolonged escape of radioactive materials into
the nuclear power plant environment. The MELCOR code provides input to a companion code, MACCS,
for the analysis of radioactive material dispersion in the environment and the consequences of this
dispersion.
The MELCOR code has a substantial, world-wide community of users. The code has a rather flexible
architecture so that it can be used to predict accident progression in many different types of nuclear
reactors. MELCOR is also applied to the prediction of accident progression in facilities for processing of
nuclear materials especially for accidents involving fires.
The MELCOR code was developed initially as a systems-level analysis code and was not intended for the
analysis of experiments. Instead, it was envisaged that the code would adopt and adapt essential features
though not all the detailed features of computer codes used for the analysis of major experiments. This has
been done in many cases as will become apparent in the discussion below of the major “packages” in the
MELCOR code. There has been, however, an increasing willingness to use the systems-level code directly
for the analysis of major experiments. It is a statement concerning the flexible architecture of the code that
such analyses are possible. It is also a statement concerning the increase in capabilities of routinely
available computational devices that the MELCOR code continues to be developed in the direction of ever
more detailed descriptions of accident phenomena. The MELCOR code has become, consequently, an
important tool in the drive to make the safety regulation of nuclear power plants based ever more on
realistic rather than overly conservative depictions of accident phenomena.
4.1.1.2 Major MELCOR “packages”
The MELCOR computer code consists of a number of “packages” that address particular aspects of reactor
accident analyses. The more important of these packages are listed in Table 4.1-1. Most of the packages in
MELCOR are associated with the analysis of reactor core and structure degradation. The RN package is
devoted to the prediction of radionuclide behaviour under accident conditions. The RN package will be the
focus of the discussions in this brief description of the MELCOR computer code.

NEA/CSNI/R(2009)5
138
Table 4.1-1 Pertinent 'packages' in the MELCOR computer code for reactor accident analysis
Symbol Package Name Description
EXEC
Executive Package Responsible for overall execution control of the calculations
BUR
Burn Package models the combustion of gases in control volumes
CAV
Cavity Package
Models the attack on the basemat concrete by hot or even
molten core materials
CND
Condenser Package
Models the effects of Isolation Condenser Systems and
Passive Containment Cooling Systems found in some boiling
water reactors
CF
Control Function
Package
Allows users to modify the modeling in MELCOR by
defining functions of variables in the MELCOR database and
make the values of these functions available to other
MELCOR packages
COR
Core Package
Calculates the thermal response of the reactor core, the lower
plenum internal structures, core internal support structures
and the reactor vessel lower head.
CVH
Control Volume
Hydrodynamics
Package
Modeling of the thermal-hydraulic behaviour of liquid water,
water vapor and gases in control volumes
DCH
Decay Heat
Package
Models the decay heat power from fission products
FCL
Fan Cooler
Package
Models the heat and mass transfer associated with operation
of fan coolers in the reactor containment
FDI
Fuel Dispersal
Package
Models fuel expulsion from the reactor vessel to the reactor
cavity. This includes modeling high pressure melt ejection
and the dispersal of core debris over several volumes
FL
Flow Path Package
Description of interconnection of volumes and the
condensation or evaporation of water along flow paths.
HS
Heat Structures
Package
Models energy transfer to and within structures
MP
Material Properties
Package
Models thermophysical properties of materials needed in the
modeling done in other packages
NCG
Noncondensible
Gas Package
Models noncondensible gases as ideal gases.
PAR
Passive
Autocatalytic
Hydrogen
Recombiner
Package
Calculates the removal of hydrogen from the containment
atmosphere caused by the operation of passive hydrogen
recombiners
RN
Radionuclide
Package
Models release, transport and behaviour of radionuclides
SPR
Containment Spray
Package
Models heat and mass transport between spray droplets and
the containment atmosphere

NEA/CSNI/R(2009)5
139
The MELCOR code categorises radionuclides and other pertinent materials into elemental classes that
exhibit similar chemistry. The default classes are listed in Table 4.1-2. Users of the code can define
additional classes to track particular materials more exactly. The behaviours of all the materials in a class
are tracked based on the predicted behaviour of a particular representative of the class. The representatives
of the default classes are also shown in Table 4.1-2.
Table 4.1-2 Material classes in MELCOR
Class Name Representative Member Elements
1 Noble Gas Xe He, Ne, Ar, Kr, Xe, H
2
and N
2
2 Alkali Metals Cs Li, Na, K, Rb, Cs, Fr, Cu
3 Alkaline Earths Ba Be, Mg, Ca, Sr, Ba, Ra, Es, Fm
4 Halogens I F, Cl, Br, I At
5 Chalcogens Te O, S, Se, Te, Po
6 Platinoids Ru Ru, Rh, Pd, Re, Os, Ir, Pt, Au, Ni
7 Early Transition
Elements
Mo V, Cr, Fe, Co, Mn, Nb, Mo, Tc, Ta, W
8 Tetravalents Ce Ti, Zr, Hf, Ce, Th, Pa, Np, Pu, C
9 Trivalents La Al, Sc, Y La, Ac, Pr, Nd, Pm, Sm, Eu,
Gd, Tb, Dy, Ho, Er, Tm, Yb, Lu, Am,
Cm, Bk, Cf
10 Uranium U U
11 More Volatile Main
Group
Cd Cd, Hg, Zn, As, Sb, Pb, Tl, Bi
12 Less Volatile Main
Group
Sn Ga, Ge, In, Sn, Ag
13 Boron B B, Si, P
14 Water H
2
O H
2
O
15 Concrete - -
16 Cesium iodide CsI CsI
The MELCOR code treatment of radionuclides includes:
•
Release of radionuclides from intact fuel and from core debris,
•
Transport and deposition of radionuclide vapors and aerosols through the reactor coolant system,
•
Behaviour of radionuclides and radioactive aerosols in the reactor containment, and
•
Effects of engineered safety systems on the amount of radioactive material that can be released
from the reactor containment.
Each of these aspects of the code is discussed in subsections that follow.
NEA/CSNI/R(2009)5
140
Radionuclide release from fuel
MELCOR considers radionuclide release from fuel both within the reactor vessel and when reactor fuel has
been expelled from the reactor coolant system into the containment. Radionuclide release from fuel within
the reactor vessel can be calculated using one of three closely related models:
•
CORSOR,
•
CORSOR-M, and
•
CORSOR-Booth
All three of these models have an empirical relationship to tests of fission product release from fuel heated
usually out of pile. Most users now prefer the CORSOR-Booth model. Diffusion coefficients in this model
have been upgraded to match well more recent tests such as those being done as part of the PHÉBUS-FP
project.
Ex-vessel release of radionuclides is done with the VANESA model [2] developed based on experimental
data explicitly for this purpose. The model considers fission product release by vaporization into bubbles
of gas sparging through core debris attacking structural concrete. It also considers the mechanical
formation of aerosols due to the bursting of bubbles at the surface of molten core debris. Radionuclide
release can be retarded substantially by the presence of a water pool over the surface of the core debris.
Modeling of this attenuation of the ex-vessel release is akin to that used in MELCOR to model
decontamination of aerosol-laden gas flows through steam suppression pools.
Aerosol nucleation from vapors
MELCOR does not explicitly model the nucleation of aerosols from vapors that cool once they escape core
debris. Extensive numerical experimentation has shown that the details of nucleation are quickly
obliterated by the rapid coagulation of fine particles as predicted by the model of aerosol dynamics
discussed below. Consequently, once vapor reaches saturation, saturation is relieved by condensation on
surfaces and nucleation of particles that are assumed to be in the smallest size bin of the aerosol dynamics
model. Water vapor is allowed by the MELCOR code to form aerosols called ‘fog’ in the code. These
water droplets can interact with other types of aerosol particles.
Aerosol dynamics
Modeling of the agglomeration and deposition of aerosol particles is done in MELCOR using the
MAEROS model. The MAEROS model was developed by Gelbard [3] and is one of the earliest models to
use the sectional method for the prediction of aerosol behaviour in a control volume. MAEROS is both
multisectional and multicomponent. A model for hygroscopicity effects is available in MELCOR. Each
size class considered in MAEROS can have a different chemical composition. Deposition mechanisms
considered in MAEROS are:
•
Gravitational settling,
•
Diffusion,
•
Thermophoresis, and
•
Diffusiophoresis
MELCOR does not currently treat inertial deposition processes.
NEA/CSNI/R(2009)5
141
Vapor deposition
MELCOR considers vapor deposition by condensation. There is also the capability to model vapor
chemisorption onto surfaces. This aspect of the modeling is undergoing re-examination in comparison to
the more comprehensive vapor deposition modeling found in the VICTORIA code which is described
elsewhere in this report.
Engineered safety features
The MELCOR code considers the effects of engineered safety features on aerosols. Specific features that
are modeled include decontamination by:
•
Steam suppression pools
•
Sprays
•
Ice beds
•
Filters
•
Fan coolers
Decontamination by steam suppression pools is done with the SPARC90 model [4] developed for the
NRC. This model calculates removal of both aerosol and iodine gas from gases sparging through
suppression pools. The spray model allows a distribution of droplet sizes but does not now mechanistically
calculate droplet-droplet interactions. Models for decontamination by filters and fan coolers are rather
simple and have not received a great deal of attention.
4.1.1.3 Code status
The MELCOR code is widely used for both regulatory and safety analysis purposes. The code is finding
increased use for the safety analysis of non-reactor nuclear facilities in addition to continued use for
analysis of reactor accidents. The code is still being actively maintained and developed. A new version of
the code was released in 2005. A FORTRAN 95 version of the code is expected in 2006. Following release
of the FORTRAN 95 code version, much of the development effort will be devoted to an extensive
comparison of code predictions to test results and documentation of the validation status of the code.
Because of the flexibility of the MELCOR design and the component nature of the package architecture, it
is felt that the MELCOR code will be adaptable to the assessment of future reactor designs.
References
[1] R.O. Gauntt, R.K. Cole, C.M. Erickson, R.G. Gido, R.D. Gasser, S.B. Rodriquez, and M.F. Young,
MELCOR Computer Code Manuals, NUREG/CR-6119, Volumes 1-3, Sandia National
Laboratories, Albuquerque, NM, December 2000
[2] D.A. Powers, J.E. Brockmann, A.W. Shiver, VANESA: A Mechanistic Model of Radionuclide
Release and Aerosol Generation during Core Debris Interactions with Concrete, NUREG/CR-4308,
Sandia National Laboratories, Albuquerque, NM, July 1986
[3] F.Gelbard MAEROS User Manual, NUREG/CR-1391, Sandia National Laboratories, Albuquerque,
NM, December 1982
[4] P.C. Owczarski and K.W. Burk, SPARC-90: A Code for Calculating Fission Product Capture in
Suppression Pools, NUREG/CR-5765, Pacific Northwest Laboratory, Richland, WA, October 1991
NEA/CSNI/R(2009)5
142
4.1.2 ASTEC (SOPHAEROS and CPA)
4.1.2.1 An overview of the ASTEC/SOPHAEROS code
Introduction
The ASTEC/SOPHAEROS code, developed by IRSN as part of the IRSN-GRS ASTEC integral code [1],
models radionuclide transport in the reactor coolant system (RCS). The main features of the code in its
current version (v1.2) are described here along with an outline of validation activities and development
work. The principal use of ASTEC/S
OPHAEROS arises from the following applications:
−
IRSN has performed a Probabilistic Safety Analysis level 2 for French 900 MWe PWRs using
ASTEC and is set to start a PSA level 2 for 1300 MWe PWRs using ASTEC v1.3;
−
SOPHAEROS-IST 2.0 (corresponding to SOPHAEROS v2.0 with some generic and CANDU-specific
improvements implemented by AECL) is the Canadian Industry Standard Toolset code for analysing
FP transport in the RCS of CANDU reactors [2];
−
ASTEC/SOPHAEROS was used and validated in a European context through the EVITA project [3],
part of the European Commission’s 5
th
Framework Programme;
−
The ASTEC V1 code has been distributed internationally in the context of the SARNET network of
excellence, part of the European Union’s 6
th
Framework Programme.
Overview of modelling
The basic element of ASTEC/SOPHAEROS modelling is the control volume where the RCS must be
described as a sequence of volumes, each comprising one or several freely-oriented truncated cones.
Arbitrary geometries can be dealt with involving, e. g., bifurcations, closed loops, etc. Within each control
volume, the modelled vapor and aerosol phenomena are summarised in
Table 4.1-3 where the associated literature source and/or a brief description for each model is provided.
A chemical element is partitioned among its possible chemical species via the use of an independent
thermochemical database. ASTEC/S
OPHAEROS v1.2 operates with a comprehensive database covering
65 elements generating 747 compounds. Recent restructuring of the numerical solver for
ASTEC/S
OPHAEROS V1.2 allows this database to be used routinely (a reduced database exists which was
once of interest in reducing calculation time by covering just over 100 chemical species but can now be
considered obsolete). Each chemical species can exist in one of five physical states: vapor; vapor
condensed on a wall; vapor sorbed on a wall; aerosol and deposited aerosol. The fraction of a species
converted into condensed or deposited states no longer participates in the chemistry where this chemical
inactivation is permanent unless revaporization occurs. Aerosol phenomena are handled by discretizing the
(arbitrary, freely evolving) size distribution over a user-determined, logarithmic grid of up to 50 size
classes. Use of a large number of size classes is particularly important in situations where homogeneous
nucleation, heterogeneous nucleation, or agglomeration is important. S
OPHAEROS is supplied with thermal-
hydraulic conditions via coupling to the ASTEC/CESAR module.

NEA/CSNI/R(2009)5
143
Table 4.1-3 Phenomena modelled in ASTEC/SOPHAEROS v1.2
Mechanism Literature source and/or brief description
V P
a h
p e
o n
u o
r m
e
n
a
vapor-phase chemistry Equilibrium; comprehensive database (800
species).
homogeneous nucleation [4] for condensation rate.
heterogeneous nucleation
(reversible)
Brownian-diffusion-limited mass transfer onto a
sphere, inclusion of Mason effect [5].
sorption on metal-alloy surfaces Empirical velocities as a function of temperature.
condensation on surfaces
(reversible)
Chilton-Colburn analogy [6];
laminar, Nu=3.66 (cylinder); turbulent [7]
A P
e h
r e
o n
s o
o m
l e
n
a
sedimentation Stokes’ velocity with Cunningham correction.
turbulent (eddy) impaction [8]
diffusion laminar (Brownian)
turbulent
[9] laminar;
[10] turbulent.
thermophoresis [11]
diffusiophoresis Based on Stefan velocity [17]: [14] for free-
molecular regime; option [15,16] more general.
inertial impaction in bends Hybrid model based on [18] for laminar flow, [19]
for turbulence; option of centrifugal model.
inertial impaction in geometrical
contractions
[23] or [24] depending on contraction angle
agglomeration Brownian,
gravit-ational,
turbulent
[20] continuum regime, [12] free-molecular
regime; [21] gravitational; [22] turbulent.
mechanical resuspension Semi-empirical resultant-force model devised for
the ECART code, retuned by GRS [25];
optional model based on [26].
Numerical method
The mass-balance equations resulting from the intra-volume phenomena combined with inter-volume
transport produce a non-linear system solved numerically by a Newton-Raphson method. To illustrate how
the code deals with the diverse phenomenology involved in the transport process, we take the aerosol state
(state 2 in S
OPHAEROS, hence suffix 2 below) entailing the following mass-conservation equation for a
given aerosol size class
i:

NEA/CSNI/R(2009)5
144
where, taking each right-hand-side term successively,
s is an aerosol source rate,
τ
f
are flow-dependent transport rates into and out of the volume,
is a compound term representing particle agglomeration into and out of size class
i,
is a compound term representing heterogeneous nucleation onto smaller particles bringing mass
into size class
i and evaporation from class i particles taking mass away,
τ
r
is the mechanical resuspension rate of class i deposited aerosols (state 4, hence suffix 4),
J
n
is the mass rate of formation of aerosols due to homogeneous nucleation of vapor species n where
the Dirac delta is zero except for
i=1, i.e., vapors seed into the smallest size class only.
Further details of the numeric method can be found in the theoretical manual for SOPHAEROS where,
notably, a full description of a number of matrix optimizations used to accelerate the solution scheme are
described.
Validation
A wide variety of data sources is employed for validation. Table 4.1-4 shows the currently-used experiments
where a full reassessment of the experimental database is underway (i.e., some cases may be abandoned while
others will be added).
Table 4.1-4 Current validation matrix
Test Type Project Character Tests Used Main Phenomena
aerosol
phenomena
LACE
consortium
aerosol,
large-scale,
semi-analytical
1
LA3B
• eddy impaction
• 90°-bend impaction
TUBA-T
IRSN
aerosol,
SGT-scale,
single-effect
9
TT14,22,24-31
• thermophoresis
TUBA-D
IRSN
aerosol,
SGT-scale,
analytical
12
TD01-TD12
• diffusiophoresis
• thermophoresis
TRANSAT
IRSN
aerosol,
large-scale,
semi-analytical
7
TR1, 2, 4-8
• eddy impaction
• 90°-bend impaction
• settling
DEPAT
IRSN
aerosol,
large-scale,
analytical
6
DEPAT01-03
DEPM01-03
• eddy impaction
n
vapours
n
iiiriidicondiaggiif
up
i
up
ifi
i
Jmmmmmms
d
t
dm
1
,1,4,,2,,,,2,,2,,2
,2
)(
=
Σ++−++−+=
δττττ
&&
iagg
m
,
&
icond
m
,
&

NEA/CSNI/R(2009)5
145
Test Type Project Character Tests Used Main Phenomena
ADPFF
AEA Tech.
aerosol,
full-scale,
analytical
15
WT10-23, 25
• eddy impaction
• 90°-bend impaction
• settling
STORM
CEC-ENEL
aerosol,
large-scale,
semi-analytical
SD 04, ISP 40
SR
(in progress)
• thermophoresis
• eddy impaction
•mechanical resuspension
vapor
& mixed
phenomena
DEVAP
IRSN-CEA
vapor,
small-scale,
analytical
7
8,13-15, 17, 18,
20
• chemisorption
• condensation
AERODEVAP
IRSN-CEA
aerosol/vapor
small-scale,
semi-analytical
3
01, 02, 04
•heterogeneous
nucleation
•condensation
•vapor-aerosol
interaction
Falcon
AEA Tech.
simulant fuel,
small-scale,
semi-analytical
4
Fal-17, 18, 19, 20
•vaporchemistry
• condensation
• vapor-aerosol
interaction
REVAP-ASSESS
4
th
Framework
vapor,
small-scale,
analytical
3
2 VTT tests,
Fal-25
• revaporization
integral
VERCORS HT
IRSN-EDF-CEA
irradiated fuel,
small-scale,
integral
3
HT1, 2, 3
(in progress)
• full range
HCE
COG
irradiated fuel,
small-scale,
integral
1
3 (in progress)
• full range
BTF
COG
irradiated fuel,
in-pile,
integral
1
104 (in progress)
• full range
PHÉBUS-PF
IRSN-CEC-EDF
irradiated fuel,
in-pile,
integral
3
FPT0, 1, 2, 4
(in progress)
• full range
Development
Future work is determined essentially on the basis of applications requirements and the feedback from
validation activities. Hence, in the shorter term, this work will include implementing models for more
complex geometries (e.g., steam generator secondary side as part of the ARTIST project, [12]) as well as
retention by water volumes that arise in the RCS, e.g., [13]. In addition, verification of all the
thermochemical data and completion of the species considered is in progress where the first stage of this
work was to compare the list of species used by S
OPHAEROS (originating mainly from the SGTE database
[14]) with species included in other database collections. The 65 elements dealt with have been prioritised
NEA/CSNI/R(2009)5
146
in terms of importance and the process of data verification is now well advanced. In the longer term,
development of physical models may address limited gas-phase chemical kinetics; this need arose from
feedback from PHÉBUS analyses leading IRSN to prepare the CHIP experiments studying gas-phase
chemistry for key iodine reactions. In the context of improved accident-analysis capabilities, the study of
cold-leg break sequences requires that steam condensation onto aerosols be examined.
References
[1] J.P. Van Dorsselaere, F. Jacq, H.-J. Allelein, B. Schwinges “ASTEC code status and applications”
US NRC CSARP meeting, Bethesda, USA, 5-7 May 2003 (2003)
[2] L.W. Dickson, R.S. DicksonFission-product transport and retention in the PHTS under accident
conditions”, 20
th
Annual Conference of the Canadian Nuclear Society, 30 May-2 June 1999,
Montreal, Canada, ISBN 0-919784-80-1 (1999)
[3] H.-J. Allelein, K. Neu, J.P. Van Dorsselaere, K. Müller, P. Kostka, M. Barnak, P. Matejovic, A.
Bujan, J. Slaby “European validation of the integral code ASTEC (EVITA)”
Nucl. Eng. Des. 221, 95-118 (2003)
[4] S.L. Girshick, C.P. Chiu, P.H. McMurray “Time dependent aerosol models and homogeneous
nucleation rates”, Aerosol Sci. Tech. 13, 465-477 (1990)
[5] B.J. Mason “The physics of clouds (2nd ed.)” Clarendon Press, Oxford (1971)
[6] T.H. Chilton, A.P. Colburn “Mass transfer (absorption) coefficients” Industrial and Engineering
Chemistry 26, 1183–1187 (1934)
[7] P.W. Dittus, L.M.K. Boelter “Heat transfer in automobile radiators of the tubular type” Univ.Calif. Pub.
Eng. 2 (13), 443–461 (1930) (re-published in Int. J. Comm. Heat and Mass Transfer 12, 3-22 (1985))
[8] B.Y. Liu, S.K. Agarwal “Experimental observation of aerosol in turbulent flow” J. Aerosol Sci., 5,
145-155 (1974)
[9] P.G. Gormley, M. Kennedy “Diffusion from a stream flowing through a cylindrical tube”, Proc.
Roy. Irish Academy, 52, 163 (1949)
[10] C.N. Davies “Aerosol Science” Academic Press (1966)
[11] L. Talbot, R.K. Cheng, R.W. Schefer, D.R. Willis “Thermophoresis of particles in a heated
boundary layer” J. Fluid Mech., 101, 737-758 (1980)
[12] S. Guentay, D. Suckow, A. Dehbi, R. Kapulla “ARTIST: introduction and first results”, Nucl. Eng.
Des. 231(1), 109-120 (2004)
[13] B.M. Schmitz “Pool scrubbing module SPARC-B/98 for Sophaeros v2mod0_1- model description”
GRS Technical Notice TN-SMZ-00-1 (2000)
[14] Landolt-Börnstein “Numerical data and functional relationships in Science and Technology, Group
IV: Physical Chemistry”, Volume 19: Thermodynamic properties of inorganic materials compiled by
SGTE, Subvolume A, Pure Substances’, Springer (1999)

NEA/CSNI/R(2009)5
147
4.1.2.2 ASTEC-CPA
The aerosol behaviour inside the containment is modelled in the ASTEC module CPA (Containment Part
of A
STEC), which is almost identical with the main COCOSYS modules THY and AFP. For the
description see chapter 4.3.2.
4.1.3 MAAP4
4.1.3.1 Brief description
The Modular Accident Analysis Program (MAAP) Version 4 is a computer code that simulates the
response of light water and heavy water moderated nuclear power plants, during severe accident
sequences. MAAP4 is an integrated code with capabilities to calculate the thermal-hydraulic response of
the core, the Reactor Coolant System (RCS), the containment and the auxiliary buildings, as well as the
fission product release, transport and deposition during postulated severe accident conditions [1]. MAAP4
is used in a wide range of plant evaluations including design basis evaluations, Level 1 and Level 2 success
criteria for probabilistic risk assessments, radiological source term assessments, and accident management
guidance evaluations. MAAP4 also includes a graphical interface, MAAP4-GRAAPH, enabling the user
to interactively interface with the code during execution, to modify the status of on-site power, pumps,
valves, etc., as well as, to directly observe the results [2].
4.1.3.2 Status
MAAP has been developed and maintained by Fauske & Associates Incorporated (FAI), since the
beginning of the code in 1981, under the sponsorship of the Electric Power Research Institute (EPRI) and
the MAAP Users Group (MUG). The code continues to be developed and maintained by FAI. Recent
versions include MAAP4-CANDU, that extend MAAP4 applicability to CANDU power plants. It should
be noted that the CANDU specific versions do not involve any changes to the previous fission product /
aerosols transport capabilities. Validation of MAAP4 was performed against HDR experiments, CORA
tests, TMI-2 accident, CSTF tests, FEBUS FPT0 test, ORNL VI test series, SFD tests at INEL, AP600
OSU tests, and LOFT experiments [3].
4.1.3.3 Modelling
Brief Description / Literature Source
Reactor Components
Modelled
• Reactor Core
•
Reactor Cooling System (RCS)
•
Containment
•
Reactor auxiliary buildings
Geometry Idealization
• A network of nodes inter-connected by flow paths
Inter-nodal Transport
• Transport of corium, water and gases including aerosols through
flow paths
Thermal hydraulics
• Modelled by mass and energy equations
•
Flow rates are determined from quasi-steady momentum balances
•
Pressure, temperatue and micellaneous thermodynamic properties
are determined from mass and energy of gaseous components in a
node.
Fission Product
Transport
• Fission products can exist in the solid, liquid, and vapor forms.
•
Twelve fission product compounds and three chemical compounds

NEA/CSNI/R(2009)5
148
Aerosol Transport
which affect the pH value in the water pool [4] are tracked by the
code.
•
In the primary system, fission products are not dissolved in the
water and hence are not transported by water, but only by carrier
gas.
•
In the containment, the dissolution of fission products in water pools
is modelled, and hence they are transported by both water and
carrier gas.
•
Fission product vapor - aerosol condensation/evaporation is
modelled by maintaining phase equilibria [1].
•
Vapor - surface condensation / evaporation is modelled by diffusion
[1].
•
Simultaneous aerosol growth by agglomeration and removal by a
number of aerosol deposition mechansisms are modelled by
empirical correlations specially developed for the code, based on a
principle of similarity and scaling [1, 5, 6,]. This empirical
approach differs from the traditional, time-consuming, detailed
calculations involving a solution of the Smoluchowski equation for
the evolution of particle size distribution, but results in reduced
computational time. The empirical approach considers the
Brownian and gravitational agglomeration and the aerosol removal
mechanisms listed below:
•
Sedimentation
•
Diffusiophoresis
•
Thermophoresis
•
Inertial impaction
References
[1] R.E. Henry, C.Y. Paik, M.G. Plys, “MAAP4 – Modular Accident Analysis Program for LWR Power
Plant - Code Structure and Theory, Computer Code Manual” Fauske & Associates Inc., prepared
for: Elecric Power Research Institute (EPRI), Volume 2, May 1994
[2] R.E. Henry, C.Y. Paik, M.G. Plys, “MAAP4 – Modular Accident Analysis Program for LWR Power
Plant – MAAP4-GRAAPH, Volume 4, Rev 0.0 / 0.1, May 1994 (Some Rev 0.1 updates to June
1995)
[3] R.E. Henry, C.Y. Paik, M.G. Plys, “MAAP4 – Modular Accident Analysis Program for LWR Power
Plant – Major Benchmarks” Fauske & Associates Inc., Volume 3A, Rev0.0 and 0.1, May 1994
[4] FAI Internal Memo from C.D. Wu to R .J. Hammersley, “Implementation of pH Model in MAAP4”,
October 8, 1993
[5] “Technical Support for Issue Resolution” Fauski and Associates Incorporated Report 85.27, July,
1985
[6] M. Epstein, P.G. Ellison, and R .E. Henry “Collelations of Aerosol Sedimentation” J. Colloid
Interface Sci., Vol. 113, No:2, October, 1986

NEA/CSNI/R(2009)5
149
4.1.4 THALES 2
The THALES-2 code [1] is an integrated severe accident analysis code developed at the Japan Atomic
Energy Research Institute (JAERI) in order to simulate the accident progression and transport of
radioactive materials for probabilistic safety assessment (PSA) of a nuclear power plant (NPP).
In 1982, JAERI developed, as a first step, the computer code system THALES [2] (T
hermal-Hydraulic
A
nalysis of Loss of Coolant Emergency Core Cooling and Severe Core Damage) for the analysis of
accident progression. In 1988, the code was combined with the ART (Analysis of Radionuclide Transport)
code [3] developed also by JAERI and the THALES/ART code system started. After that, the code system
was improved by coupling the radionuclide transports models with the thermal hydraulic ones and a
prototype of single code, namely, the THALES-2 code [1, 4] was completed in 1991. Then, the
abbreviation THALES was changed to the T
hermal Hydraulics and radionuclide behaviour Analysis of
L
ight water reactor to Estimate Source terms under severe accident conditions.
The code has also been validated through analyses of experiments [5] and comparison with other computer
codes [6, 7]. The THALES-2 code currently consists of BWR and PWR versions. Since the development
of BWR version [8] advances compared with the PWR version, the outlines of BWR version are described
below.
4.1.4.1 Overview of THALES-2 BWR
Accident progression
The THALES-2 BWR code [1, 7, 8]
calculates various physical phenomena such as thermal-hydraulics,
melt progression and radionuclide behaviour under the severe accident conditions. While progression of
core meltdown accidents are markedly different depending on the initiating event and the operability of
safety features, the THALES-2 BWR code postulates the accident progression such as described below.
1.
Either the direct release of the primary coolant due to a break at system boundary or the coolant boil
off ascribed to insufficient cooling during a transient causes decrease of the primary coolant
inventory. When no cooling function such as those by Emergency Core Cooling System (ECCS) is
unavailable, core will be uncovered.
2.
Fuel rods begin heatup when they are exposed to the steam over the mixture level. When the
temperature of a fuel rod rises high enough for activating Zr-H
2
O reaction, cladding oxidation occurs
and hydrogen is generated. Since this reaction is exothermic, it accelerates the core heatup. Further
heatup of the core results in core meltdown; fuel rods lose their own shape by melting or
fragmentation, and slump into lower part of the core. These slumping debris boil off the water
remaining in the lower part of the pressure vessel and heat up the support plate and the bottom bead.
Heated up support plate and bottom head lose their strength and finally the bottom head
melt-through occurs. After pressure vessel melt-through, corium-core debris together with structure
materials drops into the reactor cavity.
3. Containment pressure and temperature rise with blowdown of the primary coolant, gas generated by
concrete decomposition and hydrogen burning. After the reactor vessel failure, the molten material
falls down into the reactor cavity and core/concrete interaction is initiated. During the core/concrete
interaction, non-condensable gases are produced by the core/concrete interaction and the pressure in
the containment atmosphere begins to increase. When the sufficient cooling with the engineered
safety features such as the containment spray is unavailable, containment failure will occur and the
gases in the containment are released to the environment.
NEA/CSNI/R(2009)5
150
Environment of THALES-2 BWR
THALES-2 BWR code requires information for a configuration of a plant including geometrical data,
accident sequence (operational conditions of ECCS and operator actions), initial conditions of
thermal-hydraulics and so on. THALES-2 BWR code gives trends of thermal-hydraulic condition, mass
distribution of radionuclides, timing of events such as containment failure, and source terms.
THALES-2 is a highly modularised code system. The main part is supported by the subroutines, LOGIC1,
UCL2 and SPLPACK. The UCL2 is for unit conversion, which enables the user to prepare input data with
any unit, and the LOGIC1 for modeling the control circuit of safety-related system and for event control
which defines the accident sequence. The SPLPAC is used to support graphic functions of THALES-2.
Structure of THALES-2 BWR
In the THALES-2 BWR code, calculations of thermal-hydraulics, release of radionuclide from fuel,
radionuclide deposition and transport are performed at a given infinitesimal time increment δt. Fig. 4.1-1
shows data transfer inside the code. Firstly, thermal-hydraulic calculations are performed including the
melt-relocation. After that, release of radionuclides from fuel and molten materials are calculated. By using
these results, deposition and transport of radionuclide are calculated. Based on the results of radionuclide
distribution, decay heat in each phase in the volume are calculated and delivered to the thermal-hydraulic
calculation at the next time step t + δt.
THALES-2 uses three kinds of time increments for: 1) thermal-hydraulic in the containment system,
2) thermal-hydraulic in the reactor coolant system, and 3) radionuclide behaviour calculation. These three
time increments are automatically determined in the code.
4.1.4.2 Plant Model in THALES-2 BWR
Multiple-volume presentation of BWR plant
The multiple volumes representation is used in the THALES-2 BWR code to describe the mass/energy
transport radionuclide behaviour in LWRs plants. In this method, the primary and the containment systems
are divided into many volumes. Fig. 4.1-2 shows a typical configuration of volumes for a BWR with a
Mark-I containment

NEA/CSNI/R(2009)5
151
Fig. 4.1-1 Data transfer in THALES-2 BWR code system

NEA/CSNI/R(2009)5
152
Safety relief valve
Containment
Steam dome
Plenum
Core
Lower plenum
Loop ALoop B
Pedestal
Vent
pipe
Vent
pipe
Vacuum
breaker
Vacuum
breaker
Suppression pool
Suppression pool
Flow path for fluid and FP
Environment
Reactor building
Safety relief valve
Containment
Steam dome
Plenum
Core
Lower plenum
Loop ALoop B
Pedestal
Vent
pipe
Vent
pipe
Vacuum
breaker
Vacuum
breaker
Suppression pool
Suppression pool
Flow path for fluid and FP
Environment
Reactor building
Reactor coolant systems
Recirculation loop A
Recirculation loop B
Lower plenum
Core
Upper plenum
Steam dome
Downcomer
Control volumes
Containment systems
Pedestal
Drywell
Wetwell
Vent pipes
Others
Reactor building
Environment
Reactor coolant systems
Recirculation loop A
Recirculation loop B
Lower plenum
Core
Upper plenum
Steam dome
Downcomer
Control volumes
Containment systems
Pedestal
Drywell
Wetwell
Vent pipes
Others
Reactor building
Environment
Fig. 4.1-2 An example of multi-volume representation of a BWR/MARK-I plant
Concept of system, volume, junction and path
In the multiple-volume presentation, a plant is represented by a combination of 'system', 'volume', 'tank',
'path' and 'junction' which are briefly described below.
Volume: A unit of region such as recirculation loops, upper plenum and core,
System: A set of volumes, which have the same pressures are connected by junctions
Tank: A region in which coolant inventory changes such as condensate storage tank,
Junction: A model element to calculate mass/energy transport among volumes,
Path: A model element to calculate mass/energy transport among systems.
A concept of ‘system’ and ‘volume’ was introduced to realise fasten running capability without losing
accuracy. The system consists of volumes, which are combined by junctions and have the same pressure.

NEA/CSNI/R(2009)5
153
Some of 'system's and 'volume's in the THALES-2 BWR code are fixed to get fast running capability as
follows:
System
Volume
Reactor Coolant System Downcomer (DC), Lower Plenum (LWPL)
Core (CORE), Upper Plenum (UPPL)
Steam Dome (STMD),
Loop A (LOPA), Loop B (LOPB)
Drywell System Drywell (DRYW), Pedestal (CAVI)
Vent Pipe (VENT)
Wetwell System Wetwell (WETW)
User can define additional systems and volumes by input data. Each volume is further divided into a gas
region and a liquid region by a mixture level. The geometry of a volume maybe represented by several
cylindrical segments to calculate the correct mixture level.
Coolant sources outside systems such as the condensate storage tank are modeled by 'tank' which treats
only coolant inventory change. Fluid flow at a system boundary such as coolant injection by ECCS, break
flow and coolant release through safety and relief valves are modeled by 'path' which connects a volume
within a system and a tank outside a system. The path flows are used as a boundary condition of the
hydraulic calculation within a system, while the junction flow rates are given as a result of the hydraulic
calculation within the system.
As for radionuclide in volumes, six phases are defined to describe mass distribution of radionuclides as
follows:
Phase 1: Radionuclide of vapor form in gas region
Phase 2: Radionuclide of aerosol form in gas region
Phase 3: Radionuclide in liquid region or on the floor
Phase 4: Radionuclide of condensed form at structure surface
Phase 5: Radionuclide of aerosol form at structure surface
Phase 6: Radionuclide of absorbed form at structure surface
4.1.4.3 Outlines of radionuclide behaviour models
Radionuclide group
In the THALES-2 BWR, 20 radionuclides are classified into several groups (maximum 10) in terms of
their chemical characteristics. Typical elements or compounds of each group are Kr-Xe, CsI, CsOH, Te,
Sr, Ru, La and other particulates. An aerosol form is assumed in the code for Sr, Ru and La because their
vapor pressures are very low in severe accident conditions.
Total mass of radionuclides in the core are implemented by table data in the code for typical BWR plant.
The core inventory of plant concerned is given by a ratio of thermal power and inventory. In the
THALES-2 BWR code, a core region is represented by the groups of fuel assembly (maximum 5) and
vertical nodes (maximum 25). Distribution of radionuclide inventory in the core region is automatically
allocated to each core region in the code.

NEA/CSNI/R(2009)5
154
Radionuclide release from fuel
For radionuclide release from fuel before the reactor vessel failure (in-vessel), the CORSOR model and the
new model with pressure effect proposed by the VEGA program [9] are applied to calculate release rates of
radionuclides. After the vessel failure (ex-vessel release), the empirical model proposed by W.Murfin is
used to calculate generation rates of aerosols of concrete components during core/concrete interaction. In
addition, the CORSOR model is also applied to calculate release rates of radionuclides during the ex-vessel
release.
Radionuclide behaviour
The radionuclide transport models are illustrated in Fig. 4.1-3. In this code, radioactive materials can take
the form of gas, aerosol, deposit on structure walls and floors, and solution in water. The code solves the
governing equations for multi-component aerosol, taking into account the size growth by agglomeration
and condensation/evaporation of steam and volatile materials on the aerosol. Models are provided for
various transport processes, including the condensation/evaporation and chemical absorption of the gas
species at structure surfaces, deposition of aerosol to walls and floors, removal by sprays and filters,
scrubbing by water pools, and convection by liquid as well as gas flow.
Brownian
Agglomer ati on
Absorption
Turbulential
Agglomeration
Gr avitational
Agglomeration
Diffusion
Evaporation
Laminar,
Turbulent
Resuspension
Diffusion
Thermophoresis ,
Diffusiophore sis
Source
Interception
Im paction
Partition
Diff usi oph or esis
Decay
Filter
Leak
Filter
Source
Spray
Droplet
Partition
Scrubbing
Bubble
Flashing
Gas-Liquid
Partition
Gravitational
Settling
FP Transportation
by Gas Flow
FP Transportation
by Liquid Flow
Motion of Gaseous FP
Motion of Aerosol
Condensation
Diffusion
Gr avitational
Settling
Dissolution
Fig. 4.1-3 Radionuclide transport models in THALES-2 BWR
NEA/CSNI/R(2009)5
155
References
[1] M. Kajimoto et al."Development of THALES-2, A Computer Code for Coupled Thermal-Hydraulics
and FP Transport Analyses for Severe Accident at LWRs and Its Application to Analysis of FP
Revaporization Phenomena" Proc. Int. Topical Mtg. on Safety of Thermal Reactors, Portland, pp.
584-592 (1991)
[2] K. Abe et al."Overview of Development and Application of THALES Code System for Analyzing
Progression of Core Meltdown Accident of LWR’s" Proc. 2
nd
Int. Symp. on Nucl. Power Plant
Thermal Hydraulics and Operations, Tokyo (1986)
[3] T. Ishigami et al."User’s Manual of ART Code for Analyzing Fission Product Transport Behaviour
during Core Meltdown Accident" JAERI-M 88-093 (1988) (in Japanese)
[4] K. Muramatsu et al."Modeling Improvement and Application of the Integrated Severe Accident
Analysis code THALES-2 for Assessment of Accident Management Strategies" Proc. Int. Conf. on
Probabilistic Safety Assessment Methodology and Applications (PSA'95), pp. 216-221, Korea,
(1995)
[5] A. Hidaka et al."Comparative Study of FP Deposition in WIND Project by ART and VICTORIA"
Proc. Int. Conf. on Probabilistic Safety Assessment Methodology and Applications (PSA'95), pp.
241-246, Korea, (1995)
[6] S. Kondo et al."Comparison of Analytical Models and Calculated Results of Source Term
Evaluation Codes" OECD/CSNI PSA Workshop, NUREG/CP-0115, pp. 273-287 (1990)
[7] A. Hidaka et al."Comparative Study of Source Terms of a BWR Severe Accident by THALES-2,
STCP and MELCOR" Proc. 1992 National Heat Transfer Conf., HTC-Vol. 6, pp. 408-416 (1992)
[8] J. Ishikawa et al."Systematic Source Term Analyses fro Level 3 PSA of a BWR with Mark-II Type
Containment with THALES-2 Code" 10
th
Int. Conf. on Nucl. Eng. (2002)
[9] A. Hidaka et al. Proposal of Simplified Model of Radionuclide Release from Fuel under Severe
Accident Conditions Considering Pressure Effect"J. Nucl. Sci. Technol. 41(12), pp. 1192 - 1203
(2004)
4.1.5 ECART
ECART (ENEL Code for the Analysis of Radionuclide Transport) is an integrated primary circuit and
containment code, originally created in 1989 for nuclear power plant severe accident analysis, but now also
applied to fusion plants, industrial fires etc. The utilities ENEL and EdF contributed to its intial
development, while its wider application for risk analysis is being carried forward by CESI. The code
calculates the two-phase thermal-hydraulics for both the primary system and the containment and for
material transport calculates aerosol and vapor transport together with chemical equilibrium and specific
reactions between the gaseous phase and important structural surfaces. The principal models used are listed
in Table 4.1-5.
An interesting feature of the code useful in experimental analysis is its ability to accept incomplete
thermal-hydraulic data e.g. data specified only at certain junctions or boundaries, and then to use its
internal calculation capabilities to complete the thermal-hydraulic conditions required by the aerosol and
chemistry sections of the code. Validation studies have used data from the ATT-Marviken V, LACE,
DEMONA, VANAM, STORM and PHÉBUS programmes. Recent applications of ECART have been to

NEA/CSNI/R(2009)5
156
aerosol resuspension and chemical reactions in PWR circuits, the safety analysis of IRIS, and transient
analyses of the fusion experiment ITER.
Table 4.1-5 Circuit and containment models
Mechanism Literature source and/or brief description
Thermal-hydraulics
Transport of carrier gas/liquid
mass, momentum, energy
Control volumes, each with a liquid and a gas volume
in equilibrium
1-d and 2-d connection of volumes
Bulk and wall condensation split
Exchanges with structures Included
Vapor/gas transport Secondary gases e.g. nobles, accounted for
Sprays and sprinklers
Ad-hoc Lagrangian model accounting for droplet size
distribution and injection speed
Pool scrubbing Included within control volume
Gas combustion (hydrogen
and others)
Accounted for through equilibrium chemistry
Fires and explosive aerosol
clouds
Models of pyrolysing solid surfaces, pool fires and
detection of explosible aerosol clouds
Radiative heat transfer from
flames
View factors among flames and structures calculated
with Montecarlo method
Aerosol cloud absorption accounted
Decay heat 13 most powerful elements accounted for
Vapor phenomena
Vapor-phase chemistry
Equilibrium with 126 reacting species (including
carrier gases)
Homogeneous nucleation Not modelled (source seed required)
Heterogeneous nucleation Not modelled (source seed required)
Sorption on surfaces (one-
way)
Selected species/surface combinations e.g. irreversible
sorption of I, I
2
, HI, CsOH, Te and Te
2
vapors on steel
Condensation/Evaporation
onto/from surfaces and
aerosol particles
Calculated by diffusion equations
Aerosol phenomena
Transport
Well-mixed within each volume. Corrections for
components with concentration gradients e.g. long
pipes
Discretised size distribution; simplified multi-
component description (composition accounted for
each size bin in each volume, for both airborne and
deposited particles)
Aerosol shape Aerodynamic and collision shape factors
Particle growth Includes hygroscopic behaviour, Kelvin effect
Settling Stokes and non-Stokes regimes
Turbulent impaction Liu-Agarwal data

NEA/CSNI/R(2009)5
157
Diffusion Davies, Gormley-Kennedy
Thermophoresis Brock correlation with Talbot coefficients
Diffusiophoresis Schmidt-Waldmann
Bend impaction
Stokes and non-Stokes regimes; size-dependent
trapping in narrow bends
Agglomeration Brownian (Smoluchowski)
Gravitational
Turbulent (Saffman and Turner)
Mechanical resuspension Modelled through experimental correlation [1]
Aerosol fall-back Accounted for
Scrubbing in water sumps
Lagrangian model accounting aerosol depletion within
rising bubble - [2]
References
[1] F. Parozzi A fast-running model for physical aerosol resuspension accounting for STORM
experimental results Int. Mtg. “Best-Estimate” Methods in Nuclear Installation Safety Analysis
(BE-2000), Washington Dc, USA, November 2000
[2] F. Parozzi, S. Paci ECART code integrated approach for thermal-hydraulic source term analysis 4
th
Int. Conf. on Nuclear Option in Countries with Small and Medium Electricity Grids, Dubrovnik,
Croatia, June 2002
4.1.6 APROS SA
4.1.6.1 Introduction
APROS (Advanced PROcess Simulator) is a multifunctional advanced process simulation software
developed by Fortum and the Technical Research Centre of Finland. It is used for process and automation
design, developing operation procedures and training at nuclear power plants, as well as for the full
spectrum of the transient and accident analyses. APROS has passed an extensive validation programme.
Most accident analyses for the new operating license of Loviisa NPP at uprated reactor power are made
using APROS. The recenct versions of APROS include components
for detailed containment analysis, as well.
APROS software is applicable also in engineering and operator
training of thermal power plants.
The versatile APROS simulation software suits as well for purposes
of building engineering or training simulators and plant simulation
models.
4.1.6.2 Severe accident extension
During the implementation of SAM for the Loviisa NPP, a tool for
simulating severe accident phenomena was seen necessary. Specific
phenomena, as in-vessel retention and hydrogen mitigation and

NEA/CSNI/R(2009)5
158
fission product behaviour in an ice condenser containment, were to be introduced into the system. The
selection of using APROS software as a platform for the severe accident was a natural choice for Fortum.
The development of APROS SA [1] aims at a severe accident simulator for the Loviisa NPP that is capable
of calculating the severe accident sequences faster than real time. The necessary phenemona are the core
relocation, molten pool formation, core slumping into the lower plenum, in-vessel retention of the molten
pool, hydrogen formation and fission product release from the overheating core, hydrogen mitigation with
passive autocatalytic recombiners in the ice condenser containment, fission product retention in the RCS
and in the containment, as well as in the long narrow pipelines in the contaiment bypass routes. In addition,
the radiation levels at the plant site are to be included into the simulator.
The visualisation of the calculation results plays an important role in training the severe accident
phenomena. In Fig. 4.1-4 can be seen an example of temperature profile in the Loviisa NPP ice condenser
containment at two situations.
Fig. 4.1-4 Temperature distribution in Loviisa NPP ice condenser containment at 0 s (left) and 3 s,
(right) after a 500 cm2 break in cold leg calculated by APROS SA. (Color gradient is from
blue to red to yellow with blue corresponding 20 °C, red 60 °C and yellow 100 °C) [1]
4.1.6.3 Aerosol modelling
The aerosol modelling in APROS SA is based on fixed, user defined aerosol size classes, where no aerosol
growth is assumed. Each fission product group acts as individual substance with their own aerosol material
densities. Currently, for each FP group there are three different aerosol size groups, one group for gaseous
species, and one for deposited mass. The deposited mass can be either on the dry surfaces of a simulation
node or dissolved in the water within the node. The FPs are transported between the nodes along with the
flowing gas or water.
NEA/CSNI/R(2009)5
159
The fission product groups in APROS SA are:
−
Noble gases (Kr, Xe)
−
Iodine (I, Br)
−
Cesium (Cs, Rb)
−
Tellurium (Te)
−
Metallic compounds (not released from the core)
−
Oxidic compounds (not released from the core)
The TH condition calculated by the other models in APROS or APROS SA are used for FP calculation,
ann the FP calculation gives the decay power distribution as input to the other models. The distribution of
metallic and oxidic compounds not released from the reactor core is used for the decay power distribution
calculation between the metallic and oxidic molten pools at the bottom of the RPV lower head.
The fission product release from the reactor core is based on the CORSOR-M model [2], and the released
FPs (other than noble gases) are instantaneously in form of aerosol after the release. This means that the
vapor phase chemistry in the RCS is not considered.
The aerosol processes in the APROS SA are those that play the most important role in the case of the
Loviisa NPP:
−
Sedimentation
−
Thermophoresis (Talbot correlation; independent of aerosol particle size)
−
Diffusiophoresis (independent of aerosol particle size)
−
Turbulent (eddy) impaction in the RCS and bypass pipelines (modified model to meet the coupling
with the resuspension model by [3])
−
Revaporisation
−
Resuspension [3]
−
Spray droplet washout (impaction, interception, diffusion)
−
Inter-volume aerosol fall to lower levels (similar to sedimentation)
The FP calculation has no other effect on the other parts of calculation than through providing the decay
power distrubution. Iodine chemistry is modelled as simple equilibrium calculation with fixed water pool
pH and temperature dependent partitioning of gaseous iodine (I
2
). The formation of organic iodine is not
accounted for.
The limitation of the FP modelling is that it cannot be used for detailed analyses on FP behaviour. The
essential information from the APROS SA fission product calculation is qualitative data with a reasonable
accuracy for training purposes of severe accident simulations and usage of EOPs for SAM.
The aerosol models have been validated against different experimental data. The revaporisation and
deposition in the pipe systems have been verified against the data from the RCS part in the ISP-46 from the
PHÉBUS FPT1 (see Fig. 4.1-5) [4]. The aerosol behaviour in the containment has been compared with the
results from the VICTORIA facility (a scale model of the Loviisa ice condenser containment) [5, 6]. The

NEA/CSNI/R(2009)5
160
resuspension model validation is currently under work, and the results are to be compared with the results
from the Horizon [7] and PSAERO [8] facilities.
Fig. 4.1-5 Comparison of APROS SA aerosol calculation with VICTORIA experimental results [6]
4.1.6.4 Future plans
In future, the models for aerosol size distribution in the RCS calculated from the aerosol mass
concentration are to be implemented, which probably acclerates the calculation speed significantly. There
is a very high number of calculation nodes in a typical simulation environment in a detailed plant model,
and therefore a reduction of individually calculated aerosol groups is foreseen.
The radiation level calculation from the FP distribution is one assential part of a severe accident simulator,
as it provides information for simulation of radiation measurement device used during accidents. The
essential information on the coefficients to calculate the radiation levels from the activities is to be
implemented rather in the user interface of APROS SA than directly into the FP calculation.
References
[1] E. Raiko, K. Salminen, P. Lundström, M. Harti, T. Routamo Severe accident training simulator
APROS SA. Proceedings of NURETH-10 The 10
th
International Topical Meeting on Nuclear
Reactor Thermal Hydraulics, October 5-11, 2003, Seoul, Korea, 2003
[2] M. Silberberg, J.A. Mitchell, R.O. Meyer, C.P. Ryder Reassessment of the Technical Bases for
Estimating Source Terms Final Report. U.S. Nuclear Regulatory Commission, Office of Nuclear
Regulatory Research, Washington, July 1986. NUREG-0956
0,00 %
0,00 %
0,00 %
14,19 %
12,35 %
6,18 %
3,12 %
4,06 % 3,89 %
0,19 %
0,60 %
0,05 %
0,03 %
0,76 %
2,39 %
2,12 %
3,55 %
0,00 %
2,47 %
0,04 % 0,02 %
0,63 %
2,04 %
0,96 %
2,12 %
0,00 %
2,11 %
3,12 %
28,74 %
0,02 %
2,58 %
1,49 %
0,16 %
VICTORIA 62
Total injected mass
in the simulation 2350 mg
in the experiment 2412 mg
0,00 %
0,00 %
0,00 %
14,19 %
12,35 %
6,18 %
3,12 %
4,06 % 3,89 %
0,19 %
0,60 %
0,05 %
0,03 %
0,76 %
2,39 %
2,12 %
3,55 %
0,00 %
2,47 %
0,04 % 0,02 %
0,63 %
2,04 %
0,96 %
2,12 %
0,00 %
2,11 %
3,12 %
28,74 %
0,02 %
2,58 %
1,49 %
0,16 %
VICTORIA 62
Total injected mass
in the simulation 2350 mg
in the experiment 2412 mg
Node 26
0
10
20
30
40
50
60
70
80
90
100
60 90 120 150 180 210 240 270 300 330 360
Time (min)
Concentratio (mg / m
3
)
small
medium
large
Total
TEOM, line 1
Node 27
0
5
10
15
20
25
30
35
40
60 90 120 150 180 210 240 270 300 330 360
Time (m in)
Concentratio (mg / m
3
)
small
medium
large
Total
TEOM, line 2
NEA/CSNI/R(2009)5
161
[3] A. Auvinen, J.K. Jokiniemi Modelling resuspension of particle layer in an internal tube flow
Presented in the European Aerosol Conference (EAC04), September 6-10, 2004, Budapest, Hungary
[4] V. Karttunen Validation of a fission product revaporization model Helsinki University of
Technology, Master's thesis, Espoo, January 10, 2005. 81 p. + Apps, 2005a
[5] V. Karttunen APROS SA fission product validation in containment nodes with CsOH Fortum
Nuclear Services Ltd, Report 24.1.2005. TERMO-435, 2005b
[6] V. Karttunen APROS SA fission product validation in containment nodes with Ag Fortum Nuclear
Services Ltd, Report 25.4.2005. TERMO-466, 2005c
[7] T. Routamo, J. Jokiniemi, J. Mäkynen Aerosol Deposition in Horizontal Steam Generator Tubes in
Severe Accident Conditions Proceedings of NURETH-10 - The 10
th
International Topical Meeting
on Nuclear Reactor Thermal Hydraulics, October 5-11, 2003, Seoul, Korea, 2003
[8] A. Auvinen
a
, J.K. Jokiniemi
a
,. A. Lähde
a
, T. Routamo
b
, P. Lundström
b
, H. Tuomisto
b
, J. Dienstbier
c
,
S. Güntay
d
, D. Suckow
d
, A. Dehbi
d
, M. Slootman
e
, L. Herranz
f
, V. Peyres
f
, J. Polo
f
,
“SG tube rupture
(SGTR) scenarios” Nuclear Engineering and Design 235 (2005) 457–472
a
VTT Processes, Biologinkuja 7, P.O. Box 1602, VTT Espoo 02044, Finland
b
Fortum Nuclear Services, Vantaa, Finland
c
Nuclear Research Institute Rez plc, Czech Republic
d
Paul Scherrer Institute, Villigen-PSI, Switzerland
e
Nuclear Research and Consultancy Group, Arnhem, Netherlands
f
Centro de Investigaciones Energeticas, Medioambientales y Tecnologicas, Madrid, Spain
4.2 Circuit
4.2.1 VICTORIA
The VICTORIA computer code [1, 2] attempts to predict the behaviour of radionuclides in the reactor
coolant system under severe accident conditions. It addresses the release of radionuclides, the chemical
forms adopted by the radionuclides, as well as the formation, growth and deposition of aerosol particles.
The computer code was not intended for the routine analysis of severe reactor accidents. The idea for the
development of a mechanistic treatment of radionuclide behaviour in the reactor coolant system arose in
the aftermath of the accident at Three Mile Island. It had become obvious that simplistic treatment of the
radionuclide releases during core degradation in terms of noble gases, gaseous iodine and general
particulate could not lead to results of adequate accuracy. At the same time, a wealth of experimental
evidence of chemical interactions of radionuclides in the reactor coolant system environment under
accident conditions was coming available from research programs in the USA, UK, and France. Simply
"patching" existing radionuclide transport models with
ad hoc chemical models became increasingly
unsatisfactory. Experimental results, though quite significant, were obtained for limited conditions and
selected species. A broader analytic approach was needed that could account for experimental findings and
extrapolate these findings to more drastic conditions expected to develop in some classes of risk-significant
accidents and even to other chemical systems that had not received individual study. The VICTORIA
model was developed to address this need. It was intended to be used to interpret experiments and to
extrapolate the results to accident conditions. The objective of the detailed mechanistic analyses was to
determine important phenomena that had to be represented in systems level accident analysis models such
as MELCOR.
NEA/CSNI/R(2009)5
162
VICTORIA is a lumped computational node computer code. Computational nodes can be quite small in
comparison to those used in systems-level reactor accident analysis codes. Key elements of the VICTORIA
computer code are models of:
•
Fission product release from degrading reactor fuel and precious metal control rods
•
Chemical speciation of radionuclides and other materials vaporized during reactor core
degradation
•
Formation and growth of aerosol particles
•
Deposition of vapors on surfaces along the flow paths through the reactor coolant system
•
Deposition of aerosols on surfaces along the flow paths through the reactor coolant system
•
Resuspension of deposited aerosol
•
Revaporisation of radionuclides on surfaces in the reactor coolant system
The VICTORIA computer code does not attempt to predict the inventories of radionuclides in reactor fuel
at the start of an accident. These inventories are usually obtained using the ORIGEN [3] computer code.
The VICTORIA computer code does not try to predict the flows through the reactor coolant system or the
temperatures of the structures along the flow paths. These are obtained from other models such as
MELCOR.
Synoptic descriptions of the models in VICTORIA are presented in the sections that follow.
Radionuclide release from the fuel
The VICTORIA model was not originally intended to address issues of radionuclide release from the fuel.
Other models like CORSOR [4] exist for making such predictions. It was found, however, convenient to
include release models into the computer code. Still this is an area that has received the least model
development attention.
The code considers two configurations of the reactor fuel for the purposes of estimating radionuclide
release:
−
intact fuel in rod geometry that may or may not have cladding still in place
−
rubble that may be molten produced as the core loses its geometry
The distinct models of radionuclide release in these configurations are discussed in subsections below.
Release from intact fuel
For the purposes of estimating release from fuel in rod-like geometry, VICTORIA originally had two
models. One was a very mechanistic model patterned after the FASTGRASS [5] model developed at
Argonne National Laboratory. The other was the more empirical model based on the well-known Booth
solution to the diffusion problem and parameterised based on results of tests of radionuclide release from
irradiated fuel done at Oak Ridge National Laboratory. It was found that the mechanistic model required
input that is not routinely available. Furthermore, the model was not especially reliable. Based on a
recommendation of a peer review group the very mechanistic release model was deleted from the
VICTORIA computer code.
NEA/CSNI/R(2009)5
163
The Booth-type modeling of fission product release has been replaced in the more recent version of
VICTORIA by a more mechanistic model that considers:
•
diffusive release of fission products from fuel grains
•
transport of fission product vapors through the pore network of the fuel
•
transport of fission product vapors through the gap between the fuel pellets and the cladding to a
break in the cladding when the cladding is present
•
mass transport of fission product vapors away from the break in the cladding or other free
surface.
Diffusion coefficients for fission products in fuel grains are taken from Matzke [6]. Gas phase diffusion
coefficients are calculated based on the well-known Chapman Enskog expression for binary diffusion
coefficients assuming a Lennard-Jones intermolecular potential. Binary diffusion coefficients are combined
to define effective diffusion coefficients for multicomponent gaseous mixtures. The assumption of
Lennard-Jones intermolecular potentials is a common one for computer codes like VICTORIA. Two issues
are associated with this assumption. First, the Lennard-Jones intermolecular potential is not precisely
applicable to the vapor species of interest since many are polyatomic and many are either radicals or have
permanent dipole moments. Most consider this to be an issue of modest importance. More difficult is that
reliable estimates of the parameters for the potential, collision diameter and energy well depth, are not
available. Parameters used in the modeling can be considered no more than educated guesses.
The advantages of the current release modeling in VICTORIA include accounting for the effects of both
ambient pressure and ambient gas composition as well as temperature on the releases of fission products
from the fuel.
Release from fuel debris
It is assumed in the VICTORIA computer code that relocation of fuel yields a rubble bed. Modeling of
fission product release from the rubble bed is based on the assumption that the rubble is composed of fuel
cylinders with lengths and diameters specified by the user to adequately reflect the surface to volume ratio
of real debris. Fission products diffuse through grains and pores of the fuel cylinders much as they do in
intact fuel. Mass transport of vapors that reach the geometric surfaces of the fuel cylinders is modeled.
The
VICTORIA code does have a model of fission product release from a molten pool. There have not been
many opportunities to evaluate and refine this model.
Release of control rod material
Vapors and aerosol are produced when silver-indium-cadmium control rods found in pressurised water
reactors fail during reactor accidents. These vapor and aerosol materials can interact with radionuclide
vapors and aerosols produced by core degradation and affect reactor accident source terms. VICTORIA
models the production of vapor and aerosols produced by the failure of silver-indium-cadmium control
rods. The production is considered to involve two phases - a burst failure when the control rod cladding
fails because the internal pressure exceeds the pressure in the reactor coolant system and a continued
vaporization release from the molten control rod alloy.
The burst release involves the venting of vapors from the control rod and the entrainment of 2 % of the
control rod alloy above the failure location. The entrained aerosol is taken to have a geometric mean
particle size of 0.5 µm with a geometric standard deviation of 1.8.
NEA/CSNI/R(2009)5
164
Vaporization of the Ag-In-Cd alloy is done by either fixing the location of the alloy or allowing the alloy to
"candle" or drain downward. Vaporization is calculated for material that is candling.
There is not now in VICTORIA a model of vapor and aerosol production from boron carbide control
blades degradation during boiling water reactor accidents.
Chemical speciation of released material
The essential model in VICTORIA is a prediction of the chemical speciation of the materials vaporized
from the reactor core. The model is applied in each of the computational nodes of the model so the
evolution of the speciation is taken into account. The model is based on the assumption of chemical
equilibrium at the local temperature and constant volume rather than the more common condition of
constant pressure. The computational method for finding the equilibrium speciation was specially
developed for the VICTORIA code, but is akin to the well-known NASA method.
The chemical equilibrium analysis considers the elements Ag, Ar, B, Ba, Cd, Cr, Cs, Eu, Fe, H, He, I, In,
Kr, Mn, Mo, Ni, O, Ru, Sb, Sn, Sr, Te, U, Xe, Zr. The equilibrium calculation considers 288 chemical
species. Chemical species considered in the equilibrium model were chosen from species with readily
available thermodynamic data. The species are primarily from binary M-O, M-H, M-Te and M-I systems
where M designates a metal or electropositve species. Very few mixed oxide vapor species are considered.
Certainly, the speciation has not been optimised for the high temperature conditions encountered in severe
reactor accidents. There has not been an aggressive attempt to include vapor species not addressed in
conventional compilations of thermodynamic data.
Multiple condensed phases can be predicted to form in the equilibrium calculation. VICTORIA considers
all condensed phases to form ideal solutions of one type or another. Three types of condensed phase
solutions are recognised: metallic, oxidic, and metal iodides. This is, at best, an approximate treatment
since many important solid species even within a given class of species recognised by VICTORIA are not
mutually soluble in the solid state.
A great deal of attention has been devoted to making the chemical equilibrium solver in VICTORIA
execute both reliably and quickly. The routine is called multiple times in each computation node and in
each time step as is discussed below in connection with vapor deposition.
Aerosol formation and growth
The VICTORIA computer code does not make a mechanistic prediction of aerosol particle nucleation from
supersaturated vapors. Rather, it assumes that aerosol is formed promptly when the vapor reaches a point
of saturation of one or more of its constituents as predicted with the chemical speciation model. Neglect of
nucleation modeling was based on calculational exercises that showed details of the aerosol size
distribution produced by mechanistic nucleation processes were promptly obscured by the coagulation of
the product aerosol particles.
The implementation of the approximate treatment of aerosol formation depends on the results obtained
from the chemical speciation model. When chemical speciation calculations indicate that a condensed
phase is formed or more mass is transferred to the condensed phase, this mass is placed in the smallest size
bin of aerosol considered in the aerosol modeling (See below).
The aerosol growth is calculated based on a conventional master equation using the CHARM [7] code.
CHARM uses a sectional method to solve the master equation. That is, the aerosol size distribution is
divided into a set of bins.
NEA/CSNI/R(2009)5
165
The solution is achieved using a finite interval collocation method. The coagulation kernel considers
coagulation of aerosol particles by:
•
gravitation settling
•
Brownian diffusion
•
turbulent inertia
•
turbulent diffusion
Aerosol growth as a result of hygroscopicity is not considered in VICTORIA since temperatures arising in
typical analyses exceed the critical temperature of water.
Vapor deposition and revaporization
As vapors pass though and out of the core region, they cool. A temperature is reached eventually where the
equilibrium chemical speciation will include some condensed phases. That is, the vapor will condense or
react with surfaces. Vapor condensation can involve deposition on surfaces, deposition on aerosol particles
and nucleation on particles. On the other hand, changes in temperature or chemical conditions along the
flow path or with time can cause previously deposited materials to vaporize.
The VICTORIA computer code has an involved method for the description of the condensation and
evaporation so that the processes are fully reversible. The equilibrium speciation of the bulk gas phase at
constant volume and temperature and including any aerosol present is calculated. Another equilibrium
speciation calculation is done for surfaces adjacent to the flowing gas which might be at quite different
temperatures than the bulk gas phase. Differences in the vapor pressures at the surface and in the gas phase
define the driving force for either vaporization or vapor deposition. The partitioning of vapor among
structural surfaces, aerosol surfaces and new aerosol is found through mass transport considerations. The
competitive mass transport to structural surfaces and to suspended aerosol is evaluated. Any additional
condensation (or evaporation) necessary to relieve disequilibrium in the system is apportioned to nucleated
aerosol that is assumed to appear in the smallest aerosol "bin".
Aerosol deposition
Aerosol deposition is considered in the VICTORIA computer code to occur as a result of:
•
gravitational settling
•
Brownian diffusion
•
turbulent deposition
•
thermophoresis
•
inertial deposition from flow in
- bends
- flow path contractions
-
vena contracta
A specialised model for inertial deposition in the separators and dryers of boiling water reactors is also
included in the VICTORIA modeling.

NEA/CSNI/R(2009)5
166
Diffusiophoretic deposition is not considered in VICTORIA. There is not usually condensing water in the
reactor coolant system under severe accident conditions and the condensing fluxes of vapor to structural
surfaces within the system are too small to significantly affect aerosol deposition rates.
Conventional models are used for gravitational settling and Brownian diffusion (see Chapter 2).
Turbulent deposition modeling is based on particle size. For submicron particles, turbulent deposition is
based on a model by Davies [8]:
()
π
+
Φ
+
Φ+Φ
Φ+
=
−
33
1 - 2
tan
3
1
- 1
1
n1
6
1
14.5
v
1
2
2
g
-2/3
Sc
d
V
and for larger particles, turbulent deposition is based on a model by Sehmel [9]:
g
02.3
1.2
h
p
01.1
ρ
8
d
v
d
d
ρ
Re10x69.3V
=
−
where:
d
V = particle disposition velocity (cm/s)
g
v = gas velocity (cm/s)
ρ
ρ = particle material density (g/cm
3
)
p
d = particle diameter (cm)
h
d = hydraulic diameter of flow path (cm)
Re = Reynolds number (-)
Sc
= Schmidt number
Φ =
9.2
Sc
3/1
Thermophoretic deposition is based on the Talbot [10] interpolation expression.
Inertial deposition in bends is based on the Pui [11] correlation. Deposition as a result of contractions in the
flow is based on the Ye and Pui [12] correlation. Deposition produced by a
vena contracta is calculated
from a correlation by Belyaev and Levin [13]. These correlations are discussed in Chapter 2 of this report.
4.2.1.1. Aerosol resuspension
VICTORIA uses an outdated model of resuspension based on a curve fit to experimental data [14]:
()
>
<
=
2300Ret/*U05.0
2300Re0
dt
dF
1.25
2
NEA/CSNI/R(2009)5
167
where:
F = fraction of deposit remaining
Re = Reynolds number
U * = friction velocity (m/s)
t = time from point at which Re became greater than 2300
This model is applicable only to aerosol that is present on surfaces as dry dust and should not apply to
deposited aerosols that have interacted chemically with the surface or with other deposited materials. It
does not account for any aging of the deposited material which will usually reduce the propensity for
resuspension. There is no consideration of surface vibration or shock waves on the ability to resuspend
deposited materials.
4.2.1.2 Status
Development and use of the VICTORIA computer code is no longer supported. Currently underway is an
effort to evaluate the findings obtained with VICTORIA in the analyses of a variety of experiments to
identify improvements needed in the fission product modeling in the MELCOR computer code.
References
[1] N.E. Bixler VICTORIA 2.0: A Mechanistic Model for Radionuclide Behaviour in a Nuclear Reactor
Coolant System under Severe Accident Conditions NUREG/CR-6131, Sandia National
Laboratories, Albuquerque, NM, 1998
[2] T.J. Heames et al.VICTORIA: A Mechanistic Model of Radionuclide Behaviour in the Reactor
Coolant System Under Severe Accident Conditions NUREG/CR-5545, Sandia National
Laboratories, Albuquerque, NM, December 1992
[3] A.G. Croff ORIGEN2: A versatile computer code for calculating the nuclide composition and
characteristics of nuclear materials Nuclear Technology, 62 (1983) 335
[4] M.R. Kuhlann, D.J. Lehmicke and R.O. Meyer CORSOR User's Manual NUREG/CR-4173,
BMI-2122, Battelle Memorial Institute, Columbus, Ohio, March 1985
[5] J. Rest and S.A. Zawadzki FASTGRASS: A Mechanistic Model for the Prediction of Xe, I, Cs, Te,
Ba and Sr Release from Nuclear Fuel Under Normal and Severe Accident Conditions: User's Guide
for Maintenance, Workstation and Personal Computer Applications NUREG/CR-5840, Argonne
National Laboratory, Argonne, IL, 1992
[6] H. Matzke A Diffusion in Ceramic Oxide Systems Advances in Ceramics, 17 (1986) 1
[7] C.J. Wheatley CHARM: A Model for Aerosol Behaviour in Time-Varying Thermal Hydraulic
Conditions NUREG/CR-5162, Sandia National Laboratories, Albuquerque, NM, 1988
[8] C.N. Davies Aerosol Science Academic Press, 1966
[9] G.A. Sehmel J. Geophys. Res., 75 (1970) 1766
[10] L. Talbot, T.K. Cheng, R.W. Schefer and D.R. Willis J. Fluid Mechanics 101 (1980) 737
[11] D.Y. Pui, R. Fomay-Novas and B.Y. Liu Aerosol Science and Technology, 7 (1987) 301

NEA/CSNI/R(2009)5
168
[12] Y.Ye and D.Y. Pui J. Aerosol Science, 21 (1990) 29
[13] S.P. Belyaev and L.M. Levin J. Aerosol Science, 3 (1972) 127
[14] A.L. Wright, W.L. Patterson and J.Y. King TRAP-MELT Validation Tets: Series 2 Aerosol
Resuspension Test Data Summary Report, Letter Report to the US Nuclear Regulatory Commission,
Oak Ridge National Laboratory, Oak Ridge, TN, 1984
4.2.2 ATHLET-CD
The system code ATHLET-CD (Analysis of Thermal-Hydraulics of LEaks and Transients with Core
D
egradation [1]) is designed to describe the reactor coolant system thermal-hydraulic response, core
damage progression, fission products and aerosol behaviour during severe accidents, to calculate the source
term for containment analyses, and to evaluate accident management measures [2]. It is being developed
by GRS in cooperation with the Institut für Kernenergetik und Energiesysteme (IKE), University of
Stuttgart. ATHLET-CD also includes the aerosol and fission product transport code SOPHAEROS (see
chapter 4.1.2), which is being developed by the French Institut de Radioprotection et de Sûreté Nucléaire
(IRSN).
The ATHLET-CD structure is highly modular in order to include a manifold spectrum of models and to
offer an optimum basis for further development. It contains the original ATHLET models for a
comprehensive simulation of the thermal-hydraulics in the reactor coolant system. The ATHLET code [3]
comprises: (a) a thermo-fluid-dynamic module, (b) a heat transfer and heat conduction module, (c) a
neutron kinetics module, (d) a general control simulation module, and (e) the general solver of differential
equation systems FEBE (Forward Euler - Backward Euler [4]). The thermo-fluid-dynamic module includes
two different fluid-dynamics equation systems: (a) a six-equation model, with fully separated balance
equations for liquid and vapor, complemented by mass conservation equations for up to 5 different non-
condensable gases and by a boron tracking model, and (b) a five-equation model, with a mixture
momentum equation and a full-range drift-flux formulation for the calculation of the relative velocity
between phases. Specific models for pumps, valves, steam separators, mixture level tracking, critical flow,
etc. are also available in ATHLET.
The rod module ECORE consists of models for fuel rods, absorber rods (AIC and B
4
C) and for the fuel
assembly including BWR canister and absorber. The module describes the mechanical rod behaviour
(ballooning), zirconium and boron carbide oxidation (Arrhenius type rate equation), Zr-UO
2
dissolution, as
well as melting of metallic and ceramic components. The melt relocation (candling model) is simulated by
rivulets with constant velocity and cross section, starting from the node where rod failure is predicted to
occur. The model accounts for oxidation, freezing, re-melting, re-freezing and melt accumulation due to
blockage formation. The feedback to the thermal-hydraulics considers steam starvation and blockage
formation [5]. Besides the convective heat transfer, energy can also be exchanged by radiation between
fuel rods and to surrounding core structures.
The release of fission products is modeled by rate equations or by a diffusion model within the module
FIPREM [6]. The transport and retention of fission products and aerosols in the reactor coolant system are
simulated by the code SOPHAEROS [7].
For the simulation of debris bed a specific model MESOCO [8] is under development, with its own
thermal-hydraulic equation system, coupled to the ATHLET fluid-dynamics on the outer boundaries of the
debris bed. The transition of the simulation of the core zones from ECORE to MESOCO depends on the
degree of degradation in the zone. The code development comprises also late phase models for core
slumping, melt pool behaviour and vessel failure.
NEA/CSNI/R(2009)5
169
The code system ATHLET/ATHLET-CD can be coupled to the containment code system COCOSYS
(see chapter 4.3.2), and it is the main process model within the German nuclear plant analyser ATLAS.
The ATLAS environment allows not only a graphical visualization of the calculated results but also an
interactive control of the simulation.
The code validation is based on integral tests and separate effect tests, as proposed by the CSNI validation
matrices [9], and covers thermal-hydraulics, bundle degradation as well as release and transport of fission
products and aerosols.
References
[1] K. Trambauer, C. Bals, J.-D. Schubert, H. Austregesilo ATHLET-CD Mod 2.1 - Cycle A User’s
ManualGesellschaft für Anlagen- und Reaktorsicherheit (GRS) mbH, GRS-P-4, Vol. 1., 2006
[2] V. Teschendorff, K. Trambauer
Simulation of severe accidents with detailed thermal hydraulic models Kerntechnik, 63, 18-24, 1998
[3] H. Austregesilo, C. Bals, A. Hora, G. Lerchl, P. Romstedt ATHLET Mod 2.0 Cycle A - Models and
Methods Gesellschaft für Anlagen- und Reaktorsicherheit (GRS) mbH, GRS-P-1, Vol. 4., 2003
[4] E. Hofer An A(α)-Stable Variable Order ODE-Solver Topical Meeting on Advances in Math.
Methods, Munich, April 1981
[5] K. Trambauer Coupling methods of thermal-hydraulic models with core degradation models in
ATHLET-CD In: Proceedings of the 6
th
International Conference on Nuclear Engineering,
ICONE-6368, San Diego, USA, May 10-15, 1998
[6] K.D. Hocke, A. Paller, A. Schatz Modelling and Code Development for the improved Description of
FP and Aerosol release during LWR Core Heat–up and Degradation CL-NA-15210–EN–C,
European Commission, 1994
[7] C. Fiche User’s manual of SOPHAEROS V2.2, IRSN N.T. SEMIC 2004/13, 2004
[8] M. Bürger, M. Buck, W. Schmidt, G. Pohlner, W. Widmann Ausbau und Verifikation der
Spätphasenmodelle und des Gesamtmodells zum Kernschmelzen in KESS und ATHLET-CD IKE
2-145, Universität Stuttgart, 2001
[9] K. Trambauer, T.J. Haste, B. Adroguer, Z. Hózer, D. Magallon, A. Zurita In-Vessel Core Degradation
Code Validation Matrix - Update 1996-1999 OECD Nuclear Energy Agency, NEA/CSNI/R(2000)21,
2000
4.3 Containment
4.31 CONTAIN
Introduction
The CONTAIN 2.0 computer code is a modular and integrated analysis tool used for predicting physical
conditions, chemical compositions, and distributions of radiological materials inside a containment
building following the release of material from the primary system in a light-water reactor accident [1]. It
can also predict the source term to the environment. Interactions among thermal-hydraulic phenomena,
aerosol behaviour and fission product behaviour are taken into account. The code includes atmospheric
NEA/CSNI/R(2009)5
170
models for steam/air thermodynamics, inter-cell flows, condensation/evaporation on structures and
aerosols, aerosol behaviour, and gas combustion. It also includes models for reactor cavity phenomena
such as core-concrete interactions and coolant pool boiling. Heat conduction in structures, fission product
decay and transport, radioactive decay heating, and the thermal-hydraulic and fission product
decontamination effects of engineered safety features are also modeled. For those phenomena affected by
significant uncertainty, CONTAIN 2.0 is provided with the capability of introducing user-specified input
parameters in order to perform sensitivity studies.
Status
CONTAIN was developed at Sandia National Laboratories under the sponsorship of the US Nuclear
Regulatory Commission (USNRC) for analyzing containment phenomena under severe accident and
design basis accident conditions. The first version was released in 1984 [2]. A detailed history of
CONTAIN code release can be found in the CONTAIN 2.0 code manual [1]. This note refers to the third
major release of the code (CONTAIN 2.0).
An extensive independent review of the CONTAIN code was done in the mid 90s [3]. At that time, the
Peer Review Committee judgement was extremely positive and stated that the code could be applied to
both selected design basis accidents and severe accidents for both current reactors and advanced light water
reactors. In this regard, the CONTAIN code was assessed against data concerning the passive containment
cooling system of the AP600 Westinghouse reactor [
4].
Even though in the revised severe accident code strategy of USNRC the role of CONTAIN for source term
analyses is de-emphasised, aerosol and fission product models are in many cases state-of-the-art and
suitable for many types of source term analyses.
Extensive validation of the CONTAIN code modeling has been carried out. A good example is the thermo-
hydraulics, inter-cell flow and hydrogen combustion models that have been compared against more than 20
tests [5]. In the particular case of aerosol modeling, recent validation exercises have been carried out in the
frame of OECD/CSNI against experiments like VANAM-M3 [6], KAEVER [7], PHÉBUS-FPT1 [8]. In
addition, further CONTAIN-to-data comparisons are set on individual bases [9, 10].
Aerosol modelling
The basic aerosol modeling in CONTAIN comes from the MAEROS code [11] together with some
enhancements. The major generic features are:
−
Size distribution can be described by 10-20 classes.
−
Chemical composition can be detailed by using 8 material components.
−
Steam condensation onto particles is tightly coupled with thermal-hydraulics.
As shown in the Table below, two methods are available in CONTAIN to model condensation/evaporation
of water onto/from particles: fixed- and moving-grid.
CONTAIN 2.0 is provided with two aerosol injections into the containment: the primary circuit and the
core-concrete interaction. The former is given through the code input deck, whereas the latter is a result of
the VANESA module in CORCON-Mod3.
Some relevant hypotheses assumed in the aerosol treatment are:

NEA/CSNI/R(2009)5
171
−
The size interval over which aerosol distribution extends is partitioned geometrically.
−
The particle volume in a class i is at least twice the one in the previous smaller class.
−
The aerosol material density is assumed to be the same for all components.
−
The aerosol shape (considered through dynamic and agglomeration shape factors) is independent of
aerosol composition.
−
The medium in which the aerosol processes are assumed to occur has fixed composition and is taken
to be air.
−
Gas properties appearing in equations for deposition rates are evaluated by-default for bulk
conditions.
−
The degree of turbulent agglomeration is fixed throughout the problem (input deck).
−
Thermal conductivity ratio between air and aerosol is not composition-dependent.
INTERACTION MECHANISMS
Agglomeration Brownian diffusion Friedlander
Differential gravitational settling MAEROS code
(Fuch’s collision effciency)
Turbulent shear Saffman and Turner
(Collision efficiency set to 1.0)
Turbulent acceleration in eddies Saffman and Turner
(Fuch’s collision effciency)
Steam condensation Moving-grid Solute effect
Kelvin effect
Mason equation
Fixed-grid
(default model)
None of above
effects modeled
NATURAL DEPOSITION MECHANISMS
Gravitational settling MAEROS code
Diffusiophoresis Waldmann & Schmidt
Thermophoresis Talbot
Diffusion MAEROS code
ESF DEPOSITION MECHANISMS
Sprays Diffusion
Diffusiophoresis
Thermophoresis
Impaction
Interception
[12]
Ice condensers Gravitational settling
Diffusion
Diffusiophoresis
Thermophoresis
Impaction
Interception
ICEDF code [13]
Fan coolers Diffusiophoresis Waldmann & Schmidt
Pools Core-concrete interactions VANESA (SCRUB) [14]
BWR suppression pools SPARC (85) [15]

NEA/CSNI/R(2009)5
172
Processes and systems with impact on aerosols
DESCRIPTION TREATMENT
Atmosphere/Pool
Thermal-Hydraulics &
Intercell Flow
Atmosphere bulk fluid:
−
Non-condensable gas
−
Coolant vapor
−
Homogeneously dispersed
liquid coolant
Pool bulk fluid
−
Coolant
−
The cell fluids are stagnant
and well-mixed
−
Flow occurs through flow
paths
−
Flow is controlled by a fluid
slug with an effective length.
−
Flow paths are not
repositories
Lower Cell and Cavity
Core-concrete
interactions(with/without
overlying coolant):
−
Basemat ablation
−
Production of gases and
steam (H
2
, CO,CO
2
, H
2
O)
and ablation products
•
CORCON-MOD3 (the
VANESA code is inte-
grated):
−
Gas generation
−
Convective or boiling heat
transfer
−
Aerosol generation
Aerosols are scrubbed if there is
a coolant pool on the core debris
upper surface.
or, alternatively,
•
A one-dimensional system of
material layers
Direct Containment Heating
Molten debris ejection (under
high pressure) as a finely
dispersed collection of
particles into the containment
•
Standard containment models
(intercell flow, two-phase
atmosphere and coolant
thermodynamics, heat
transfer to structures,
radiative heat transfer,
hydrogen transport and
combustion, …) and
•
A suite of DCH-specific
models (transport and
trapping of multiple dispersed
core-debris fields, debris
droplets chemistry,
convection and radiation heat
transfer from the debris, …).
Fission Product Behaviour
−
Fission product assigned to
repositories (hosts):
atmosphere gas, suspended
aerosols, coolant pool, and
structure surface.
−
Fission product transfer
between hosts feasible.

NEA/CSNI/R(2009)5
173
DESCRIPTION TREATMENT
−
Two alternate ways of
representing fission product
decay
Combustion
− Deflagration of premixed
gas
−
Diffusion flame burning of
jets
−
Bulk spontaneous
recombination
−
Modified HECTR 1.8
−
Parametric model ( dynamics
of the diffusion flame not
modeled
−
Parametric model (user
provides recombination
threshold temperature and
time constant)
Heat & Mass Transfer
In-containment heat and mass
absorption of the thermal
energy entering containment
during a reactor accident.
−
Natural and forced
convection
−
Condensation mass and
heat transfer
−
Condensate film mass
transfer
−
Radiative heat transfer
−
Boiling heat transfer
−
Heat conduction
−
State of the art correlations
−
Heat/Mass transfer analogy
−
Fixed film thickness
(structure-pool) and film
tracking model (structure-
structure)
−
Net enclosure model and
direct radiation model
−
Adapted model from
CORCON
−
The solving method uses
finite difference techniques
Other models
− BWR suppression pool
vent discharge
−
Safety relief valve (SRV)
discharge
−
Fan cooler
−
Ice condenser
−
Sprays
−
Liquid transport system
components
Computational considerations
Overall, CONTAIN solves the aerosol equations by an explicit Runge-Kutta algorithm.
NEA/CSNI/R(2009)5
174
Steam condensation/evaporation onto/from particles is numerically handled in a different way depending
on the approach adopted (i.e., fixed- or moving-grid methods).
The fixed grid model models the condensation of water vapor onto aerosols and the evaporation of water
from them. Condensation is taken into account within the Runge-Kutta integration of the
integro-differential equation that describes aerosol evolution. Two solution methods are used for
evaporation. For high superheat, when aerosol water evaporation is insufficient to keep the atmosphere
saturated, a method of characteristics is employed. For evaporation under nearly saturated conditions, the
Runge-Kutta method is used.
The moving-grid model uses an algorithm based on the method of characteristics. After the effects of
condensation are calculated over a system timestep, the aerosol is remapped onto the fixed grid. This
remapping is performed by approximating the particle mass distribution as being constant with respect to
the logarithm of particle diameter.
The moving-grid method has the computational advantage of reducing numerical diffusion compared to the
fixed-grid one. However, this could result in an order-of-magnitude larger amount of computer time. In
addition, the fixed-grid method is more robust.
References
[1] K.K. Murata, D.C. Williams, J. Tills, R.O. Griffith, R.G. Gido, E.L. Tadios, E.J. Davis G.M.
Martínez, K.E. Washington “Code Manual for CONTAIN 2.0: A Computer Code for Nuclear
Reactor Containment Analyses” NUREG/CR-6533, SAND97-1735, June 1997
[2] K.D. Bergeron K.D. User’s Manual for CONTAIN 1.0, A Computer Code for Severe Nuclear
Reactor Accident Containment Analysis NUREG/CR-4085, SAND84-1204, Sandia National
Laboratories, Albuquerque, NM, May 1985
[3] B.E. Boyack “CONTAIN Independent Peer Review” LA-12866, Los Alamos National Laboratory,
Los Alamos, NM, 1995
[4] R. Vijaykumar, M. Khatib-Rahbar “Applicability of the CONTAIN Code Heat and Mass-Transfer
Models to Asymmetrically Heated Vertical Channels” Nuclear Technology 128,3, 313-326, 1999
[5] NEA “SOAR on Containment Thermalhydraulics and Hydrogen Distribution”
NEA/CSNI/R(1999)16
[6] M. Firnhaber, T.F. Kanzleiter, S. Schwarz, G. Weber “VANAM-M3: A Multi Compartment Aerosol
Depletion Test with Hygroscopic Aerosol Material” NEA/CSNI/R(96)26, 1997
[7] M. Firnhaber, K. Fischer, S. Schwarz, G. Weber “ISP-44 (KAEVER tests): "ISP-44 - Comparison
and Interpretation Report - Final”, NEA/CSNI/R(2003)5, 2003
[8] B. Clement, T. Haste “Comparison Report on International Standard Problem ISP-46 (FPT1)” Note
Technique SEMAR 03/021, 2003
[9] I. Kljenak, B. Mavko “Simulation of FPT1 Test Containment Phase with the CONTAIN computer
Code” IJS-DP-8614 rev. 1, Dec. 2002
[10] L.E. Herranz, L. Del Prá C., A.M. Rincón “CIEMAT Contribution to the PHEBEN-2 Project:
Interpretation of the PHÉBUS-FPT1 Experiment” CIEMAT 1025, Sept. 2003
NEA/CSNI/R(2009)5
175
[11] F. Gelbard “MAEROS User Manual” NUREG/CR-1391, SAND80-0822, Sandia National
Laboratories, Albuquerque, NM 1982
[12] N.A. Fuchs “The Mechanics of Aerosols”, Pergamon Press, 1964
[13] W.K. Winegardner, A.K. Postma, M.W. Jankowski “Studies of Fission Product Scrubbing with the
Ice Compartments” NUREG/CR-3248, PNL-4691, Richland, WA, 1983
[14] D.A. Powers, J.E. Brockmann, A.W. Shiver “VANESA: A Mechanistic Model of Radionuclide
Release and Aerosol Generation during Core Debris Interactions with Concrete” NUREG/CR-4308,
SAND85-1370, NM 1986
[15] P.C. Owczarski, R.I. Schrenk “Technical Bases and User’s Manual for the Prototype of a
Suppression Pool Aerosol Removal Code” NUREG/CR-3317, WA 1985
4.3.2 COCOSYS
Brief overview
The COntainment COde SYStem COCOSYS [1, 2] has been developed for the comprehensive simulation
of severe accidents in light-water reactor containments. The aim is to simulate all relevant phenomena,
processes and conditions that may occur inside the containment during such accidents. COCOSYS is also
able to simulate design basis accidents. One focus of COCOSYS is on the extensive consideration of
interactions between the various developing phenomena, such as thermal hydraulics, hydrogen
combustion, and aerosol and nuclide behaviour.
The structure of COCOSYS is shown in Fig. 4.3-1. The thermal hydraulic main module THY simulates
the thermodynamic of the steam/air atmosphere, atmospheric flows, hydrogen distribution, heat and mass
transfer to walls, heat conduction and storage in structures, H
2
deflagration, and pyrolysis processes. In the
aerosol and fission product main module AFP the transport and deposition behaviour of aerosols, the
behaviour of fission products including the decay heat release, and chemical reactions especially those of
iodine are treated. The
core concrete interaction main module CCI describes the physical and chemical
behaviour of the core melt, the concrete erosion, and the fission product release from the corium concrete
pool. Apart from the three main modules further programs are coupled to COCOSYS, namely DET3D for
the simulation of H
2
detonation, the commercial CFD code CFX for special fluid dynamic problems, and
the in-house-developed LAVA code for melt relocation from one room to a neighbouring one and
spreading. The data can be visualised both online and offline with the ATLAS programme. For the purpose
of complete sequence calculations COCOSYS has been coupled to the primary circuit code ATHLET-CD
which simulates core degradation.

NEA/CSNI/R(2009)5
176
THERMAL HYDRAULIC
zone models
junction models
H deflagration
pressure suppression
pyrolysis
safety systems
decay heat
2
AEROSOL-FISSION-
PRODUCT
aerosol behaviour
iodine behaviour
FP transport
nuclide behaviour
engineered systems
- filter
- spray
- pool scrubber
CORE-CONCRETE-
INTERACTION
corium erosion
melt chemistry
aerosol-FP-release
COCOSYS MAIN DRIVER
synchronisation, data management
ATHLET-CD
primary circuit
DET3D
H detonation
2
H deflagration,
distribution, jets
CFX 4
2
ATLAS
visualisation
LAVA
melt relocation
Fig. 4.3-1 Modular structure of COCOSYS
Aerosol modelling
The aerosol module AERIKA in the main module AFP describes the behaviour and the transport of a
multi-component polydisperse aerosol in a multi-compartment containment geometry. The aerosol may be
composed of up to eight chemically different aerosol components and the size distribution is discretised
into a number of size classes. All essential agglomeration and deposition processes are treated. The growth
of non-soluble and hygroscopic aerosol particles by volume condensation is modelled. The aerosol
retention by engineered systems like granular and fibrous filters, by water pools (pool scrubbing) and by
containment sprays is also modelled. Furthermore, all essential interactions with other containment
processes like the aerosol intercompartmental transport by gas and water flows, the
condensation/evaporation to/from aerosol particles, the depletion of aerosols carrying iodine, and the decay
heat release from airborne and deposited aerosols are treated.
The FIPHOST [3] module calculates the transport of the fission products within the containment. It
differentiates between the atmosphere, the aerosol and the sump water as fission product carriers. The
fission products can be deposited on surfaces in the atmosphere and in the sump. They are transported
together with the mobile carriers by the prevailing atmosphere and water flows. All relevant transfers
between the carriers are considered: aerosol deposition by natural processes or aided by technical systems
such as filters and spray systems, washing-off from walls, and the carrier change due to radioactive decay.
The module FIPISO [4] calculates the decay, the dynamic behaviour and the transport of fission product
inventory in the containment and the release to the environment. Generally, between 400 and 600 different
nuclides are considered in the calculation. The decay heat release in the individual zones and on the
individual carriers is taken into account in the THY main module.

NEA/CSNI/R(2009)5
177
Aerosol dynamics in a control volume
Within the module AERIKA in each control volume the aerosol dynamics are calculated by the model
MAEROS, developed by Sandia National Laboratories, USA [5], which is also used in other codes like
CONTAIN and MELCOR. The agglomeration kernel is determined by a two-dimensional integration over
particle size and the deposition coefficients by a one-dimensional integration. Owing to this accurate
method, a comparably low number of maximum 20 particle classes is sufficient. The aerosol coefficients
are calculated for various thermal hydraulic states at the beginning of a COCOSYS run and do not have to
be re-calculated anew for each time step. The first order ODE system for the aerosol concentration is
solved by FEBE (Forward Euler, Backward Euler) either implicitly or explicitly.
The way the coefficients for a multi-component system are calculated bring with it the following
restrictions: (1) aerosol material density is the same for all aerosol components (max. 8), all particles in
a certain size class have the same composition of materials, and (3) the dynamic and the agglomeration
shape factors are independent of the aerosol composition.
Particle growth by condensation is calculated by the moving-grid method, Moving Grid Analysis (MGA) [6]. In
contrast to the conventional fixed-grid method in MGA the grid of the particle size classes is apparently moved.
By this the numerical diffusion, which is an uncontrolled smearing of aerosol mass over several size classes, is
reduced. The Kelvin effect and the solubility effect for hygroscopic aerosols are included in MGA.
Table 4.3-1 gives an overview on the natural aerosol phenomena modelled in COCOSYS-AERIKA.
Table 4.3-1 Modelling of natural aerosol processes in COCOSYS
Phenomenon Mechanism
Modelling (reference and/or short
description)
Agglomeration
Brownian MAEROS [5]
Gravitational
MAEROS; optional collision efficiencies:
(1) Fuchs [7], (2) Pruppacher Klett [8], and
(3) Pruppacher Klett truncated
Turbulent shear MAEROS
Turbulent inertial
MAEROS; same collision efficiencies as for
gravitational agglomeration
Steam condensation
Condensation on non-soluble
aerosol
Mason equation including Kelvin effect;
Moving-grid-method (MGA) [6]
Condensation on hygroscopic
aerosol
Mason equation including solubility and
Kelvin effects;
Moving-grid-method (MGA)
Natural deposition
Sedimentation Stokes velocity with Cunningham correction
Diffusion Brownian (laminar) diffusion
Thermophoresis MAEROS
Diffusiophoresis Waldmann und Schmitt [9]
Resuspension
Dry resuspension by transient
gas flows
Extension of semi-empirical Fromentin
model [10]
Re-entrainment; droplet
production by bubble bursting
RECOM [11]

NEA/CSNI/R(2009)5
178
Aerosol interactions with other containment phenomena
An essential characteristic of COCOSYS is the fact that all important interactions between different
containment phenomena are taken into account. In Table 4.3-2 the modelled interactions between thermal
hydraulics, fission product behaviour and aerosol behaviour are summarised.
Table 4.3-2 Main aerosol - thermal hydraulic interactions modelled in COCOSYS
Interaction Modelled process Remarks
Thermal hydraulics
→ aerosol behaviour
Aerosol transport by gas flows
Aerosol transport by water flows
Diffusiophoresis
Particle growth by condensation
Dry resuspension by hydrogen deflagration Modelling not
completed
Re-entrainment (wet resuspension) from boiling
sump
Aerosol → thermal
hydraulics
FP aerosol decay heat releases into atmosphere,
walls and sump
Contribution of aerosol to the atmosphere
density
The modelled interaction processes take place with various strengths respectively velocities. This is
considered in COCOSYS by an adaptation of the numerical coupling of the models to the strength of the
prevailing interaction. In general tight couplings are used for fast interaction processes and loose ones for
slow processes.
The interactions were also thoroughly examined in two uncertainty and sensitivity analyses on a “dry” and
a “wet” aerosol case. In the first application the dry aerosol behaviour in the test VANAM M2 was
investigated [12]. The test was carried out in a nine-compartment geometry. 179 uncertain aerosol and
thermal hydraulic parameters were identified and analysed. The second application was on LACE test LA4
with a two-component aerosol under wet conditions, i.e. with steam condensation on the aerosol, in a
single volume geometry [13]. 58 uncertain parameters were selected.
The uncertainty of the aerosol results was found to be significantly larger in the wet case than in the dry
case. The main contributors identified were uncertain input parameters (dynamic and agglomeration shape
factors, diameter of injected particles), and the model option with/without Kelvin effect for condensation
calculation. The results revealed also the importance of uncertainties in thermal hydraulic boundary
conditions (atmosphere flows, volume condensation rate) for the calculated aerosol behaviour.
In another uncertainty and sensitivity study the modelling of the volume condensation rate was
investigated for a multi-compartment application [14]. The study shows that the uncertainty of the total
volume condensation rate in the entire containment is moderate and the local volume condensation rate in
certain compartments is large in parts, causes mainly by uncertainties in the calculated gas flows.
Engineered safety system
In AFP three engineered aerosol retention systems are modelled:

NEA/CSNI/R(2009)5
179
−
Filters (fibrous and granular)
−
Spray
−
Pool scrubber
In Table 4.3-3 the modelling of these systems is briefly described:
Table 4.3-3 Modelling of engineered aerosol retention systems in COCOSYS
System Retention mechanism Modelling (reference and/or
short description)
Fibrous filter
Diffusion
Semi-empirical model [15, 16],
use of Kuwabara-factor [17]
Interception
Impaction
Gravitation
Granular filter
Diffusion [18]
Interception
Impaction [19]
Gravitation [20]
Spray
Impaction Based on [7]
Interception
Diffusion Based on model in CONTAIN 2.0
[21]
Diffusiophoresis
Thermophoresis
Pool scrubber
Brownian SPARC-B [22], an extended
version of SPARC-90 [23]
Gravitational
Turbulent shear
Turbulent inertial
Validation
The aerosol modelling in COCOSYS has been continuously validated on experiments of the most
important containment projects within the last 20 years. Some older tests were calculated with the
COCOSYS precursor code FIPLOC. Table 4.3-4 gives an overview on the validation work performed. For
detailed descriptions of the tests mentioned see chapter 5.1.2 and 5.3.

NEA/CSNI/R(2009)5
180
Table 4.3-4 Validation work on the aerosol modelling in COCOSYS
Project Test Remarks
DEMONA
B2
LACE
LA4 Uncertainty and sensitivity analysis
with FIPLOC
VANAM
M1, M2, M2*,
M3, M4
International Standard Problem
ISP-37 (VANAM M3)
AHMED
NaOH tests CSNI benchmark exercise
KAEVER
K90, K106, K123, K148, K151, K156,
K159, K186, K187, K188
ISP-44 (KAEVER tests),
VICTORIA
61, 62 With FIPLOC
PHÉBUS
FPT0, FPT1 ISP-46 (PHÉBUS FPT1)
Status
Aerosol modelling in COCOSYS has been completed except for the processes dry resuspension and
re-entrainment. The modelling of the Kelvin-effect is not yet satisfactory because of numerical instabilities
occurring especially with multi-compartment applications.
References
[1] W. Klein-Heßling, S. Arndt, G. Weber COCOSYS V 1.2 User Manual GRS-P-3/1, 2000
[2] H.-J. Allelein, S. Arndt, W. Klein-Heßling, S. Schwarz, C. Spengler, G. Weber COCOSYS:
Status of Development and Validation of the German Containment Code System Technical
Meeting on Severe Accident and Accident Management for NPP, Japan, March 2006
[3] S. Arndt, G. Weber FIPHOST - A Module to Calculate the Fission Product Transport in a LWR
Containment GRS-A-2553, April 1998
[4] U. Hesse FIPISO-98, ein Rechenmodell zum Nuklidverhalten in einem Raumzellensystem nach
einem Reaktorstörfall GRS-A-2750, 1998
[5] F. Gelbard MAEROS User Manual NUREG/CR-1391, 1982
[6] F. Gelbard Modeling Multicomponent Aerosol Particle Growth By Vapor Condensation Aerosol
Science and Technology 12:399-412, 1990
[7] N. A. Fuchs The Mechanics of Aerosols Pergamon Press, Oxford, 1964
[8] H. R. Pruppacher, J. D. Klett Microphysics of Clouds and Precipitation Reidel, New York, 1978
[9] C. N. Davies Aerosol Science Academic Press, 1966

NEA/CSNI/R(2009)5
181
[10] A. Fromentin Particle Resuspension from a Multi-Layer Deposit by Turbulent Flow Paul Scherrer
Institute, Würenlingen, Bericht Nr. 38, 1989
[11] A. Voßnacke Untersuchung zur Tropfenbildung an Oberflächen gasdurchströmter Flüssigkeiten bei
Störfällen in kerntechnischen Anlagen Dissertation, Ruhr-Universität Bochum, Bochum, 1999
[12] E. Hofer, B. Krzykacz, L. Langhans, G. Weber Uncertainties and Sensitivities in Aerosol
Calculations-An Analysis of a FIPLOC-M Application to the Experiment VANAM M2 PSAM
II-Conference, San Diego, 20 – 25 March 1994
[13] J. Langhans, H.G. Friederichs, E. Hofer, B. Krzykacz, B.M. Schmitz, G. Weber Unsicherheits-und
Sensitivitätsanalyse zum Aerosolmodell in FIPLOC-M, Teil 2: Nasses Aerosolverhalten im
LACE-Experiment LA4 GRS-A-2217, 1994
[14] G. Weber, E. Hofer, B. Krzykacz Uncertainty and Sensitivity Analysis of Fog Formation Rates
Calculated with the Containment Code FIPLOC-M J. Aerosol Sci., Vol.23, Suppl., pp S 269 - S 272,
1992
[15] K. W. Lee, B. Y. H. Liu Experimental Study of Aerosol Filtration by Fibrous Filters Aerosol Sci.
Technol., 1:35-46, 1982
[16] K. W. Lee, B. Y. H. Liu Theoretical Study of Aerosol Filtration by Fibrous Filters Aerosol Sci.
Technol., 1:47-62, 1982
[17] S. Kuwabara The forces experienced by randomly distributed parallel circular cylinders or spheres in
viscous flows at small Reynolds numbers J.Phys.Soc.Japan 14(4):527-532, 1959
[18] C. Gutfinger, G. I. Tardos Theoretical and Experimental Investigation on Granular Bed Dust Filters
Atm. Environment, 13:853-867, 1979
[19] T. D’Ottavio, S. L. Goren Aerosol Capture in Granular Beds in the Impaction Dominated Regime
Aerosol Sci. and Technol., 2:91-108, 1983
[20] G.I. Tardos et al. Experiments on Aerosol Filtration in Granular Sand Beds J. Colloid and Interface
Science, 71(3):616-621, 1979
[21] K.K. Murata et al. Code Manual for the CONTAIN 2.0: A Computer Code for Nuclear Reactor
Containment Analysis\NUREG/CR-6533, 1997
[22] K. Fischer Modellierung von Abscheidevorgängen in Wasservorlagen Battelle Ingenieurtechnik
GmbH, Eschborn BF-R68.411-1, 1998
[23] P.C. Owczarski, K.W. Burk SPARC-90: A Code for Calculating Fission Product Capture in
Suppression Pools NUREG/CR-5765, 1991
4.3.3 ART/REMOVAL
4.3.3.1 ART code
The ART (Analysis of Radionuclide Transport) code [1] has been developed at JAERI as a module of the
source term analysis code, THALES-2 [2] to analyse the behaviour of fission products (FP) in reactor
coolant system and containment during LWR severe accidents. The thermal-hydraulic condition needs to

NEA/CSNI/R(2009)5
182
be given as a function of time. The code can consider FP transport and removal by natural deposition and
by engineered safety features such as spray systems. As for the FP aerosol deposition, the code can treat
gravitational settling, thermophoresis, diffusiophoresis, Brownian diffusion and resuspension. For the
gaseous FP, the code can deal with condensation, chemisorption and revaporization. The code also
considers the aerosol growth by gravitational, Brownian and turbulent agglomeration and condensation or
revaporization of gaseous FP at the aerosol surface. Major physical models in ART were verified through
analyses of the international standard problems and JAERI’s WIND/WAVE experiments [3].
4.3.3.2 REMOVAL code
The REMOVAL (REMOval of Volatile fission products and Aerosol in an LWR containment) code [4]
was developed at JAERI to analyse the fission products behaviour in the containment of LWR during a
severe accident. Physical models considered in the code are
a)
agglomeration due to Brownian, gravitational and turbulent motion,
b)
Brownian diffusion
c)
thermophoresis
d)
diffusiophoresis
e)
spray removal by gravity and collision
f)
steam condensation onto aerosol particle
g)
entrainment form flashing pool.
In the analysis, the containment is divided into several compartments and the behaviour of the aerosol,
iodine and noble gas is analysed for each compartment assuming the uniformity inside the compartment.
Thermal-hydraulic condition should be given for each compartment as a function of time.
4.3.3.3 ART/REMOVAL (ART combined with REMOVAL model)
In order to participate in the ISP-44 (International Standard Problem No.44)
5)
, the hygroscopicity model
based on the Mason’s equation in REMOVAL code was tentatively combined with ART code because
ART does not treat it and the development of REMOVAL finished in early 1990’s [5]. It is noted that
present ART does not include the related REMOVAL model due to numerical problems. For calculation of
aerosol growth by steam condensation, the relative humidity at aerosol surface in Mason’s equation is
reevaluated taking into account the Kelvin’s effect and the Raoult’s law. Then, the equilibrium aerosol size
is calculated by iteration until the growth rate becomes zero. Since it usually takes much CPU time for
iteration calculation, REMOVAL calculates the equilibrium radius of aerosol by assuming the aerosol
surface temperature equal to atmospheric temperature and uses the calculated value during the iteration to
reduce computation time.
References
[1] T. Ishigami et al. "User's Manual of ART Code for Analyzing Fission Product Transport Behaviour
during Core Meltdown Accident" JAERI-M 88-093 (1988)
[2] M. Kajimoto et al. "Development of THALES-2, A Computer Code for Coupled Thermal-
Hydraulics and FP Transport Analyses for Severe Accident at LWRs and Its Application to Analysis
of FP Revaporization Phenomena" Proc. Int. Topical Meeting on Safety of Thermal Reactors,
Portland, pp.584-592 (1991)

NEA/CSNI/R(2009)5
183
[3] A. Hidaka et al. "Experimental Analyses of Iodine Behaviour under Severe Accident Conditions
with ART" J. Nucl. Mater. 248, pp. 226-232 (1997)
[4] K. Muramatsu, K. Abe, M. Ida, N. Watanabe, K. Soda, N. Yamano "Sensitivity Study on BWR
Source Terms using the THALES/ART and REMOVAL" Proceedings of the International
ENS/ANS Conference on thermal reactor safety, Vol. 6, pp.2407-2416 (1988)
[5] M. Firnhaber et al."International Standard Problem ISP44 KAEVER Experiments on the Behaviour
of Core-melt Aerosols in a LWR Containment Comparison Report TABLE OF CONTENTS"
NEA/CSNI/R(2003)5 (2002)
4.3.4 SMART
Brief theoretical description
SMART is a code that models containment aerosol and iodine behaviour. Fission products are assumed to
enter into containment in one of two physical forms, either as gases or dissolved or suspended in small
water aerosols generated by a primary heat transport system break discharge. The initial droplet size
distribution is considered to be log–normal and is characterised by two parameters: the geometric mean
diameter and the geometric standard deviation. In SMART, the geometric mean diameter is considered to
be equal to the critical diameter, where the critical diameter is defined as a diameter when the drag force on
the droplet exceeds the surface tension forces. Currently SMART does not model aerosol release during a
steam-only discharge, however this capability is being incorporated into the code.
SMART assumes that aerosol is transported within containment by bulk gas flows. Within a particular
node or a room, the liquid aerosol droplets undergo coagulation and also deposit on walls and floors due to
various natural phenomena (e.g., gravitational settling). To model the coagulation and removal processes
mathematically, the continuous aerosol size spectrum is divided into a finite number of intervals, and
within each interval, the aerosol size is assumed to be constant. The initial mass distribution of the fission
products in the aerosol size classes are provided by upstream analysis, while the changes in the fission
product masses in the size classes due to radioactive decay and build-up, coagulation and deposition in
containment are calculated in SMART.
Brief Description
Reactor
Components
Modelled
• Containment only
•
Emergency Filtered Air Discharge System (EFADS), models
aerosol removal by HEPA filters and iodine removal by charcoal
filters
•
Dousing (models water droplet aerosol formation by operation of
dousing systems)
•
Moderator (for removal of aerosols by moderator scrubbing)
Geometry
Idealization
• A network of nodes inter-connected by flow paths
•
Up to 200 nodes possible, nodalization must be consistent with the
thermalhydraulics containment model.
Inter-nodal
Transport
• Flow paths modelled as a fictitious pipe with convective flow of gas
mixtures, aqueous solutions, and water droplet aerosols (containing
dissolved or suspended fission products).

NEA/CSNI/R(2009)5
184
Thermalhydraulics
• Interfaces with a containment thermalhydraulic model (GOTHIC) to
obtain transient thermalhydraulic properties
•
Gases, fission products and aerosols in a node are assumed to be
perfectly mixed
•
Fission product and aerosol processes do not contribute to mass,
momentum or energy exchange (e.g. no feedback to thermalhydraulics
code)
Fission Product
Transport
Aerosol Transport
• Convective flow through links of fission products dissolved in water
droplet aerosols, bulk liquid or in the gaseous phase
•
Solid (dry) fission products are not modelled
•
Break or other discharge sources into a room
•
Convective flow out of holes to the external atmosphere
•
Removal by sinks (EFADS, adsorption of iodine on walls, aerosol
deposition on walls and floor)
•
Generation from precursors in radioactive decay-build up processes
•
Removal by decay
•
Iodine species alone can be transported and tracked between different
phases in each node (bulk water, condensing films, gas, suspended
water droplets, adsorbed on surfaces)
See fission product transport mechanisms above.
Aerosol processes modelled are
•
Generation of aerosols by break discharge or dousing
•
Aerosol agglomeration
•
Brownian
•
Gravitational
•
Turbulent-Inertial and Turbulent-Shear
•
Removal by Impingement (inertial impac
•
Moderator Washout
•
Gravitational Settling
•
Turbulent Deposition
•
Stefan flow
•
Thermophoresis
Reference
Private communication between J. Ball and the Chairman.
4.3.5 GOTHIC
The containment thermalhydraulics code GOTHIC has the potential to be developed into a code with
aerosol modelling capabilities, since it contains models to generate, entrain and transport small water
droplets while tracking these droplets. However, the current GOTHIC release (GOTHIC 7.2a) does not
contain aerosol modeling capabilities.
NEA/CSNI/R(2009)5
185
GOTHIC solves conservation equations for mass, momentum and energy for multi-component,
multi-phase flow and these equations are solved for up to three primary fields (Steam/gas mixtures,
continuous liquid, liquid droplet), and up to two secondary fields (mist, liquid components).
There are a few options available in GOTHIC to generate, entrain and transport small water droplets.
Droplets can be formed either by operations such as flashing (break discharge), by dousing, or by the user
specifying that droplets should be formed when the atmosphere becomes supersaturated with steam. For
example, the spray nozzle component is used to model containment sprays, ice condenser drain flows into
the lower containment and vessel spray systems. The nozzle model converts liquid flow through a flow
path, network link or 3D connector from the continuous liquid phase to the droplet phase with the fraction
of the liquid converted into droplets and the drop diameter specified as functions of time.
For modeling volume condensation, the user has the option of choosing a fog model, in which very small
drops are created when the atmosphere becomes supersaturated or the “mist” option, in which mist is
created when the atmosphere becomes supersaturated. In the fog model, the droplets can be tracked,
however, when small drops are combined with the large drops from a break or spray, the average drop size
is not representative of either population, resulting in possible excessive heat and mass transfer at the drop
surfaces. The mist phase is not combined with the drop phase and is assumed to move with the vapor
phase. When the mist concentration exceeds the user specified limit, the excess mist is either converted to
drops or is deposited in the liquid phase, depending on the user specification for the drop diameter from
excess mist. If the drop diameter from excess mist is set to zero, then the excess mist is deposited in the
liquid phase. Otherwise, new drops are created at the specified diameter (default is 200 µm).
Despite the potential for modeling some aerosol phenomena (wet aerosol) in GOTHIC, the code does not
currently allow fission product transport in any other component except the vapor phase. Incorporation of
aerosol phenomena to simulate fission product transport and deposition in containment would require
significant effort.
There is a GOTHIC development task, approved by the GOTHIC Advisory Group, to implement a drop
field distribution model into the next release of GOTHIC (7.3, not expected to be released for at least
2 years). This will allow GOTHIC to calculate a distribution of droplet diameters for each lumped control
volume and cell within a subdivided control volume. However, modeling fission product transport in these
aerosol droplets, or from dry aerosols, is not currently being considered for future development.
Reference
Private communication between J. Ball and the Chairman.
4.3.6 KUPOL
An aerosol model was implemented into the Russian thermal-hydraulic code KUPOL-M [1]. This coupled
version allows to simulate aerosol transport in a subdivided containment. For a lumped-parameter model a
complete kinetic equation of aerosol transport is the Liouville equation for a size distribution function. It
takes into account processes of condensation, sedimentation, convective exchange, diffusional, turbulent
and thermophoretic deposition as a source form and coagulation process as a collision integral form. We
will only consider the processes of condensation and evaporation onto and from aerosol particles and
aerosol coagulation. So, we write the equation in such a way:
The last term on the left-hand side of the equation represents steam condensation onto droplets with mass.
The first and the second terms on the right-hand side of the equation describe coagulation mechanism,
NEA/CSNI/R(2009)5
186
taking into account particle arrival into the given size space from the smaller ones and particle removal
from the given size space into the larger ones.
The accepted coagulation models use the coagulation kernels, simulating mechanisms of gravitational
coagulation, Brownian coagulation, turbulent and diffusional coagulation and turbulent shear one.
The differential equation of aerosol transport is solved by a fractions method [2]. The collision integrals are
expressed as a source form in each fraction.
References
[1] A.D.Efanov, A.A.Loukianov, N.N.Shangin, Yu.S.Yuriev, A.A.Zaitsev, S.L.Soloviev, L.I.Zaitchik
Development of a containment code KUPOL-М for a substantiation of the VVER's accident
localization system functions Proc. of ICONE10, #22281, Arlington, VA, April 14–18, 2002
[2] A.G. Godizov, A.D. Efanov, A.A. Lukianov, O.V. Supotnitskaya Simulation of processes of water
aerosol coagulation-condensation growth using a combination of methods of groups and fractions
Proc. of NURETH-11, Paper: 224, Popes’ Palace Conference Center, Avignon, France, October 2-6,
2005
NEA/CSNI/R(2009)5
187
5. RECENT VALIDATION WORK
5.1 Integral Experiments
5.1.1 The PHÉBUS fission product programme
Introduction
Since the TMI2 accident in 1978, an important international effort has been made on research on severe
accidents, involving integral experiments, separate-effect tests and model developments. The PHÉBUS-FP
programme has played and is still playing an important role in this landscape. A number of lessons have
been learned from the analysis of the results – see e.g. [1, 2] - and from their use for source term
assessment studies, [3]. As a result, increasingly better-qualified assessment tools have been developed but
remaining uncertainties have been evidenced. For reducing them IRSN, CEA and EDF have launched a
new International Source Term Programme comprising a series of separate-effect experiments, [4].
The international PHÉBUS FP programme, initiated in 1988 and supported by the European Commission,
is one of the major research programmes on severe accidents for light-water reactors. Regarding the
interpretation of PHÉBUS, an international co-operation has been established for more than ten years,
particularly helpful for the improvement and common understanding of severe accident phenomena. After
a short description of the facility and of the test matrix, below the main outcomes and results of the first
four integral tests are provided and analysed. Several results were unexpected and some are of importance
for safety analyses, particularly concerning fuel degradation, cladding oxidation, chemical form of some
fission products, especially iodine, effect of control rod materials on degradation and chemistry, iodine
behaviour in the containment. Prediction capabilities of calculation tools have largely been improved as a
result of this research effort.
Description of the facility and test matrix
The PHÉBUS FP programme is investigating key phenomena involved in LWR severe-accident sequences
through a series of five in-pile integral experiments. The facility provides prototypic reactor conditions
which allow the study of basic phenomena governing core degradation through to its late phase (melt pool
formation), hydrogen production, FP release and transport, circuit and containment phenomena, and iodine
chemistry. The phenomena studied take place (i) in the core region simulated by a 1-m long bundle of 20
irradiated fuel rods and a control rod, (ii) in the primary system components for which a steam generator is
simulated by a single inverted U-tube, (iii) in the containment building simulated by a 10 m
3
tank including
a sump, the atmosphere and painted wet and dry surfaces. All three of these components are scaled down
by roughly 1/5000 as compared with a French 900 MWe power plant. This is illustrated in Fig. 5.1-1. A
more comprehensive description can be found in, e.g., [5, 6].

NEA/CSNI/R(2009)5
188
Reactor Containment
Model
(10 m3)
Painted
Condensers
Sump
(100 l)
Sampling
furnaces
Sampling
furnace
Experimental
Cell
Phebus Reactor
Core
Test
Assembly
gamma
Spectro
Steam Generator
Model
Aqueous Sampling
FP Caisson
Phebus Reactor
Fig. 5.1-1 The PHÉBUS-FB facility
The test matrix is given in Table 5.1-1. The first two tests were performed in similar conditions except for
fuel burn-up (FPT-0 used trace-irradiated fuel whereas FPT-1 fuel had been irradiated to 24GWd/tU):
bundle including a silver-indium-cadmium control rod subjected to a steam-rich environment, hot leg
heated up to 700 °C, cold leg at 150 °C, acidic and cold sump water. For FPT-2, the bundle was subjected
to a steam-poor environment and the sump water was alkaline and evaporating at the end of the test. For
FPT-3, the silver-indium-cadmium control rod was replaced by a boron carbide one, other test conditions
being close to those of FPT-2. The FPT-4 test was of a different nature as it investigated the release of
low-volatility fission products and actinides from a debris bed made of fuel pellet fragments and oxidised
cladding shards heated up to the formation of a molten pool.
Table 5.1-1 PHÉBUS-FP test matrix
Test n° Type of fuel Fuel Degradation Primary Circuit Containment Date
FPT-0 Fresh Fuel
1 Ag-In-Cd rod
9 days pre irrad.
Melt Progression & FP
release in steam-rich
environment
FP chemistry and
deposits in non-
condensing steam
generator
Aerosol
deposition
Iodine
radiochemistry at
pH5
Dec. 2
1993
FPT-1
BR3 fuel
≈ 23
GWd/tU
1 Ag-In-Cd rod
Re irradiation
As FPT-0 with
irradiated fuel
As FPT-0 As FPT-0 July 26
1996
FPT-2 As FPT-1
BR3 fuel
≈ 32
GWd/tU
As FPT-1 under steam
poor conditions
As FPT-1 with effect
of boric acid
PH9 evaporating
sump
Oct. 12
2000
FPT-3 As FPT-1 with
B4C instead of Ag-
In-Cd
BR3 fuel
≈ 24
GWd/tU
As FPT-2 As FPT-0 PH5 evaporating
sump recombiner
coupons
Nov. 18
2004
FPT-4 EDF fuel 38
GWd/tU no
reirradiation
Low volatile FP&
actinide release from
UO
2
-ZrO
2
debris bed
up to melting
Integral filters in test device
Post-test analyses on samples
July 22
1999
NEA/CSNI/R(2009)5
189
Main outcomes with respect to FP transport
The release of volatile fission product is generally well calculated even if some codes using the CORSOR
approach tend to overestimate the kinetics at the beginning of the transient, [7, 8]. Semi-empirical models,
though not modelling all the processes, are able to do well using a consistent set of parameters for
separate-effect tests and PHÉBUS-FP integral experiments. The situation is more contrasted for less
volatile elements for which chemistry plays a major role. A better understanding of the underlying
phenomena has been gained using mechanistic models [8].
In the particular case of FPT-0, using trace-irradiated fuel, the early release of volatile fission products can
only be explained by taking into account fuel dissolution during the cladding oxidation phase. Barium
release is much smaller in the PHÉBUS tests performed in a bundle geometry than in separate-effect
annealing tests. This difference is attributed to interactions of fuel with the cladding material and maybe
iron which greatly reduce the volatility of barium, [9]. These two observations illustrate the strong
coupling between fuel degradation and fission-product release phenomena.
The release from the silver-indium-cadmium control rod is often not well enough calculated by certain
codes, especially for silver which has an important impact on iodine chemistry. The governing phenomena
are well understood but a modelling effort is still needed mainly concerning the coupling between
degradation and release.
Fission-product transport in the RCS is characterised by two zones of significant deposition coinciding
with sections in which temperatures dropped rapidly. These were the vertical section of the hot leg above
the bundle where the gas cooled from temperatures as high as 1600 °C down to 700 °C and in the steam
generator (SG) riser where temperatures cooled from 700 °C to 150 °C. For the first two tests, FPT-0 and
FPT-1, marked differences in volatility were seen for different elements where iodine and cadmium barely
deposited at all in the hot leg of the circuit with significant deposition only in the SG. Cesium deposition,
in contrast, was significant and nearly the same in both cooling zones; completing the range of volatilities,
others elements such as molybdenum and silver deposited primarily in the vertical hot leg with relatively
little additional deposition downstream.
Recent analyses performed applying a standard version of the ASTEC/Sophaeros code show that the code
is able to reproduce some important aspects of the FPT-0 and FPT-1 tests, principally vapor/aerosol
behaviour and total retentions, [10]. As for fission-product speciation, it is worth noting that cesium was
condensed in the hot leg of the circuit, thus not being transported as CsOH as often assumed in the past.
Calculation results indicate that cesium molybdate and iodide are the main species. Though the overall
retention in the circuit is well calculated, the deposition in the vertical hot leg is underestimated. This is
largely accounted for by the effect of simultaneously-developing flow characterised by much higher
temperature gradients and mass transfer to the wall than in the case for developed flow. The deposition in
the steam generator is generally overestimated by a factor of about two. A number of hypotheses have been
explored in relation to this discrepancy [10] and 2D particle-tracking calculations performed [11], but no
conclusive explanations have been so far obtained.
In the containment, thermal-hydraulics was mainly governed by the balance between the incoming steam
and its condensation. Simple lumped-parameter codes using a coarse noding (1 or few volumes) are able to
reproduce the measured phenomena. Most of the aerosol mass was deposited on the bottom of the
containment and most of the remainder on the condensing surfaces. A small fraction was observed on the
containment walls. The first two kinds of deposits are generally well captured by lumped-parameter codes
using classical models for gravitational settling and diffusiophoretic deposition [12] although some had
difficulties to reproduce the split between deposition on the bottom and on the condensing surfaces. A
NEA/CSNI/R(2009)5
190
mechanism based on turbulence damping in the boundary layer has been identified to account for the small
deposit (2 %) on the walls in FPT-1.
Generally speaking, the simulation by calculation codes of thermal-hydraulics and aerosol behaviour in the
PHÉBUS FP containment is satisfactory.
References
[1] M. Schwarz, B. Clément, A.V. Jones “Applicability of PHÉBUS FP results to severe accident safety
evaluations and management measures”, Nucl. Eng. Des. 209, 173-181 (2001)
[2] J. Birchley, T. Haste, H. Bruchertseifer, R. Cripps, S. Güntay, B. Jäckel “PHÉBUS-FP: Results and
significance for plant safety in Switzerland” Nucl. Eng. Des. 235, 1607-1633 (2005)
[3] J.M. Evrard, C. Marchand, E. Raimond, M. Durin “Use of PHÉBUS FP experimental results for
source term assessment and level 2 PSA” Proc. 5
th
Technical Seminar on the PHÉBUS FP
Programme, Aix-en-Provence, France, 24-26 June 2003
[4] B. Clément “Towards reducing the uncertainties on source term evaluations: an IRSN/CEA/ EdF
R&D programme” Proc. Eurosafe Forum, Berlin, Germany, 8-9 Nov. 2004
[5] M. Schwarz, G. Hache, P. von der Hardt “PHÉBUS FP: a severe accident research programme for
current and advanced light water reactors” Nucl. Eng. Des. 187, 47-69 (1999)
[6] B. Clément, N. Hanniet-Girault, G. Repetto, D. Jacquemain, A.V. Jones, M.P. Kissane, P. von der
Hardt “LWR severe accident simulation: synthesis of the results and interpretation of the first
PHÉBUS FP experiment FPT0” Nucl. Eng. Des. 226, 5-82 (2003)
[7] B. Clément, T. Haste “ISP-46 – PHÉBUS FPT1”, NEA/CSNI/R(2004)18, August 2004
[8[ R. Dubourg, H. Faure-Geors, G. Nicaise, M. Barrachin “Fission product release in the first two
PHÉBUS tests FPT0 and FPT1” Nucl. Eng. Des., article in press
[9] R. Dubourg, P. Taylor “A qualitative comparison of barium behaviour in the PHÉBUS FPT0 test
and analytical tests” J. Nucl. Mat. 294, 32-38 (2001)
[10] M.P. Kissane, I. Drosik “Interpretation of Fission-product transport behaviour in the PHÉBUS FPT0
and FPT1 tests” Nuclear Eng. Des. 236, 1210-1223 (2006)
[11] C. Housiadas, K. Müller, J., Carlsson, Y. Drossinos “Two-dimensional effects in thermophoretic
particle deposition: the PHÉBUS-FP steam generator” J. Aerosol Sci.32, pp. S1029-S1040 (2001)
[12] I. Kljenak, B. Mavko “Simulation of containment phenomena during the PHÉBUS FPT1 test with
the CONTAIN code” Proc. Nuclear Energy for New Europe 2002, Kranjska Gora, Slovenia, 9-12
Sept. 2002
5.1.2 ISP-46 (PHÉBUS FPT1)
Introduction
The objective of this ISP is to assess the capability of computer codes to reproduce an integral simulation
of the physical processes taking place during a severe accident in a pressurised water reactor, i.e. including
NEA/CSNI/R(2009)5
191
fuel degradation and associated hydrogen production and fission product release, fission product and
structural material transport in the primary circuit, aerosol behaviour in the containment and iodine
radiochemistry.
The ISP was conducted as an open exercise, with all the relevant experimental results being available to
the participants. It was divided into four phases:
•
Fuel degradation, hydrogen production, fission product and structural material release (‘bundle’,
phase 1);
•
Fission product and aerosol transport in RCS (‘circuit’, phase 2);
•
Thermal-hydraulics and aerosol physics in containment (‘containment’, phase 3);
•
Iodine chemistry in containment (‘chemistry’, phase 4).
The emphasis was on integral calculations (all phases). The aim was not to carry out interpretation work,
but to use the codes as in plant studies, i.e. with standard models/options as far as possible, representing the
facility in a similar level of detail; this constituted the mandatory ’base case’ calculation. A more detailed
‘best-estimate’ sensitivity study could also optionally be performed.
Fifteen different codes were used: ASTEC, ATHLET-CD, COCOSYS, CONTAIN, ECART, FEAST,
IMPACT/SAMPSON, ICARE/CATHARE, IMPAIR, INSPECT, MAAP4, MELCOR, SCDAP/RELAP5,
SCDAPSIM and SOPHAEROS, of these 4 are integral codes (ASTEC, IMPACT/SAMPSON, MAAP4
and MELCOR). For the base case, 47 calculations were received, with 21 for the optional best-estimate
version. Of the base case calculations, 14 were integral (at least 3 phases calculated).
For the base case, a noding scheme was recommended in the specification report. The bundle is divided
into 11 axial nodes and typically 3-5 radial rings, with normally 1 or 2 thermal hydraulic flow channels.
The circuit is divided into 11 nodes, this being the minimum considered necessary for an adequate
calculation of deposition. The containment model is simple, with 1 node for the main volume and 1 for the
sump, taking advantage of the well-mixed conditions. For best-estimate calculations, often only noding
density was increased by typically a factor 2 or more, at the choice of the user.
The results were analysed in detail, comparing the results amongst each other and with the FPT1 data.
There was considerable scatter amongst the results obtained from each code by different users, the ‘user
effect’. To minimise this effect, representative cases were selected where necessary, taking into account the
quality of key output variables, completeness and accuracy of the technical reports, and including code
developers where possible. This analysis led to an assessment of the main models in each of the four areas
considered. Here only phases 2 and 3 dealing with aerosols are summarised below. There was on the whole
little significant difference between the base and best-estimate cases, with at most a small improvement
only in the results of the latter cases, so conclusions could be drawn on the basis of the former.
Assessment of codes and models
The following phenomena/parameters are in general well simulated by the codes:
•
Bundle – thermal response (given adjustment of input nuclear power and shroud thermal
properties within experimental uncertainties), hydrogen production (including oxidation of
relocated melt), bundle final state material distribution (given suitable reduction of the bulk fuel
relocation temperature from the ceramic value, in the longer term a more mechanistic model is
desirable), total release of volatile fission products;
NEA/CSNI/R(2009)5
192
•
Circuit – total retention of fission products and structural materials (but after cancellation of
errors);
•
Containment – thermal hydraulic behaviour (as exemplified by average gas temperature,
pressure, relative humidity and condensation rate), depletion rates;
•
Chemistry – models of the Ag/I reaction in the liquid phase are adequate for FPT1 (this cannot be
extended to other cases where the Ag is not so much in excess with respect to I; due to the large
excess of silver, in the experiment, radiolytic production of gaseous iodine and dissociation of
silver iodide did not play an important role in the overall iodine behaviour).
The following phenomena/parameters were reasonably well simulated, but some modelling improvement
is desirable:
•
Bundle – outlet coolant temperatures (overprediction), time dependence of volatile FP release
(generally too fast a release at low temperatures, e.g. for CORSOR-type approaches);
•
Circuit – distribution of deposition in the circuit (underestimation in the upper plenum where
vapor condensation and thermophoresis are the dominant mechanisms, overestimation in the
steam generator hot leg where the mechanisms are thermophoresis for all elements + vapor
condensation for I and Cd), noting that too coarse a noding leads to underestimation of
deposition;
•
Containment – relative importance of the two main depletion processes (diffusiophoresis and
gravitational settling), but it is hard to make firm conclusions owing to the variability in the
results;
•
Chemistry – no items identified.
The following phenomena/parameters were not well simulated and substantial model development is
necessary:
•
Bundle – release of medium and low volatiles (e.g. tendency to calculate low for Mo, very high
for Ba, reasonable order of magnitude for Ru and U but considerable scatter), and of structural
materials (Ag/In/Cd from the control rod where the basic process of evaporation from a molten
AIC pool is not captured, tin from the Zircaloy cladding);
•
Circuit – iodine speciation and physical form;
•
Containment – no items identified;
•
Chemistry – gas phase reactions, organic iodine reactions, including production and destruction
through radiolytic processes (definition of optimum parameters for the modelling codes such as
adsorption velocity and desorption rate on/from painted surfaces, and the facility to input the
gaseous iodine fraction at containment entrance, are recommended).
Concerning the circuit, the overestimation of bundle outlet temperature cannot fully explain the upper
plenum results; its main effect is to displace the zone where vapors nucleate. For some elements, part of
the discrepancy in the deposition pattern is due to the wrong prediction of the chemical form, and thus of
its volatility; Cs is generally calculated as a vapor at 700 °C, whereas it was condensed in the experiment.
However, this is also not enough to explain the underestimation in the upper plenum and overestimation in
the steam generator rising line. Finding explanations is presently part of the work performed in the frame
of the interpretation of PHÉBUS-FP tests.
NEA/CSNI/R(2009)5
193
Care is needed in extrapolating the rather good results for the containment directly to the reactor case, as
the PHÉBUS containment thermal hydraulics are relatively simple, and the role of gravitational settling is
overscaled, with a shorter residence time of aerosols in the atmosphere and probably less effect of
agglomeration than for real plants.
Concerning the
source term, the accuracy of containment calculations in integral treatments is sensitive,
often highly, to results of previous stages (propagation of uncertainties). Key features are the calculation of
FP release from the bundle, and of the structural materials Ag, In, Cd and Sn (the kinetics of release of
these and of FPs are as important as the final amounts); the temperatures at the entrance to the circuit,
which strongly influence the deposition pattern; while for those codes which calculate the chemistry, the
speciation is influenced by the calculated release. The release of structural materials was often
undercalculated or not calculated at all, leading to undercalculation of total mass of aerosols, but this had
only a weak impact on overall retention in the reactor coolant system (RCS) and depletion in the
containment. Iodine speciation and physical form in the circuit was poorly predicted - no code reproduced
the observed gaseous iodine fraction in the RCS.
5.2 Circuit
5.2.1 Revaporization in the FPT0, FPT1 and FPT2 circuits
The following is a review of information concerning chemical revaporization of deposits in the circuits of
the FPT0, FPT1 and FPT2 tests. The information comes from γ-spectrometry at the instrument station
known as Point C with corroborating data from γ-spectrometry of the steam generator located a little
further downstream. Some speculation on the mechanism affecting deposited cesium is included (after [1]).
The results of the FPT0 and FPT1 circuits were reviewed by Kissane [1]. Firstly, it must be said that no
evidence can be found of revaporization during FPT0 because the relevant spectrometer signals were
saturated for much of the test. Even so, if the apparent revaporization of hot-leg deposits seen in FPT1 and
2 (see below) also occurred in FPT0, it would probably not have been detectable. This is because the initial
inventory of fission products was quite low and the hot leg was, at the measuring station of Point C, a
low-deposition region of the circuit. For FPT1, evidence of revaporization is clear since about 40 % of the
Cs deposited at Point C (a zone of very light deposition, as in FPT0) was observed to relocate to the SG
riser following termination of the bundle transient - see Figure below. Indeed, this relocation appears only
to stop when isolation of the containment from the circuit occurred, i.e., steam flow stopped. No other
fission product (FP) was observed to relocate implying that relocation was not the result of mechanical
resuspension. Furthermore, the fact that the cesium species released from the deposit involved no other
(measurable) FP significantly limits the possible candidates for the revaporizing species.
For FPT2, at the 21
st
meeting of the CCIC Zabiego presented in some detail the current status of results
from sequential samples and on-line gamma-spectrometry measurements [2]. The findings are more
complex than for FPT1. Significant deposition was observed along the hot leg during the steam-starvation
phase. Deposits at Point C were then seen to lose some cesium (50 %), iodine (80 %), indium and rubidium
when the steam-starvation phase ended. Given that the flow regime at this location was laminar throughout
the test, mechanical resuspension would seem an unlikely explanation despite the relocation of a number of
FPs (though it would still be prudent to check that a refractory species such as silver was unaffected). The
results support the idea of partial re-vaporization of cesium, iodine, indium and rubidium from hot-leg
deposits when reducing conditions switched to oxidizing conditions. The shut-down phase also produced
loss of cesium from the Point C deposits as observed in FPT1. Coincidentally, downstream in the steam
generator, significant Cs deposition occurred after the core was shut down.

NEA/CSNI/R(2009)5
194
FPT1 - Cs
137
on-line activity measurement in the circuit hot leg (point C) and cold leg (point G)
0
200
400
600
800
1000
1200
1400
1600
1800
2000
0 5000 10000 15000 20000 25000 30000 3500
0
time from the test origin (s)
activity (MBq/cm)
zone of saturation
of point C detector
first oxidation phas
e
main release phas
e
late oxidation phas
e
containment isolatio
n
point C, 700°C
point G, 150°C
radioactive decay
radioactive decay
origin : fission
half-life t
1/2
: 30.174 years
isotope with similar behaviour :
Cs
136
, Cs
138
Cs desorption from point C
surfaces after reactor shut-down
Cs
137
core shut-dow
n
Fig. 5.2-1 (Figure 22 from [1]; Figure 5.2-18 of the FPT1 Final Report): FPT1 experimental data
on Cs activity at Point C (upper line in red) showing the drop in activity following core
shutdown that continued until steam injection stopped
Concerning the remobilization of Cs, it is well known that some Cs species tend to chemisorb on alloy
surfaces such as Inconel with “trapping” of a fraction of the Cs. The mechanism involves penetration of Cs
into the substrate and reaction with silica, present as an impurity. The trapping appears accentuated by
surface corrosion, longer times and higher temperatures. While the PHÉBUS hot leg was hot enough for
the effect to be very significant, crucially it did not have a pre-corroded surface. Furthermore, there were
revaporization experiments carried out in the RVP project on pipe samples cut from the vertical section of
the FPT1 hot leg. Though not directly comparable to Point C conditions, the sample zone most closely
resembling Point C shows a large fraction being easily resuspended in pure steam at 630 °C with only a
smaller fraction trapped in a low-volatility form. Indeed, despite the mixed nature of the deposit, the
revaporization rate was analogous to that of CsOH measured in control tests. Hence, revaporization of
largely untrapped Cs as CsOH from Point C fits the FPT1 observations and is compatible with some code
analyses.
References
[1] M.P. Kissane, “Interpretation of PHÉBUS tests FPT0 and FPT1: synthesis of analyses of
fission-product behaviour in the circuit”, Note Technique SEMAR 03/96, Oct. 2003
[2] M. Zabiego, L. Pantera, “FPT2 Data Analysis” in N. Girault, “Containment Chemistry Interpretation
Circle”, IRSN Compte Rendu de Réunion DPAM/SEMIC/2004-70, April 2004
5.2.2 FALCON (Including ISP-34)
5.2.2.1 Objectives and procedure
The FALCON small-scale experiments were performed at AEA Winfrith in 1992-3 and were intended as a
preparation for the PHÉBUS FP series of in-pile tests. Their primary purpose was to provide information

NEA/CSNI/R(2009)5
195
on the influence of fission product chemistry on circuit transport and containment deposition. Also
investigated were multi-component aerosol effects and vapor-aerosol interactions. In each experiment one
to six simulant fuel samples were heated by an induction furnace in a silica vessel. The samples contained
concentrations of non-radioactive fission product elements typical of high burnup fuel in a UO
2
matrix.
These included CsI, CsOH, Te, SrO. BaO and MoO. The pellets were clad in Zircaloy-4. Depending on the
experiment control rod alloy materials could also be included, clad in stainless steel. The temperatures
were increased sufficiently to burst the fuel and control rod pellets. Heating was then continued up to 3000
K to produce a continuous release of materials, transported by a carrier gas through the model circuit. The
carrier gas was mainly helium admixed with low concentrations of steam and/or hydrogen. Optionally
boric acid could be injected above the heated region.
5.2.2.2 Model circuit and experimental details
The circuit consisted of a thermal gradient tube of length 480 mm followed in the primary circuit
experimental series by a straight stainless steel pipe 800 mm long. In the containment series this pipe was
replaced by a stainless steel circuit with several bends followed by a steel box modelling the containment.
Analysts have largely considered the data from the thermal gradient tube to be of most interest [1] and this
component and the experimental data obtained from it will now be described in more detail. The geometry
of the thermal gradient tube varied during the test series. In the earlier tests, including FAL-17 and FAL-18
the first section of length 100 mm had a diameter of 35 mm, while for the remaining 380 mm the diameter
was reduced to 25 mm. In subsequent tests, including FAL-19 and FAL-20 the diameter was 25 mm
throughout. A series of five independently heated zones, each of length approx. 60 mm, allowed a wall
temperature profile to be maintained. A uniform temperature gradient was generally imposed, from 1100 K
to 400 K approximately. Both wall and gas temperatures were measured at selected points along the tube.
The tube was lined with stainless steel foil, which could be removed after the test for analysis. Bulk
deposits were examined with ICPOES, atomic absorption spectrometry, and colorimetry. Iodine was
collected in Maypacks and examined with X-ray fluorescence spectroscopy. Individual particles were
measured using energy dispersive spectroscopy with a scanning electron microscope, and particle
characterisation was also applied to obtain size and morphology data. Speciation was studied through
powder X-ray diffraction and X-ray photoelectron spectroscopy.
5.2.2.3 FALCON tests and ISP 34
As part of the ongoing series of code validation problems promoted by the CSNI [2] International Standard
Problem 34 was based on four tests of the FALCON series, FAL-17 to FAL20 [3, 4, 5, 6]. The first two
were primary circuit tests while the latter two used a circuit including a containment vessel. However as far
as circuit phenomena are concerned this made little difference. We here focus attention on the thermal
gradient tube. The sources differed in the materials injected into the carrier gas stream, as follows:
FAL-17 FAL-18 FAL-19 FAL-20
He (l/min) 10 10 4 4
Steam (cm
3
/min at 20 °C) 0.21 0.21 3.1 0
H
2
5 % of H
2
O 5 % of H
2
O 5 % of H
2
O 5 % of He
Boric acid (ppm) 2000 0 2000 0
The experimental results offered for comparison with analyses were the deposition profiles for a specified
series of elements.
NEA/CSNI/R(2009)5
196
5.2.2.4 Analyses
The ISP proved popular, attracting 50 submissions from 12 countries, using the system or circuit codes in
use at the time, including MELCOR VICTORIA and RAFT. The final report was issued in December 1994
[7, 8]. It was concluded that several chemistry issues of aerosol and fission product behaviour required
further code improvements, and that there was a strong user effect. It also appeared that revaporisation
might have been important in determining the final deposition profiles. Non-representative aspects of the
experiments identified included laminar flow conditions throughout and a high surface to volume ratio.
There were also uncertainties in the mass release rates.
[1] pointed out that for constant wall temperatures and carrier gas conditions (obtaining during most of
each experiment analysed) the percentage of a given element deposited at a specified location was
independent of the instantaneous release rate. These authors were thus able to treat thermal gradient tube
deposition in FALCON as a steady flow problem. They also noted that the deposition profiles for vapors
were qualitatively different from those for aerosols, the former showing a threshold dependent on the
condensation temperature. They used this finding plus correlations between the deposition profiles of
different elements to obtain information on speciation. It was concluded that
•
The results show that speciation is important, and can vary with the carrier gas composition
•
In the presence of excess boric acid Cs is predominantly in the form of cesium borate. In the
concentrations present in FALCON the borate condenses at a temperature 250 K higher than the
hydroxide
•
The iodine data are ambiguous; possibly in FAL-18 the dominant species was CsI, but the
volatility of iodine varied between tests, suggesting differing speciation
•
Molybdenum was more volatile in the boric acid tests
•
Cadmium showed similar behaviour in all tests
•
Silver was an aerosol in the test in reducing conditions, but entered the thermal gradient tube as a
gas in the other experiments
•
The deposition velocities of aerosol particles (deposited mostly by thermophoresis) appeared to
be largely independent of the aerosol composition
5.2.2.5 Status
Currently there are no ongoing analyses of the FALCON tests. The thermal gradient tube data from this
series are however are of good quality, despite uncertainties in the timing and magnitude of the releases
from the simulant source, and might usefully be revisited to help shed light on the circuit data from
PHÉBUS FP, which are copious but not always easy to interpret.
References
[1] I.M. Shepherd, Y. Drossinos, C.G. Benson Modelling fission product vapor transport in the
FALCON facility Nuclear Technology 110,181-197, 1995
[2] CSNI: CSNI International Standard Problems (ISP) Brief description (1975-1999).
NEA/CSNI/R(2000)5. May 2000
[3] A.M. Beard, P.J. Bennett Data report 23, Integral test 17, FAL/P(92)77 Winfrith Technology Centre,
May 1992
NEA/CSNI/R(2009)5
197
[4] A.M. Beard, P.J. Bennett FALCON data report 24, Integral test 18, FAL/P(93)83 Winfrith
Technology Centre, Jan 1993
[5] A.M. Beard, P.J. Bennett FALCON data report 26, Integral test 19, FAL/P(93)90 Winfrith
Technology Centre, Feb 1993
[6] A.M. Beard, P.J. Bennett FALCON data report 27, Integral test 20, FAL/P(93)94 Winfrith
Technology Centre, May 1993
[7] D.A. Williams OECD International Standard Problem No. 34, FALCON code comparison report.
AEA RS 3394, AEA Winfrith (June 1994)
[8] D.A. Williams OECD International Standard Problem No. 34 FALCON fission product experiments
FAL-ISP-1 and FAL-ISP-2 Comparison Report. NEA/CSNI/R(94)27 December 1994
5.2.3 STORM (Including ISP-40)
5.2.3.1 Recent analyses of the STORM deposition and resuspension experiments (ISP-40)
The STORM series of experiments was performed at the European Commission’s Joint Research Centre,
Ispra (Italy) in the period 1996-97. Each experiment was divided into two phases. In the deposition phase a
SnO
2
simulant aerosol carried by a steam-air-nitrogen mixture through a 63 mm diameter horizontal pipe
of length 5000 mm built up a layer of deposit, mostly by thermophoresis and eddy impaction, while in the
resuspension phase a higher-velocity nitrogen flow mechanically resuspended and relocated a fraction of
the deposit. The international standard problem ISP-40 was based on the two phases of STORM test 11 [1],
and is described elsewhere in Section 5.1.5.1. Subsequent to the publication of the ISP-40 Final Report a
number of teams have continued to analyse tests of the STORM series with the aim of providing further
support and validation to resuspension models, judged to be inadequate in the conclusions of the ISP.
Most of the information available on recent STORM analyses is to be found in the Final Report of the
EVITA project [2, 3] and concerns Test SR11. There has also been some work on STORM test SR09 [4],
the essential differences of which from SR11 are as follows. The deposition phase used the same simulant
aerosol SnO
2
and a similar steam-nitrogen-air mix as carrier gas, but took place at the slightly lower
temperature of 340 °C. The temperature difference between the test section wall and the gas stream was
50 °C, as compared with 100 °C in SR11. The carrier velocity was higher, 24.9 m/s versus 18 m/s in the
later test. This combination was expected to result in more deposition by impaction and relatively less by
thermophoresis. The deposited mass was similar in the two tests. The resuspension phase of SR09 took
place in a single step, at a nitrogen velocity of 52.3 m/s. As in SR11, to minimise thermophoresis during
this phase the gas and wall temperatures had the same value, 340 °C.
A team at VEIKI has re-analysed test SR11 using the SOPHAEROS module of the integral code ASTEC
v0.3. The test section was divided into 11 longitudinal sections, and the aerosol size distribution was
divided into 20 logarithmically equal size bins, ranging from 2 nm to 40 µm. These analysts found that
nearly all the deposition was by thermophoresis, and succeeded in calculating the mass deposited to within
30 %. The profile of the deposit along the tube was nearly flat in the calculations, although in the test an
estimated 30 % reduction in surface density of aerosol was seen from inlet to outlet. The calculated deposit
was then used in the resuspension phase. The resuspension rate calculated by the semi-empirical model
used in the code was found to be constant during each velocity step, and with default values for the
adhesive force and resuspension rate parameters matched the total mass resuspended rather well for the
earlier steps. As carrier gas velocities exceeded 60 m/s, however, the resuspended mass became
NEA/CSNI/R(2009)5
198
underpredicted, by a factor of two at the end of the final velocity step. Significantly, redeposition of
resuspended aerosol by impaction was predicted towards the outlet of the test section.
The JRC team and collaborators have continued the analysis of experiments of the STORM series,
including the deposition tests SD04, SD05, SD07, SD08, SR09, SR11, SR12 and the resuspension tests
SR09 and SR11 as well as SR12, again using SOPHAEROS. The deposition phase of SR10 was similar to
that of SR09 but with a lower carrier velocity, and the velocity during the resuspension phase was double
that in SR09. The deposition phase of STORM SR12 was identical to that of SR11, while the resuspension
phase had three steps with carrier velocities increasing from 90 to 110 m/s. Like the VEIKI team the JRC
reseearchers were able to achieve good prediction of the deposition phase in SR11, and their results for the
resuspension phase are similar.
The SOPHAEROS model [5] decides whether particles of a given size will resuspend on the basis of a
balance of adhesive and aerodynamic forces, the rate of the subsequent resuspension being calculated by a
semi-empirical model originally used in ECART. Predominant among the adhesive forces in the STORM
tests is the cohesive force, proportional to a user-specified cohesive force coefficient. With the default
value of this coefficient the predicted resuspension rate in SR09 is too great, but the JRC team found that
good agreement with the data, including the final profile of the deposit, could be achieved with a cohesive
force coefficient ten times the default value. The JRC team has also analysed tests SR10, SR11 and SR12
using the SOPHAEROS implementation of the Reeks-Biasi rock’n’roll model (see below). It has been
found that the rock’n’roll model underestimates the final resuspended fraction in all the tests analysed. The
time-dependence of the resuspension behaviour is also different from that observed. Nearly all the
resuspension is predicted to occur within a very short time, whereas the experimentally observed
resuspension has a duration of some 25 s.
The JRC analysis also points up the importance of the deposition mode in determining the resuspension
behaviour. In test SR10 a lower temperature difference between pipe wall and carrier gas resulted in a
significant contribution from eddy impaction to the total deposition, accompanied by an increased aerosol
mass median diameter. During the resuspension phase resuspension began at a lower fluid velocity than in
tests where the deposition was predominantly by thermophoresis (80 m/s in SR09 compared to 100 m/s in
SR12).
The use of semi-empirical models with adjusted coefficients is not very satisfactory, and a less empirical
resuspension model has been developed by [6] which is claimed to account for the resuspension behaviour
observed in several STORM tests, in preceding test series which were reviewed in the SOAR on circuit
aerosol behaviour [7] and in other experiments available in the literature, without becoming too complex
for use in engineering safety codes. The model assumes a log-normal distribution of adhesive forces, and
includes correlations for the geometric mean and standard deviation of the adhesive force distribution. It
has been found that the effective adhesion is much less than for particles in smooth contact with the pipe
surface, consistent with an effect of surface roughness, and that sub-micron particles are more tightly
bound when a deposit already exists than when there is less than a mono-layer of deposit present. The Biasi
model has been implemented in SOPHAEROS.
It should be noted however that in STORM and in other tests e.g. the VTT PSAERO [8] tests, the
resuspension rate for a given gas velocity declines with time, and there is also a contribution apparently
due to gas acceleration [9] effects not currently accounted for (see chapter 3.5.1). Gas velocities favouring
resuspension also favour turbulent impaction, the models for which are not fully validated, and in
resuspension experiments the two processes are likely to occur simultaneously. Compounding of model
uncertainties may therefore occur during their analysis. A further point is that essentially all the data
considered in ISP-40 and in subsequent related developments refer to dry aerosols, and separate-effect tests
to provide data on the resuspension of wetted and semi-liquid deposits do not appear to have been
NEA/CSNI/R(2009)5
199
performed. There is thus no great incentive at present for the development of models treating resuspension
from such deposits.
References
[1] P. Dilara, A. Krasenbrink, R. Hummel STORM test SR-11: ISP-40 Quick Look Report Technical
Note, Joint Research Centre, Ispra (Italy), March 1998
[2] H.-J. Allelein, K. Neu, J.P. Van Dorsselaere, K. Mueller, P. Kostka, M. Barnak, P. Matejovic, A.
Bujan, J. Slaby European validation of the integral code ASTEC (EVITA).
Nucl. Eng, and Desn.
221 (2003) 95-118
[3] H.-J. Allelein, K. Mueller et al. European validation of the integral code ASTEC (EVITA) Final
Report, Parts 1&2. European Commission report (2004)
[4] P. Dilara, A. Krasenbrink, R. Hummel, J. Area Capitao STORM test SR-09: Deposition of SnO
2
in
Partially Insulated Pipes with Steam and Resuspension of SnO
2
from Partially Insulated Pipes with
N
2
Quick Look Report. Technical Note, Joint Research Centre, Ispra (Italy), February 1998
[5] M. Missirlian, N. Alpy, M.P. Kissane “ASTEC V0 SOPHAEROS code version 2.0. Fission product
analysis in PWR circuits Theoretical manual, Rev 0", ASTEC-V0/DOC/00-06. NT/SEMAR/01/98,
December 2001
[6] L. Biasi, A. de los Reyes, M. Reeks, G. de Santi Use of a simple model for the interpretation of
experimental data on particle resuspension in turbulent flows
Journal of Aerosol, Science
32,1175-1200 (2001)
[7] A.L. Wright et al. Primary System Fission Production Release and Transport NEA/CSNI/R(94)2
(1994)
[8] A. Auvinen
a
, J.K. Jokiniemi
a
,. A. Lähde
a
, T. Routamo
b
, P. Lundström
b
, H. Tuomisto
b
, J. Dienstbier
c
,
S. Güntay
d
, D. Suckow
d
, A. Dehbi
d
, M. Slootman
e
, L. Herranz
f
, V. Peyres
f
, J. Polo
f
,
“SG tube rupture
(SGTR) scenarios” Nuclear Engineering and Design 235 (2005) 457–472
a
VTT Processes, Biologinkuja 7, P.O. Box 1602, VTT Espoo 02044, Finland
b
Fortum Nuclear Services, Vantaa, Finland
c
Nuclear Research Institute Rez plc, Czech Republic
d
Paul Scherrer Institute, Villigen-PSI, Switzerland
e
Nuclear Research and Consultancy Group, Arnhem, Netherlands
f
Centro de Investigaciones Energeticas, Medioambientales y Tecnologicas, Madrid, Spain
[9] N. Ardey, F. Mayinger Aerosol resuspension by highly transient containment flow: insights by
means of laser optical methods
Kerntechnik, 68-75 (1998)
5.2.3.2 ISP-40: aerosol deposition and resuspension
Uncertainty in the modelling of aerosol resuspension had been mentioned as as a problem in the SOAR of
1994 [1], although it was found difficult to ascertain its safety import. International Standard Problem
ISP-40 was set up to address aerosol deposition and resuspension phenomena in the reactor cooling system
and was based on test SR11 of the STORM series performed at the European Commission’s Joint Research
Centre, Ispra (Italy) in 1997 [2]. The scenario was one of nuclear aerosol deposition in the relief lines of a
PWR during a steam blackout followed by resuspension of the deposits by the steam surge resulting from a
core slump. Like other STORM tests the experiment upon which this ISP was based took place in two

NEA/CSNI/R(2009)5
200
Resuspension in steps
0
50
100
150
200
250
02468
Step no.
g/s N2
g deposit
phases. In the deposition phase SnO
2
simulant aerosol was transported through a horizontal test section
(diameter 63 mm, length 5000.5 mm) by a carrier gas consisting of a mixture of steam, N
2
, air, Ar and He.
The constant gas velocity was approx. 18 m/s, and while the gas temperature was approx 370 °C the wall
temperature was 100 °C cooler so that deposition took place largely by eddy impaction and by
thermophoresis. The aerosol had a GMD of 0.43 µm and a GSD of 1.7, and the deposition phase continued
long enough to build up 162 g of deposit.
The test section and its deposit were then kept at 370 °C for a period of about 24 hours, during which the
following phase of the test was prepared. In this resuspension phase, nitrogen gas was passed through the
test section in a series of mass flow rate plateaux, and the mass resuspended during each phase and its size
distribution were measured by downstream sampling stations. Velocities up to 127 m/s were investigated.
Fig. 5.2-2 shows the mass flow rates for the various steps as well as the mass remaining in the deposit after
each step. A feature of the STORM tests is that the mass distribution of the deposit along the pipe could be
measured by a radioactive tracer, and such profile data were collected in test SR11 for comparison with
predictions.
Fig. 5.2-2 Mass flow rate and mass remaining in the deposit
The ISP attracted 18 participants, who could choose to calculate one or both of the experimental phases.
The deposition phase was run blind, while for the resuspension phase participants were supplied with the
size distribution of the resuspended mass for each step in the gas flow. Contributions were collated in
January 1998. It was subsequently found that the steam flow during deposition had been given incorrectly.
More importantly, the sizes of the resuspended aerosols had been overestated by a factor of two. Working
now with open conditions, participants were invited to recalculate their submissions. Sensitivity studies
were also produced by some participants, and the final report of the ISP [3] was based on all submissions
received, taking due account of the data available to the participants at the time each calculation was made.
The final report came to the following conclusions:
1.
Modelling of thermophoretic deposition is adequate
2.
There are problems with the modelling of deposition due to turbulent flows
NEA/CSNI/R(2009)5
201
3.
Aerosol deposition and resuspension need to be treated together
4.
Aerosol retention depends strongly on the thermal-hydraulic conditions
5.
One-dimensional bulk parameter modelling is generally adequate to calculate aerosol retention in
fully developed flow in straight pipes
6.
The particle tracking codes used in this ISP are still in a preliminary phase of their development and,
while having a stronger physical basis, generally require the knowledge of parameters which are not
generally known
7.
In terms of the results obtained, there was a tendency of almost all codes to overpredict aerosol
deposition in the test pipe
8.
Aerosol resuspension can significantly affect the source term in the case of dry aerosol deposits in
turbulent flows
9.
Experimental data is needed for resuspension of aerosol mixtures with different liquid fractions
10.
Present aerosol resuspension models are inadequate
11.
The potential for resuspension depends strongly on the characteristics of the deposit
12.
Deposition models should give an indication of the state of the deposit, not only of the mass
deposited
13.
Separate effects tests are needed to relate the characteristics of the deposit to their chemical
composition and to the mechanisms by which the deposit was formed
14.
Mono-layer resuspension models are only a step towards the development of multi-layer models
Modelling and code effects
It is of interest for the appreciation of the impact of uncertainties in resuspension modelling to
quantify the variation in model predictions seen in the ISP-40 submissions.
Fig 5.2-3 shows the calculated masses of aerosol resulting from the deposition phase, and compares them
with the experimental value. With the exception of those from MELCOR users and the particle tracking
code MARIE predictions are similar, and may be considered acceptable. Note that the result marked Pisa-2
is produced by allowing resuspension to take place simultaneous with deposition. The predicted very low
net deposited mass is a result of too much resuspension.

NEA/CSNI/R(2009)5
202
Fig. 5.2-3 Total deposited mass
The situation is less encouraging for the resuspension calculations. Fig. 5.2-4 provides the fractions of
deposited mass remaining after each step of the resuspension part of the test, as calculated by each code but
normalised to the same total deposited mass to compensate for differences in calculations of the deposition
phase. The column corresponding to the experimental data is marked SR11. Very wide variations in
predicted resuspension behaviour with increasing gas flow can be observed, quite apart from the
differences in predicted total resuspended mass. For instance, ART predicts near-total resuspension at the
first velocity step, whereas one of the SOPHAEROS predictions has over 65 % of the deposit still present
after the final step with highest gas flow. The substantial user effect also visible (see the pairs of
calculations made using CAESAR, ECART, SOPHAEROS or VICTORIA) arises from uncertainties in the
parameters of the particular resuspension model implemented in each code. In addition, most codes
experienced difficulty in calculating the time-dependence of resuspension during each step. In the
experiment most of the resuspension took place over a relatively short time at the beginning of the step,
whereas a number of models calculated a constant resuspension rate for given thermal-hydraulic
conditions.

NEA/CSNI/R(2009)5
203
Fig. 5.2-4 Aerosol mass remaining in the deposit
Besides the resuspended masses participants were also invited to reproduce the measured size distribution
of resuspended aerosol. It was found in the test that increasing gas flow resuspended progressively smaller
particles, and this trend was broadly reproduced in the submitted calculations. However, the absolute sizes
varied very widely (see Fig. 5.2-5) and the trend mentioned was nearly absent in some calculations but
exaggerated in others.
Fig. 5.2-5 Geometric mean diameter of the particle at the outlet of the test pipe
NEA/CSNI/R(2009)5
204
References
[1] A.L. Wright et al. Primary System Fission Production Release and Transport NEA/CSNI/R(94)2
(1994)
[2] P. Dilara, A. Krasenbrink, R. Hummel STORM test SR-11: ISP-40 Quick Look Report Technical
Note, Joint Research Centre, Ispra (Italy), March 1998
[3] A. de los Reyes Castelo, J.A. Capitão, G. de Santi International Standard Problem 40 – Aerosol
Deposition and Resuspension Final Comparison Report, Joint Research Centre, EUR 18708 EN,
OECD NEA/CSNI/R(99)4 February 1999
5.2.4 WIND
WAVE experiments
Small-scale basic tests have been performed with the WAVE (Wide range Aerosol model Verification)
facility [1] at JAERI to investigate the cesium iodide (CsI) deposition onto the inner surface of a pipe
under typical severe accident conditions. In the tests, a crucible including the CsI powder was placed at
upstream part of the electrically heating test pipe and generated CsI vapor or aerosol was delivered to the
downstream pipe by nitrogen gas. Several coupons made of SUS304 were set in the test pipe and the
deposited mass on them were measured after the tests.
The tests with a horizontal straight pipe showed that a relatively large amount of CsI was deposited on the
upstream floor (bottom) of the pipe and at the downstream ceiling (top) of the pipe [1]. Analyses of the
experiments have also been conducted with the three-dimensional thermal-hydraulic code and the
radionuclide transport analysis code, ART [2, 3]. The experimental results were reproduced well with ART
by using a peripherally subdivided pipe cross section and associated representative thermal-hydraulic
information from the thermal-hydraulic code prediction. These experiments and analyses indicate that the
major deposition mechanisms for the chemical form of CsI are thermophoresis and condensation, both of
which depend on the thermal gradient in the gas.
Moreover, several tests using a quartz glass pipe with a 90 degree bend have been performed to investigate
the CsI aerosol behaviour at the bend and the effect of pipe orientation after the bend on aerosol behaviour
[4]. Three tests with horizontal, upward, and downward pipe orientation after the bend showed
enhancement of CsI deposition in the upward vertical pipe due to a transition from laminar to turbulent
flow. The flow regime in the horizontal and downward pipes was kept at laminar flow in spite of the same
flow velocity. The reason for turbulent flow only in the upward pipe is that the downward flow near the
low-temperature pipe surface is opposite to the direction of main stream. The ART calculation which
considers the thermal-hydraulics of only the main stream reproduced well the thermophoretic deposition in
the horizontal and downward pipes but underpredicted the deposition for the upward vertical pipe by one
order of magnitude. To precisely predict the deposition in the upward oriented pipe, the flow regime
should be evaluated carefully by taking into account the natural circulation in the pipe as well as the main
stream.
These studies showed that the coupling of the radionuclide behaviour and the detailed fluid-dynamic
phenomena was essential to accurately predict the CsI deposition at a bend or at a vertical pipe as well as
in a horizontal straight pipe. Little attention has been paid to such coupling in previous studies.

NEA/CSNI/R(2009)5
205
WIND experiments
The piping of reactor coolant system could be heated by high temperature gases from the reactor core
region and the decay heat of the deposited fission products (FP). Under such conditions, the integrity of the
reactor piping would be threatened by this temperature increase together with the high system pressure.
The WIND (Wide range piping Integrity Demonstration) project [5, 6] was initiated in 1993 to evaluate the
integrity and safety margin of reactor piping under severe accident conditions. The WIND project consists
of tests and analyses related to aerosol behaviour and piping structural integrity.
A schematic diagram of the WIND facility is shown in Fig. 5.2-6.
HHHHHH
H H H H H
HHHHHH
H H H H H
Argon Gas
Supply System
Buffer Tank
Induction Heating Type
Aerosol Generator
Nebulizer Type
Aerosol Generator
Upstream Test Section
Water
Mist Separator
Heat Exchanger
Dumper
Aspirator
Exhaust
Drain
Waste Water
Tank
Pump
Pump
Water
Steam
Generator
Aerosol Sampling
System
HEPA
Filter
Downstream Test Section
Water Purification
System
Aerosol
Chamber
Mixer
Fig. 5.2-6 Schematic diagram of the WIND facility
In the aerosol deposition tests, cesium iodide (CsI) aerosol was introduced into two horizontal test sections
connected in series. These sections consist of straight stainless steel pipes with an inner diameter of
approximately 10 cm and a length of 2 m. Argon or a mixture of argon and superheated steam was used as
a carrier gas to suspend and transport the aerosol into the test sections. Temperature gradients with the
maximum temperature of 1273 K and 973 K were developed in the test sections. The deposition density of
cesium onto the upstream test section in WAV1-D is shown in Fig. 5.2-7. The test results on the spatial
distribution of the aerosol deposition and the thermo-fluiddynamic analysis with the WINDFLOW code [7]
showed that the formation of a natural convective secondary flow of gases resulted in the deposition of CsI
onto the ceiling and side wall areas of the test sections and that the dominant deposition mechanisms were
the condensation of vapor and the thermophoresis of CsI aerosol [8]. No remarkable decomposition of CsI
was observed in the tests with environments of argon and superheated steam. The results obtained from the
aerosol deposition tests have been applied for the validation of the ART code, which is used for a detailed
analysis of the FP behaviour during a severe accident.

NEA/CSNI/R(2009)5
206
0.0
0.2
0.4
0.6
0.8
1.0
1.2
Floor
Wall 270°
Ceiling
Wall 90°
0.5 1.0 1.5 2.0
Deposition Surface Density (mg/cm
2
)
Axial Location (m)
0.0
(After deposition phase)
Fig. 5.2-7 Deposition density of cesium onto the upstream test section in WAV1-D
References
[1] A. Hidaka, et al. "Experimental and Analytical Study on the Behaviour of Cesium Iodide
Aerosol/Vapor Deposition onto Inner Surface of Pipe Wall under Severe Accident Conditions" J.
Nucl. Sci. Technol. 32 (10), pp.1047-1053 (1995)
[2] T. Ishigami et al. "User's Manual of ART Code for Analyzing Fission Product Transport Behaviour
During Core Meltdown Accident" JAERI-M 88-093 (1988).
[3] M. Kajimoto et al. "Development of THALES-2, A Computer Code for Coupled
Thermal-Hydraulics and FP Transport Analyses for Severe Accident at LWRs and Its Application to
Analysis of FP Revaporization Phenomena" Proc. Int. Topical Meeting on Safety of Thermal
Reactors, Portland, pp.584-592 (1991)
[4] A. Hidaka, et al."Deposition of Cesium Iodide Particles in Bends and Sections of Vertical Pipe under
Severe Accident Conditions" J. Aerosol Sci., 31(9), pp.1045-1059 (2000)
[5] K. Hashimoto, et al."Current Status of WIND Project" JAERI-Conf 99-005, pp.161-164 (1999)
[6] A. Hidaka, et al. "Experimental and Analytical Study on Aerosol Behaviour in WIND Project" Nucl.
Eng. and Des., Vol.200, pp.303-315 (2000)
[7] Y. Maruyama et al.Vapor Condensation and Thermophoretic Aerosol Deposition of Cesium Iodide
in Horizontal Thermal Gradient Pipes J. Nucl. Sci. Technol., 36(5), pp. 433-442 (1999)
[8] H. Shibazaki et al. Revaporization of CsI Aerosol in a Horizontal Straight Pipe in a Severe Accident
Condition Nucl. Technol., 134, pp. 62-70 (2001)

NEA/CSNI/R(2009)5
207
5.3 Containment Experiments
5.3.1 DEMONA
The DEMONA tests were performed to investigate the natural aerosol removal in a PWR containment
under core melt accident conditions. Their main objective was to demonstrate the validity of the aerosol
code NAUA. From 1983 to 1986 nine large-scale tests were carried out in the Battelle model containment
in Frankfurt/Main [1, 2]. The programme was sponsored by the German Federal Minister for Research and
Technology (BMFT) and the USNRC.
The 630 m
3
model containment was made of reinforced concrete and had roughly the shape of a German
PWR containment. The interior was subdivided into several compartments (Fig. 5.3-1).
Fig. 5.3-1 Battelle model containment for DEMONA tests
In each test the containment structures were heated up by steam releases first. Then the test aerosol
generated by three plasma torches was injected up to a maximum concentration of about 10 g/m
3
. Aerosol
material and composition as well as the thermal hydraulic conditions varied in each test (Table 5.3-1).
Except for test A9 a single room configuration of the containment was used.
Table 5.3-1 DEMONA programme test matrix
Test
Aerosol
material
Description
A1 SnO
2
Thermal hydraulic test without aerosol
B2 SnO
2
Dry test without volume condensation
B3 SnO
2
Base test with volume condensation
B4 SnO
2
Base test, repetition
B5 SnO
2
Test with delayed volume condensation
B6 Ag + MgO Test with low concentration and delayed volume condensation
A7 Fe
2
O
3
Base test, repetition with iron oxide aerosol
A8 Fe
2
O
3
+ SnO
2
Test with mixed aerosol
A9 Fe
2
O
3
+ SnO
2
Multi-compartment test with mixed aerosol and delayed volume condensation

NEA/CSNI/R(2009)5
208
The base test B3 simulated a scenario with a late overpressure failure of the containment. After the
SnO
2
-aerosol release the atmospheric pressure was kept constant by a steam injection near the bottom
which guaranteed a well mixing of the containment atmosphere. During the aerosol depletion phase a
moderate volume condensation took place accelerating the aerosol settling (Fig. 5.3-2).
A9 was the only DEMONA Test with a multi-compartment configuration. A four-room-geometry was
formed by closing several flow openings. The mixed aerosol injection was followed by a dry and a wet
depletion phase. The aerosol was inhomogeneously distributed with generally higher concentrations in the
lower compartments than in the upper ones (Fig. 5.3-3). Because of the limited number of aerosol sampling
stations it was not possible to measure spatial aerosol distribution in detail.
Fig. 5.3-2 Aerosol depletion in DEMONA base test B3
Fig. 5.3-3
Aerosol depletion in the DEMONA multi-compartment test A9

NEA/CSNI/R(2009)5
209
Calculations with the aerosol code NAUA showed a good agreement with the measured aerosol behaviour
in the dry DEMONA tests but had some deficits for the wet tests. The multi-compartment effects measured
in test A9 could not be considered by the single volume code NAUA. DEMONA test B3 was the subject of
a code comparison study initiated by the CEC [3].
References
[1] T. F. Kanzleiter DEMONA-Versuche Abschlussbericht, Final Report; BIeV-R65.523-01 (1987)
[2] W. Schöck, H. Bunz, R.E. Adams, M.L. Tobias, F.J. Rahn Large-Scale Experiments on Aerosol
Behaviour in Light Water Reactor Containments Nuclear Technology 81, pp 139 - 157 (1988)
[3] W. Schöck Assessment of the outputs from the various computer codes used in Member States to
study the behaviour of aerosols in LWR containments in case of severe accidents Final Report to
the, CEC, ECI-1413-B7210-85-D, KfK Karlsruhe (1987)
5.3.2 MARVIKEN-V
In the large-scale MARVIKEN-V tests (1982 to 1985) the transport and deposition of aerosols and volatile
species were measured in a simulated LWR primary circuit [1]. The reactor vessel, the pressuriser, and the
relief tank were the main components interconnected by pipes (Fig. 5.3-4). In five tests performed the
circuit geometry and the test conditions were varied. The effects of different temperature ranges (25 °C to
1200 °C), superheated steam, condensing steam, and water were studied. Non-radioactive materials were
used for fission product simulants (CsOH, CsI, Te) and core structure simulants (Ag, Mn). The materials
were vaporized by separate plasma torches forming condensation aerosols. The aerosol concentrations in
the tests lay between 36 and 132 g/m³.
Fig. 5.3-4 Sketch of the MARVIKEN-V test facility

NEA/CSNI/R(2009)5
210
Table 5.3-2 shows the test matrix. In the first three tests only the part of the circuit downstream of the
reactor vessel was used and thermal hydraulic conditions were varied. In tests 4 and 7 the whole circuit
was integrated and sequences with simultaneous core damage with fission product release and structural
aerosol release were measured. Table 5.3-3 summarises the results showing the aerosol retention in the
components and pipes measured in the five tests. The retention in the circuit ranged from 15 % in test 2A
to 74 % in test 4. Sedimentation and inertial impaction were the dominant deposition phenomena observed.
The data show also the high aerosol removal efficiency of the relief tank when filled with water. There are
some indications that the fissium and corium aerosols were not well-mixed in the reactor vessel. The
MARVIKEN –V experiments demonstrated that LWR primary circuits have some aerosol retention
capability. The generated data have been used for code validation.
Table 5.3-2 MARVIKEN-V test matrix
Test Geometry Conditions Aerosol
1
Pressuriser
↓
Pipe
↓
Relief tank
High temperatures
Relief tank dry
Fissium
2A
Low temperature
Condensation in piping
Water in relief tank
2B
4
Reactor vessel
PWR internals
↓
Pipe
↓
Pressuriser
↓
Pipe
↓
Relief tank
High aerosol concentration
Water in relief tank
Fissium + Corium
7
High aerosol concentration
Water in relief tank
Fissium
Fissium: simulated by a mixture of CsOH, CsI, Te;
Corium: simulated by a mixture of Ag, Mn
Table 5.3-3 MARVIKEN-V, Aerosol concentration and retention in different components (in %)
Test 1 2A 2B 4 7
Aerosol concentration g/m³ 35 62 51 132 52
Retention, %
Reactor vessel - - - 30 11
Piping to pressuriser - - - 8 3
Pressuriser 32 14 45 25 6
Piping to relief tank 4 1 5 11 20
Relief tank 10 85 49 26 59
Scrubber 41
Final filter 0.3 0.1 0.04 0.1 0.2

NEA/CSNI/R(2009)5
211
Reference
[1] J.O. Liljenzin, J. Collén, W. Schöck, F.J. Rahn Report from the MARVIKEN-V / DEMONA /
LACE Workshop Proceedings of the OECD/NEA Workshop on Aerosol Behaviour and
Thermal-Hydraulics in the Containment, Fontenay-aux-Roses (France), 26-28 Nov. 1990 CSNI
Report No. 176
5.3.3 LACE
The LACE tests [1-4, 6] were sponsored by an international consortium in the later half of the 1980's when
the understanding and identification of issues concerning aerosols in nuclear reactor accidents were still
developing. These tests investigated the behaviour of aerosols in high velocity gas flows and in large
models of containment buildings. Four LA tests were conducted. One of these tests, LA3, consisted of
three phases denoted by LA3A, LA3B, and LA3C. These LA tests were supplemented by three tests of
aerosol behaviour in high velocity gas flow through pipes called the 'Containment Bypass' or CB tests [5].
The facility used in the LA and CB tests is shown in Fig. 5.3-5. It consists of a piping system connected to
an 852 m
3
volume used variously to simulate an auxiliary building or a reactor containment building. In
tests of aerosol behaviour in high velocity gas flows, only the piping system of the facility was used.
Fig. 5.3-5 Schematic diagram of the facility used for the LACE tests
For the LA tests, the piping system was a 6.3 cm diameter, about 28 m long pipe with six 90° bends, two
vertical sections and four horizontal sections. In the CB tests, the 6.3 cm pipe connected to a 30 cm
diameter pipe and then to a scrubber.
Some of the details of the LA tests are shown in Table 5.3-. Test objectives and the qualitative results of
the tests are:
NEA/CSNI/R(2009)5
212
•
LA-1:
The LA-1 test was intended to simulate a containment bypass accident sequence with aerosol
passing through the reactor coolant piping system into a reactor auxiliary building vented to the air.
The aerosol used in this and other LA tests was a mixture of water-soluble CsOH and insoluble
MnO. More than 98 % of the aerosol was retained in the piping system. The aerosol behaviour in the
auxiliary building model is shown in Fig. 5.3-6 Revaporization of deposited aerosol was not
investigated in the test.
•
LA-2:
The LA-2 test examined the leakage from a containment volume with relatively large leaks at
elevations of 26.5 and 4.0 meters. The test was to explore the possibility of density stratification of
the aerosol-laden gas phase in the containment model much as had been suggested by results of the
DEMONA tests. About 38 % of the injected aerosol mass was allowed to leak from the containment
volume. No significant differences were observed in the mass escaping through high and low leaks
and it was concluded that no significant stratification of the gas phase in the containment volume
occurred.
•
LA-3:
The LA-3 test examined aerosol behaviour in high velocity flows through the piping system only.
The 3 phases of the test examined the effects of the gas velocity and the ratio of soluble, liquefied,
aerosol and insoluble, solid aerosol. In general, 70 % or more of the aerosol material was retained in
the piping system. Again, revaporization of the deposited aerosol was not studied in the LACE
program.
•
LA-4:
The LA-4 test examined the behaviour of aerosol in a containment. Cesium hydroxide aerosol was
injected for 50 minutes after the start of the test. MnO aerosol injection was started after 30 minutes
and continued for 50 minutes. During aerosol injection, the pressure in the containment model
increased to about 3 bar. It was held at this pressure for 200 minutes and, then, the containment
model was depressurised to simulate containment failure.

NEA/CSNI/R(2009)5
213
Fig. 5.3-6 Aerosol behaviour in the auxiliary building model during the LA-1 test
The CB tests examined aerosol behaviour in high velocity gas flows and were conducted much like the
LA-1 test though there were some differences in the piping system. Features of the tests are shown in
Table 5.3-5. The tests showed that large quantities of aerosol can be retained in the piping system. The
dispositions of aerosol following the tests are shown in Table 5.3-6. The variations in the amounts of
materials retained in the piping system in these tests strongly suggest that very hygroscopic aerosol such as
NaOH particles behave quite differently than aerosol materials like Al(OH)
3
that are much less
hygroscopic. The pertinence of this observation to reactor accidents depends critically on the chemical
forms of materials released as aerosol during the accidents.
References
[1.]. F.J. Rahn Summary of the LWR Aerosol Containment Experiments (LACE) Program - Interim
Report LACE TR-012, Electric Power Research Institute, Palo Alto, CA, January 15, 1987
[2] R.K. Hilliard, L.D. Muhlestein, T.J. Albiol, Final Report of Experimental Results of LACE Test
LA2 - Failure to Isolate Containment LA-TR-007, Westinghouse Hanford Company, Richland, WA,
June 1987
[3] D.R. Dickinson, R.K. Hilliard, L.D. Muhlestein D.C. Mecham, G. Carraro Aerosol Behaviour in
LWR Containment Bypass Piping - Results of LACE Test LA3 LACE TR-011, July 1987

NEA/CSNI/R(2009)5
214
[4] J.D. McCormack, R.K. Hilliard, J.M. Slgado Final Report of Experimental Results of LATE Test
LA4 - Late Containment Failure with Overlapping Aerosol Injection Periods LACE-TR-025,
October 1987
[5] G.R. Bloom, R.K. Hilliard, J.D. McCormack, L.D. Muhlestein Aerosol Behaviour Under LWR
Containment Bypass Conditions - Results of Tests CB-1, CB-2, and CB-3 LACE TR-001,
Westinghouse Hanford Company, Richland, WA, November 1986
[6] T.A. Allbiol, J.D. McCormack, L.D. Muhlestein Instrumentation and Measurement Techniques
Used in the LACE Program LACE TR-006, Hanford Engineering Development Laboratory,
Richland, WA, June 1987
Table 5.3-4 Features of the LA tests
Test CsOH
input rate
(g/s)
MnO input
rate
(g/s)
input gas
velocity*
(m/s)
aerodynamic
mass
median
diameter
(µm)
geometric
standard
deviation
Auxiliary
building
temperature
(K)
LA-1
1.8 2.3 97 1.64 1.91 388
P = 1.1 bar
LA-2
0.63 0.68 1.7 1.7 P varies 1.1
to 2.2 bar
LA-3
-3A 0.11 0.51 75 1.4 2.0 not used
-3B 0.10 0.76 24 2.4 2.0 not used
-3C 0.34 0.56 23 1.9 2.1 not used
* velocity at the start of the piping system. Because of pressure drop through the piping system, velocity
increases along the piping system.

NEA/CSNI/R(2009)5
215
Table 5.3-5 Features of the CB tests
Test Aerosol
Composition
Aerosol
input
rate
(g/s)
Aerodynamic
Mass Median
Diameter
(µm)
Geometric
Standard
Deviation
Input
Gas
Velocity
(m/s)
Gas
Temperature
(K)
Auxiliary
Building
Temperature
(K)
CB-1 100 % NaOH 3.0 3.9 2.9 100 459 358
CB-2 67 % NaOH
33 % Al(OH)
3
0.9 3.1 2.6 91 384 354
CB-3 100 % Al(OH)
3
2.0 4.3 2.5 97 433 351
Table 5.3-6 Disposition of aerosol in the CB tests and the LA-1 test
Test Retained in Pipes*
(%)
Auxiliary Building
horizontal surfaces
(%)
walls
(%)
vented
(%)
CB-1 58 26.9 7.1 8.0
CB-2 48 33.8 9.9 8.3
CB-3 14 46.4 5.2 34.4
LA-1 98 <1 - <1
5.3.4 ACE-B: large scale combined effects experiment
One large scale experiment was conducted at the Containment Systems Test Facility (CSTF) located at the
Hanford site in the USA. The CSTF, shown in Fig. 5.3-7 was consisted of an aerosol generation facility, a
test vessel (volume 852 m
3
) and associated equipment. The internal surface of the test vessel was painted
with the same epoxy coating as used in the RTF or laboratory scale ACE experiments. The purpose of the
large scale experiment was to evaluate the effectiveness of volatile iodine sinks (i.e., bulk aerosols, painted
surfaces, steam condensation and water reservoirs). Fig. 5.3-8 shows various phases of the experiment.
CsOH and MnO aerosol particles were fed in the test vessel in the first two phases. In addition, HI, in the
first phase, and I
2
, in the second phase, were injected. Steam was continuously fed in order to keep the
vessel wall at 100 °C for duration about 4.5 days. The pH value of the sump was kept at 5.6 until the I
2
injection, during which it was simultaneously increased to 8.5. The thermal-hydraulic parameters,
temperatures, pressure, wall condensation rate, pool water amount, were measured and the deposition
coupon samples were collected.

NEA/CSNI/R(2009)5
216
Fig. 5.3-7 Diagram of the CSTF test arrangement
The major output of the experiment was that both forms of iodine, HI and I
2
, were removed from the
atmosphere at the same rate as the aerosol material. The aerosol material (CsOH) had experienced
significant particle growth due to its hygroscopic nature which then enhanced the removal rate by
sedimentation. Airborne organic iodine constituted only 0.2 % of the initially introduced iodine after the
major species had been removed from the atmosphere by settling or deposition. Fig. 5.3-9 shows the total
iodine and particulate iodine concentration measured in the test vessel atmosphere during the experiment.
Fig. 5.3-8 The CSTF iodine experiment test sequence
Legend:
M: Monday,
Tu: Tuesday,
--
--
S: Saturday

NEA/CSNI/R(2009)5
217
Fig. 5.3-9 Total iodine and particulate iodine concentration measured during the CSTF experiment
5.3.5 VANAM (including ISP-37)
The VANAM tests (1988 – 1993) provided relevant experimental data for the validation of coupled thermal
hydraulic and aerosol codes for accident analyses [1]. Five large-scale tests were carried out in the 626 m³
Model Containment of the Battelle Institut in Frankfurt/Main. The main features of the VANAM tests were:
−
Multi-compartment geometry with locally different thermal hydraulic conditions
−
Local volume condensation and its effect on aerosol depletion
−
Behaviour of insoluble and hygroscopic aerosol materials in saturated and super-saturated steam-air
atmospheres
−
Impact of a hydrogen deflagration on aerosol behaviour (dry resuspension)
Table 5.3-7 gives an overview of the five VANAM tests. In test M4 the dry resuspension of settled aerosol
by a hydrogen deflagration was measured. Although the deflagration was rather mild a significant
resuspension effect was observed.
Table 5.3-7 Overview of the VANAM tests
Test
Aerosol
Material
Description
M1 SnO
2
Dry aerosol depletion period followed by a wet depletion period with wea
k
volume condensation
M2 SnO
2
Dry aerosol depletion period followed by a wet depletion period wit
h
strong volume condensation
M2* SnO
2
Dry aerosol depletion period followed by a further aerosol injection and
a
wet depletion period
M3 NaOH
Dry aerosol depletion period followed by a further hygroscopic aerosol
injection and a wet depletion period; Subject of ISP-37
M4
SnO
2
+
NaOH
Dry aerosol depletion period followed by a hydrogen-air-detonation wit
h
aerosol resuspension (Scoping Test)

NEA/CSNI/R(2009)5
218
The VANAM test M3 was subject of the International Standard Problem (ISP) No. 37 which dealt with
thermal hydraulics and aerosol behaviour in a LWR containment following a severe accident with core
melt down [2]. Only this test is decribed in more detail here.
The Battelle Model Containment (BMC) was made of reinforced concrete and consisted of nine individual
compartments interconnected by vent openings (Fig. 5.3-10). In the first test phase the BMC was heated up
by steam injected into compartment R5, representing the blowdown of the primary circuit over the
pressuriser quench tank. Then in test M3 a hygroscopic NaOH aerosol generated by three plasma torches
was injected into the steam-air-atmosphere during two separate periods. During and after the first injection
the non-condensing containment atmosphere was stratified causing an inhomogeneous NaOH aerosol
distribution. In the dome and in the upper compartments the NaOH concentration was significantly higher
than in the lower compartments. The depletion of the hygroscopic NaOH aerosol was somewhat faster than
the depletion of the insoluble SnO
2
in test M2* under similar conditions (r.h. approx. 90 %) because of the
hygroscopic water take up.
Fig. 5.3-10
Battelle Model Containment in the configuration for VANAM M3
After the second NaOH aerosol injection representing the aerosol release from the core concrete interaction
steam was injected into the central bottom compartment. This steam production was corresponding to a
contact of core melt to sump water and induced a natural convection which mixed the atmosphere in large
parts of the containment. In most compartments the rising steam content caused volume condensation
which increased the aerosol depletion significantly. Only in the annular part of R9 no volume condensation
occurred and the measured NaOH concentration there was for many hours up to two orders of magnitude
higher than in the other compartments (Fig. 5.3-11).

NEA/CSNI/R(2009)5
219
Fig. 5.3-11 Measured NaOH aerosol concentration in test VANAM M3
The ISP-37 consisted of a thermal hydraulic and an aerosol part. Main objective of the aerosol part of the
open exercise (the participants knew all relevant test results) was to calculate the inhomogeneous
distribution and the depletion of the NaOH aerosol. Representatives of 22 organisations from 9 OECD
member countries, two non-OECD countries and the CEC submitted a total of 23 thermal-hydraulic and
22 aerosol calculations. They used the codes CONTAIN, ECART, FIPLOC (a precursor of COCOSYS),
and MELCOR for coupled thermal-hydraulic and aerosol calculations, and MACRES, MOSAIC and
REMOVAL for stand alone aerosol calculations.
Fig. 5.3-12 to Fig. 5.3-14 show the results of the predominantly used codes. In the MELCOR standard
version the solubility effect was not modelled. The user’s influences on the CONTAIN and FIPLOC
results are high.

NEA/CSNI/R(2009)5
220
Fig. 5.3-12 ISP-37; NaOH aerosol concentration in the dome (CONTAIN)
Fig. 5.3-13
ISP-37; NaOH aerosol concentration in the dome (MELCOR, part 1)

NEA/CSNI/R(2009)5
221
Fig. 5.3-14 ISP-37; NaOH aerosol concentration in the dome (FIPLOC)
With most codes the thermal-hydraulic behaviour (pressure, temperatures, etc.) was calculated with
sufficient accuracy. But with respect to the needs of aerosol behaviour analysis the accuracies, both
analytical and experimental, of specific thermal-hydraulic variables like humidity, wall condensation and
heat transfer should be improved.
All codes with a tight coupling of thermal hydraulics and aerosol physics, i.e. CONTAIN, FIPLOC, and
MELCOR, predicted the tendency of the aerosol concentration during the course of the experiment well.
But the actually calculated NaOH concentrations showed a spread of approximately two orders of
magnitude at the end of the “dry” depletion phase and about five orders of magnitude at the end of the
“wet” depletion phase. Mostly the NaOH aerosol concentrations were overpredicted due to an
underestimation of the droplet growth by steam condensation, e.g. because of a missing solubility model.
With respect to reliable source term analyses some discrepancies are clearly too large.
In [1] the ISP-37 outcomes are summarised as follows:
Although much progress has been made in the simulation of aerosol behaviour in multi-compartment
geometries the calculated local concentrations scatter widely. However, the aerosol source term to the
environment is overestimated in general. The largest uncertainty concerning the aerosol results is caused
by a limited number of thermal hydraulic variables like relative humidity, volume condensation rate and
atmospheric flow rate. In some codes a solubility model is also missing.
By choosing a physically correct nodalization
8
the lumped-parameter concept was found to be basically
suited to predict the inhomogeneous distributions of gases and aerosols in the containment. But the user
has great influence on the calculated results, both the thermal-hydraulic and the aerosol ones if specific
nodalization features and different code options are selected unfavourably .
8
physically correct nodalisation means:
The nodalisation allows the simulation of all relevant phenomen, probably occurring in the case investigated

NEA/CSNI/R(2009)5
222
References
[1] M. Firnhaber, T.F. Kanzleiter, S. Schwarz, G. Weber International Standard Problem ISP-37
VANAM M3 - A Multi Compartment Aerosol Depletion Test with Hygroscopic Aerosol Material
NEA/CSNI/ R(96)26 (Dec. 1996)
[2] T. Kanzleiter Versuche zum Verhalten von Kernschmelzunfall-Aerosolen in einer
Mehrraum-Containment-Geometrie (“VANAM-Versuche”) Battelle-Institut e.V., Frankfurt am
Main Abschlussbericht BIeV-R67.098-01 (1995)
5.3.6 KAEVER (including ISP-44)
In the KAEVER (Kernschmelz-Aerosol-Versuche) project carried out from 1993 to 1997 at the Battelle Institut
in Frankfurt/Main the depletion behaviour of aerosols typical for LWR core melt accidents under various
thermal hydraulic conditions was measured [1]. The KAEVER tests are complementary to the large scale tests
of e.g. the VANAM and the LACE series in which the number of tests was limited due to high the costs.
As test aerosols the insoluble materials Ag and SnO
2
as well as the hygroscopic materials CsI and CsOH
were used. Single-component aerosols as well as mixed-component aerosols were investigated. The
horizontal cylindrical test vessel made of steel had a volume of 10.6 m³. Large parts of the walls were as
well thermally insulated as equipped with a wall heating (Fig. 5.3-15).
Some tests were repeated with the same aerosol and the same thermal hydraulic conditions in order to
check the reproducibility of the results (e. g. tests K100/K102 and K125/K148). All these tests could be
reproduced well. The differences in the results were insignificantly.
*
Origin
Z-Axis
X-Axis
2090
2500
475
Door
Door
Fig. 5.3-15 Top view of the KAEVER test vessel (numbers in mm)
The thermal hydraulic conditions for the tests have been varied between rather dry conditions (r.h. ≈ 0 %) and
saturated conditions with strong volume condensation, The conditions "slightly supersaturated" and "strongly
supersaturated" were achieved by two different test procedures. E. g. in the strongly supersaturated tests the
aerosol was injected into the cold test vessel fellowed by steam. The estimated condensation rate for strongly
supersaturated conditions (strong colume condensation rate) is 10
-4
kg/ (s⋅m
3
). This for slightly supersaturated
conditions (weak volume condensation rate) is 10
-5
kg/(s⋅m
3
). A total of 190 tests was performed. 33 of these
were evaluated in detail (Table 5.3-8).

NEA/CSNI/R(2009)5
223
Table 5.3-8 Evaluated KAEVER tests
Test Aerosol Thermalhydraulic conditions
(rh = relative humidity)
Remarks
K100 CsI rh = 0 %
K102 CsI rh = 0 % repetition of K100
K106 CsI rh = 85 - 90 %
K108 CsI rh = 95, goal 100 %
K110 CsI rh = 95, goal 100 % repetition of K108
K123 CsI rh = 100 %, weak volume condensation ISP-44
K125 Ag rh = 100 %, weak volume condensation
K128 Ag + CsI rh = 0 %
K130 Ag + CsI rh = 100 %, weak volume condensation
K131 Ag rh =85 - 90 %
K132 Ag + CsI rh =85 - 90 %
K134 Ag + CsI rh =85 - 90 % repetition of K132
K138 SnO
2
rh =85 - 90 %
K143 SnO
2
rh = 100 %, weak volume condensation
K148 Ag rh = 100 %, weak volume condensation repetition of K125, ISP-
44
K149 Ag rh =85 - 90 % repetition of K131
K150 no aerosol rh = 100 %, weak volume condensation fog formation test
K151 Ag strong volume condensation, steam released
into cold vessel
K156 no aerosol rh = 100 %, weak volume condensation fog formation test
K159 CsI strong volume condensation, steam released
into cold vessel
K167 CsOH rh = 0 %
K168 CsOH rh = 95 %
K171 Ag + CsOH rh =85 - 90 %
K174 CsOH strong volume condensation, steam released
into cold vessel
K175 Ag + CsI strong volume condensation, steam released
into cold vessel
K178 Ag + CsOH strong volume condensation, steam released
into cold vessel
K179 CsI + CsOH rh = 100 %, weak volume condensation
K181 CsOH rh =85 - 90 %
K183 CsI + CsOH rh = 85 - 90 %
K186 Ag + CsOH rh = 100 %, weak volume condensation ISP-44
K187 Ag + CsI +
CsOH
rh = 100 %, weak volume condensation ISP-44
K188 CsOH rh = 100 %, weak volume condensation ISP-44

NEA/CSNI/R(2009)5
224
Fig. 5.3-16 gives an overview of the experimental KAEVER results. It shows the normalised
9
aerosol
depletion rates measured for different aerosol components and different thermal hydraulic conditions. The
depletion rates in general increase with rising saturation ratio respectively rising volume condensation rate
because of the particle growth by condensation. The influence of the hygroscopic effect can be seen
clearly. CsI is weakly hygroscopic (Van't Hoff factor 1.7) and CsOH strongly (2.0). Under supersaturation
conditions, with weak as well as with strong volume condensation, the depletion rate of CsOH is always
the largest one.
Fig. 5.3-16 Comparison of depletion rates measured in the KAEVER tests
Five KAEVER tests were selected for the International Standard Problem ISP-44 which dealt, like the
earlier ISP-37, with thermal hydraulics and aerosol behaviour in a LWR containment following a severe
accident with core melt down [2]. In this exercise the main emphasis was put on the depletion behaviour of
different aerosol materials under thermal hydraulic conditions expected in a LWR severe accident scenario
over longer periods. The KAEVER tests selected were in particular:
−
K 148, test with insoluble Ag-aerosol
−
K 123, test with hygroscopic CsI-aerosol
−
K 188, test with strongly hygroscopic CsOH-aerosol
−
K 186, test with mixed aerosol of Ag and CsOH
−
K 187, test with a Ag-CsI-CsOH mixture (blind calculation)
The vessel geometry, the tests procedure and the thermal hydraulic conditions were the same in all tests.
First the vessel was preconditioned by release of steam and heat until quasi-stationary conditions were
obtained. In all selected tests the atmosphere was slightly supersaturated causing some condensation on the
insoluble Ag-aerosol and an increasing condensation on the soluble aerosols respectively. Then the
thermally generated aerosols were injected and the depletion of the aerosols in the vessel was measured
without any change of the boundary conditions.
9
in each case related to the maximum value for aerosol concentration measured in each test
strongly
supersat
urated
slightly
su p e r sa t
urated
slightly
superhe
ated
strongly
superhe
ated
Sn-Oxid
Ag
CsI/Ag
CsI
CsOH
CsOH/Ag
CsOH/CsI
CsOH/CsI/Ag
187
179
183
178
186
171
174
188
181
167
159
123
106
100
175
130
132
128
151
148
149
143
138
0.0
0.1
0.2
0.3
0.4
0.5
0.6
0.7
0.8
0.9
1.0
normalized depletion rate
thermal hydraulic conditions
aerosol component
Comparison of KAEVER depletion rates

NEA/CSNI/R(2009)5
225
Representatives of 10 organisations from 9 countries participated in the ISP-44. The codes used were
ASTEC-V0.3 (GRS-IPSN), COCOSYS V1.2 (GRS, RUB), CONTAIN 2.0 (IJS), MELCOR 1.8.3
(VEIKI), 1.8.4 (Studsvik, JRC, KAERI), 1.8.5 (NRI) and ART Mod2/REMOVAL (JAERI). Open
calculations were performed on all tests except K 187, which was offered as a blind exercise.
Several discrepancies occurred concerning the test with insoluble and slightly soluble materials. Fig.
5.3-17 and Fig. 5.3- 18 show the results of test K148 with a Ag-aerosol. It has to be said that several
calculations showing a good agreement with the measured aerosol concentration histories show other
results which are inconsistent with the measurement. E.g. four calculations show no airborne water and in
one calculation the water mass is far too high. Therefore only two out of nine calculations are in a good
agreement with the experimental results.
In MELCOR calculations on the three tests with the strongly hygroscopic CsOH the droplet growth was
either significantly overestimated or the solubility effect is simply ignored. The blind test K187 with a
Ag/CsI/CsOH-aerosol was well calculated by four out of ten participants. The other calculations showed
larger deviations from the measurement, e.g. no airborne water was calculated. Fig. 5.3-19 and Fig. 5.3-20
depict the results for test K187.
K148 Total Dry Concentration
1.0E-04
1.0E-03
1.0E-02
1.0E-01
1.0E+00
1.0E+01
0123456
Time [h]
Concentration [g/m³]
Ex p
KAER
JRC
STUD
VEIK
Fig. 5.3-17 KAEVER test K148, Ag-aerosol concentration (MELCOR)

NEA/CSNI/R(2009)5
226
K148 Total Dry Concentration
1.0E-04
1.0E-03
1.0E-02
1.0E-01
1.0E+00
1.0E+01
0123456
Time [h]
Concentration [g/m³]
Ex p
GRS
IJS
GRS- IPSN
RUB
JAER
Fig. 5.3-18 KAEVER test K148, Ag-aerosol concentration (miscellaneous codes)
K187 Total Dry Concentration
1.0E-04
1.0E-03
1.0E-02
1.0E-01
1.0E+00
1.0E+01
6 7 8 9 10 11
Time [h]
Concentration [g/m³]
Ex p
KAER
JRC
STUD
NRI
VEIK
Fig. 5.3-19 KAEVER test K187, Ag/CsI/CsOH-aerosol concentration (MELCOR)

NEA/CSNI/R(2009)5
227
K187 Total Dry Concentration
1.0E-04
1.0E-03
1.0E-02
1.0E-01
1.0E+00
1.0E+01
67891011
Time [h]
Concentration [g/m³]
Ex p
GRS
IJS
GRS-IPSN
RUB
JAER
Fig. 5.3-20 KAEVER test K187, Ag/CsI/CsOH-aerosol concentration (miscellaneous codes)
In ISP-44 the agreement of the results with the measurements of these fairly simple tests was not as good
as expected. In particular the aerosol condensation modeling and the accuracy of related thermal hydraulic
parameters were insufficient with some codes.
−
The solubility effect increases the growth of hygroscopic particles by condensation and enhances the
aerosol depletion. An appropriate modeling is absolutely necessary. The solubility model in
MELCOR needs some corrections.
−
The Kelvin-effect may slow down the depletion of insoluble and slightly soluble aerosols in a
condensing atmosphere. There are indications that the Kelvin-effect is not treated sufficiently by any
codes except ASTEC and COCOSYS. The modeling of the Kelvin-effect should be checked. In
some codes the numerical stability should be improved (e.g. COCOSYS).
In calculations with a correct aerosol condensation treatment the largest discrepancies in the aerosol results
were caused by the uncertain thermal-hydraulic variables “relative humidity” and “volume condensation
rate”.
The multi-component behaviour in the KAEVER tests was fairly easy to calculate, because the
components were well mixed among all particles. Experiments with incompletely mixed aerosol
components are needed to validate the multi-component capability of codes, as in an incompletely mixed
aerosol the composition of components is not the same for all particles.
ISP-44 showed a large user influence on the thermal hydraulic and aerosol results. Possible measures to
reduce this influence are the improvement of code input assistance, user training, further benchmarks, etc.
The KAEVER experiments calculated for ISP-44 had some measurement uncertainties (relative humidity,
wet droplet size, aerosol injection rate, etc). In future tests the measurement accuracy of important
parameters should be improved.
In the ISP-37 on test VANAM M3 all codes were already used except the new ones ASTEC and
COCOSYS. The earlier exercise comprised the depletion of a strongly hygroscopic aerosol in a

NEA/CSNI/R(2009)5
228
multi-compartment geometry and was more complex than ISP-44. Among the most uncertain variables and
models analysed were already “volume condensation rate”, “relative humidity”, and the solubility model.
This demonstrates the necessity to perform several exercises on an important topic within a certain time.
References
[1] G. Poss, D. Weber Versuche zum Verhalten von Kernschmelzaerosolen im
LWR-Containment-KAEVER Fachbericht BF-R-67863, Battelle Ingenieurtechnik GmbH, Mai 1997
[2] M. Firnhaber, K. Fischer, S. Schwarz, G. Weber ISP 44 – KAEVER Experiments on the Behaviour
of Core-melt Aerosols in a LWR Containment NEA/CSNI/R (2003)5 (Aug. 2002)
5.3.7 AHMED
Introduction
The AHMED facility was constructed by VTT (Technical Research Centre of Finland) to study the effect
of T-H on hygroscopic and inert aerosol behaviour in nuclear power plant containment during a
hypothetical severe reactor accident. The objective of this work was to understand the reason for the
observed large discrepancies between the results from model calculations and measurements carried out in
large scale experiments. The discrepancies may be caused by inaccuracies in aerosol modelling,
uncertainties in T-H conditions or measurement errors.
Facility description and instrumentation
Hygroscopic NaOH, CsOH and CsI and inert Ag aerosol behaviour at different temperatures and relative
humidities (RH) was studied in a well instrumented and controlled AHMED vessel of 1.81 m
3
total free
volume. The relevant parameters of the vessel are presented in Table 5.3-9.
Special emphasis was placed on temperature measurements, because of homogeneous temperature field
inside the vessel was necessary for the experiments. The vessel gas temperature (13 locations), inside and
outside surface temperatures (14 locations) and surround temperatures as well as pressurised air and steam
temperatures were measured using Pt-100 resistance type detectors (RTD).The RH was measured using
three Vaisala Humicap detectors.
Table 5.3-9 System parameters
Vessel volume 1.81 m
3
Vessel radius 63.5 cm
Vessel height 142.5 cm
Sedimentation area 1.27E4 cm
2
Pressure 1 atm
Sampling rate 2.6 l/min (206 % of volume/24h)
The vessel and input line pressures and steam and air flows were also monitored continuously. Input air
flow was filtered and dried. The vessel surface temperature was controlled using computer controlled
heating cables. The input gas temperature was regulated using a heat exchanger.

NEA/CSNI/R(2009)5
229
For aerosol characterisation state-of-the-art aerosol measurement systems were used. Aerosol number and
mass concentrations were measured continuously using a condensation nuclei counter (CNC) and a tapered
element oscillating microbalance (TEOM) mass monitor. Before the measurement the aerosol was dried in
an ejector-type diluter and in diffusion drier. Aerosol sampling into the diluter could be done from three
heights through heated sampling lines.
The dry size of the particles was measured using Berner low pressure impactors (BLPI). The results were
compared to measurements done with a TSI aerodynamic particle sizer (APS). A differential electrical
mobility analyser (DMA) was used to check that the amount of small particles was negligible.
The particle size distribution and chemical composition in the test conditions (wet particle size) were
analysed by Berner low pressure impactors (BLPI). Some size distribution measurements were also made
with a PALAS PCS-2000 Optical Particle Counter.
Spherical aerosol particles were generated from water solutions of aerosol material using ultrasonic aerosol
generator. Spherical Ag particles were made from AgNO
3
+ H
2
O droplets utilising a Lindberg tube furnace
at 900 °C. In order to ensure that no AgNO
3
particles were produced, the solubility of Ag particles
collected on Nuclepore polycarbonate impactor foils to water and nitric acid was measured with ICP-MS.
The Aerosol was always generated in the same way and it was also checked that the size distribution was
same during different generation times.
Experiments
At first the behaviour of aerosol of different chemical species was studied separately in AHMED facility.
Finally both Ag and CsOH aerosol particles were generated and injected into the AHMED vessel
simultaneously to study the behaviour of multicomponent aerosol. The temperature in the experiments was
varied between 17 °C and 51 °C and the RH between 7.3 % and 97 %. Approximate temperatures and RHs
during the different experiments, mass and number concentrations as well as aerodynamic mass median
diameters (AMMD) and geometric standard deviations (GSD) of the dry particle size distributions at the
beginning of the experiments are presented in Table 5.3-10
Before the experiments the vessel was purged with filtered air. It was also checked that the aerosol number
concentration measured with CNC was practically zero. After the aerosol generation was stopped the
aerosol in the vessel was mixed with a propeller having a very small sedimentation area to ensure constant
homogeneous concentration in the AHMED vessel. After the mixing the aerosol particles were settled in
the calm air and the aerosol mass and number concentrations were monitored continuously over 300
minutes. From this data the decay rate of different aerosols used in the AHMED experiments can be
characterised by a decay constant in a logarithmic scale.
Table 5.3-10 Experimental parameters
Material RH [%]
T [°C]
AMMD
[µm]
GSD Mass conc.
[mg/m
3
]
Number conc.
[1/cm
3
]
NaOH 22 50 2.4 1.6 112 64 000
NaOH 34 20 2.4 1.6 200 65 000
NaOH 82 27 2.4 1.6 208 137 000
NaOH 91 17 2.4 1.6 638 400 000
NaOH 96 23 2.4 1.6 218 165 000

NEA/CSNI/R(2009)5
230
Material RH [%]
T [°C]
AMMD
[µm]
GSD Mass conc.
[mg/m
3
]
Number conc.
[1/cm
3
]
CsI 27 23 2.3 1.7 102 71 820
CsI 82 24 2.3 1.7 98 94 500
CsI 96.5 27 2.3 1.7 94 92 700
CsOH 7.3 51 2.1 1.7 89 91 000
CsOH 33 19 2.1 1.7 86 48 000
CsOH 39 19 2.1 1.7 73 80 000
CsOH 96 23 2.1 1.7 64 77 000
CsOH 97 28 2.1 1.7 94 144 000
Ag 54 22 2.7 1.7 79 120 000
Ag+CsOH 91.5 24 2.1 (CsOH) 1.7 82 103 500
Ag+CsOH 91 25 2.1 (CsOH) 1.7 112 135 000
Ag+CsOH 97 24 2.1 (CsOH) 1.7 60 79 200
Results
Homogeneous temperature and RH conditions for aerosol measurements in the AHMED facility were
achieved. The maximum gas temperature differences were measured to be smaller than 0.4 °C. Apart from
the three sampling line connections the inside surface temperatures were 0.1 - 0.5 °C lower than the gas
temperature. The slightly lower temperature is enough to cause the necessary natural convection for mixing
and maintaining homogeneous aerosol concentration during the experiments [1]. Because the sampling
lines were heated, the inside surface temperature at these locations was 0.5 °C higher than the gas
temperature. The RHs were near each other at different locations inside the vessel and maintained nearly
constant levels during experiments. During some experiments the RH changed slightly, which could also
be seen on the measured wet particle size distribution.
Mass and number concentrations measured from three different heights were the same within the limits of
the measurement accuracy. The total mass and number concentrations followed each others fairly well at
the beginning of the experiments. Later the number concentration decayed slower than the mass
concentration. This was probably due to the small particles, which settled slowly but could not be seen in
the evolution of mass concentration. Mass concentration behaviour measured with TEOM and impactors
also agreed fairly well. The calculated decay constants decreased as a function of time because large
particles had higher sedimentation velocities.
For NaOH the ratio of aerosol mass concentration half lives at low to high RH experiments was about 4.
For CsI and CsOH this ratio was about 2. This difference was due to the density effect. CsOH and CsI have
higher densities than NaOH and thus during condensation their aerodynamic sizes do not increase as much
as the AMMD of NaOH aerosol. The mass concentration half lives for CsOH and NaOH decreased
smoothly as the RH was increased. For CsI the mass concentration behaved similarly as a function of time
at RHs 27 % and 82 %. CsOH and NaOH absorb water at all RHs, but CsI starts to absorb water as the RH
exceeds 91 %. The half life of silver aerosol was less than that of the other species. This was due to the

NEA/CSNI/R(2009)5
231
larger AMMD of the high density silver particles. However, silver behaved as a dry aerosol at all
humidities. The AMMD of silver particles at high humidity was the same as in the dry conditions.
Dry size distributions measured with BLPI and APS agreed within the measurement accuracy. The wet
mass size distributions measured only with BLPI showed that the AMMD of particles decreased as a
function of time due to settling of larger particles. It could be seen that the hygroscopic particles reached
their equilibrium size immediately after being exposed to high humidity. When there was a slight decrease
in RH the AMMD of CsOH particles was also observed to decrease. The measured AMMD of CsOH
particles was compared to the corresponding equilibrium values calculated from the literature data reported
for the van´t Hoff factor i. The equilibrium AMMD was calculated from the following equation [2]:
3/1
2/1
0,
0
1
1
1
+
−
=
RH
M
iM
AMMDAMMD
s
w
p
p
ρ
ρ
with
AMMD equilibrium diameter of the particle
AMMD
O
initial diameter of the dry particle
ρ
P
density of the measured (wet) particle
ρ
P,O
density of the initial (dry) particle
i Van't Hofffactor '
M
W
molecular weight of water
M
S
molecular weight of the soluble aerosol material
rh relative humidity
The Van’t Hoffs factor for CsOH is reported only down to 95.61 % RH [3]. Using this data, reliable values
can be obtained by semi-empirical method down to 90 % [4, 5]. In Table 5.3-11 the measured and
calculated AMMD values are presented. It can be seen that measured and calculated values agree within
the measurement accuracy. This comparison supports both the AHMED measurements and the method to
calculate equilibrium particle size.
Table 5.3-11 Measured and calculated AMMD of CsOH aerosol at different RH
AHMED Calculated
RH [%]
AMMD [µm] AMMD [µm]
Dry 2.1 2.1
97.0 3.4 3.55
91.5 2.6 2.77
91.0 2.7 2.74
Conclusions
The AHMED experiments filled the gap on our knowledge of hygroscopic aerosol behaviour and the
results can be used for aerosol model validation in containment codes. AHMED was the first facility where
NEA/CSNI/R(2009)5
232
the aerosol mass concentration could be monitored on-line and wet aerosol size distribution was measured
directly in containment conditions. The behaviour of hygroscopic aerosol was observed to be very sensitive
to RH at high humidity conditions. At the same RH the aerosol behaviour was not affected by changing the
absolute temperature as can be expected from the available water activity data. As the steam condensation
at supersaturated conditions is also well known [6], we may conclude that the data base for steam
condensation on aerosol particles in containment conditions is sufficient for code validation.
References
[1] N. Fuchs The mechanics of Aerosols. Pergamon Press, Oxford, pp. 250-257, 1964
[2] J. Jokiniemi The effect of airborne hygroscopic matter on aerosol behaviour in severe nuclear power
plant accidents Technical Research Centre of Finland, Publications 59 (Dissertation), 1990
[3] R.A. Robinson, R.H. Stokes Electrolyte Solutions, 2
nd
rev. ed. Butterworth, London, 1970
[4] H. Meissner Prediction of activity coefficients of strong electrolytes in aqueous systems ACS Series
133, pp. 495-511, 1980
[5] J. Jokiniemi The effect of selected binary and mixed solutions on steam condensation and aerosol
behaviour in containment Aerosol Sci. Technol. 13 (2), 1990
[6] P. Wagner Condensation processes in aerosols J. Aerosol Sci. 26 S1, pp. 203-204, 1995
5.3.8 VICTORIA
5.3.8.1 Introduction
The VICTORIA facility [1] is a scale model of the ice condenser containment of Loviisa NPP with linear
scale of 1:15 and volume scale of 1:3375. The height of the pressure vessel is 4.6 m and the diameter is
3.14 m.
The aim of aerosol experiments on the VICTORIA facility was to validate the containment aerosol models
used in the nuclear reactor accident codes. Especially important was to ensure that containment aerosol
codes were able to calculate correctly the radioactive hygroscopic and non-hygroscopic aerosol behaviour
in non-homogeneous multicompartment containments.
Two research programmes has been carried out on the VICTORIA facility. In the earlier research
programme (1990-1995) the thermal-hydraulic behaviour and hydrogen distribution were studied in severe
accident conditions [2, 3]. During 1996-1997 VICTORIA was used in a modified geometry for aerosol
experiments in a CEC Fourth Framework Programme project [4].
5.3.8.2 Facility description
Since experiments with VICTORIA facility were a part of the CEC Fourth Framework Programme project
Aerosol Physics in the Containment, details of the facility and its instrumentation is included in the
Asterism database.
VICTORIA containment
The dimensions of the pressure vessel were determined according to the chosen scale of the facility (1:15).
The cylindrical part of the liner was built on site out of galvanised steel plate (thickness = 1 mm). A dome
NEA/CSNI/R(2009)5
233
was attached to the upper part of the pressure vessel. The inner diameter of the dome of the steel liner
(thickness = 1.5 mm) was 2950 mm. Both the upper and inner surfaces were painted with alkyd paint. The
design pressure of the vessel was 3 bar, but the pressure relief valve was set to 1 bar [5].
All the structures that are of concrete in the containment of the Loviisa NPP are made out of concrete also
in the facility. All the concrete surfaces were painted with two component epox-paint, Reapox-GPL-VS.
The concrete level, at + 25.4-elevation, was replaced with plywood plate, coated on both sides with
phenolic resin. The upper level of this plate was at +25.8-elevation. There was two round holes
(∅ = 125 mm) at the edges of the plate (90° and 270°, r= 13.80 m / 0.92 m), through which the aerosols
and steam, injected into lower compartment, could flow into upper compartment of the containment. The
upper compartment free volume was 17 m
3
and the total free volume was 22 m
3
.
The ice condensers used in the previous VICTORIA experiments were removed before the aerosol
experiments. The ice condenser concrete structures, lower inlet doors and both the intermediate and top
deck doors were still part of the containment. A strong convective loop between the upper and lower
compartments, through the ICs, could be induced by opening the lower inlet doors of the two IC sections
non-simultaneously.
The lower compartment of the VICTORIA containment could be pre-heated. The pre-heating was done by
circulating hot water from central heating boiler in the piping below the lower compartment floor.
TH-measurements and control
The steam used in the experiments was generated by a small steam generator. The maximum capacity of
the steam generator was 25 g/s. The injection of steam flow into the containment was adjusted by a control
loop, which consists of regulator, control valve and flow meter. The injection run into the containment and
the maintenance of set values were controlled by a computer.
In the experiments the piping of both the containment outer spray and the inner spray is used as a exhaust
line of gases. The nozzles of the spray have been removed. The outer diameters of the pipes were 12 mm
and the wall thickness 2 mm. The exhaust line was needed to equalise the overpressure caused by aerosol
generation. The exhaust gases flowed through a heat exchanger and a filter in order to separate water and
particles.
The outlets of the drainage piping of the sumps installed in the containment were at the bottom of the
pressure vessel. The piping was made symmetrical from both of the sumps, in order to maintain uniform
flow out of the lower compartment.
Gas temperature was measured at 99 locations and wall temperatures at 65 locations with T-type
Thermocouples. Relative humidity (RH) was measured at 10 locations. In 8 locations the humidity was
measured with a VAISALA probe HMP 135Y, that measures relative humidity in range of 0...100 % and
temperature in range of 0 ... 160 °C. One probe in upper and one in lower compartment (VAISALA
HMP-243) could measure relative humidities in condensing condition. The temperature range of these
probes was -40 ... +180 °C. Pressure difference and water levels were measured in seven locations. The
total pressure and flow rates of steam and air into the vessel were measured as well.
5.3.8.3 Aerosol generation and instrumentation
The aerosols in the experiments were generated by two aerosol generators Water-soluble aerosol, either
NaOH or CsOH, was generated with two opposite jet atomisers. The dry particle AMMD was ~2.3 µm,
NEA/CSNI/R(2009)5
234
GSD ~1.9 and the feed rate was close to 3 mg/s. High temperature Laminar Entrainment Flow Reactor
(LEFR) was used in the generation of silver particles.
The piping from the aerosol generators (outer diameter = 23 mm, wall thickness 1.5 mm) was connected
into one injection line, which was directed into the upper or lower compartment of the containment. The
injection pipe was made out of acid-resistant stainless steel. The temperature of the injection line was kept
at slightly over 100 °C and it was adjusted by a separate controller.
Sampling lines from the upper and lower compartments of the containment, were also made out of
acid-resistant stainless steel (outer diameter 12.7 mm, wall thickness 1.65 mm). Heating cables, similar to
those in the injection line, were attached onto the surfaces of the collecting lines and the temperatures were
adjusted by controller of their own. The six sampling lines started from various locations inside the
containment. At the inlet of each line there was a conical cover installed, in order to prevent droplets and
impurities to enter the line. The samples passed through an ejector type diluter (PALAS), in which they
were conditioned for the measurement devices using dried air.
The aerosol number and mass concentration was measured continuously using a Condensation Nucleus
Counter (CNC) and the Tapered Element Oscillating Microbalance (TEOM) mass monitor. Particle mass
and chemical composition size distributions were determined with 11-stage multijet Berner type low
pressure impactors (BLPI). In order to measure the wet size distributions the impactors were placed inside
the vessel. The measurement size range of impactors was 0.03 - 15 µm [6]. The elemental concentration
collected on nuclepore filter substrates of each BLPI stage were analysed with Inductively Coupled
Plasma-Mass Spectroscopy (ICP-MS). The dry number size distribution was measured with an Electrical
Low Pressure Impactor (ELPI) and with a Differential Mobility Analyser (DMA). The size ranges of these
instruments were 0.01 - 5 µm for ELPI [7] and 0.02 - 0.8 µm for DMA. Settling of particles was studied
using deposition trays and deposition coupons. Coupons were acid resistant stainless steel and their size
was 46 x 70 mm. Samples were analysed using ICP-MS. Also on-line Optical Particle Sizer (OPS),
Aerodynamic Particle Sizer (APS) and filter samples were applied in the aerosol measurements.
5.3.8.4 VICTORIA aerosol experiments and analysis
VICTORIA aerosol experiments consisted of eight TH-experiments and aerosol generator tests as well as
four actual aerosol behaviour experiments. Detailed information on the seven preliminary tests, numbered
as 51…57, is presented in a data report [8]. Aerosol behaviour experiment number 58 and 59 belonged to
CEC Fourth Framework programme project Aerosol Physics in the Containment. In both experiments
aerosol was injected into the lower compartment of VICTORIA facility. The main difference between the
experiments was that in experiment 58 the aerosol material was CsOH, where as in exeriment 59 CsOH
aerosol was mixed with silver. Information on these experiments can be found in the final report of the
project [9]. Experiment number 60 was again a TH-test, in which steam and gas injection to upper
compartment was tested. In aerosol behaviour experiment number 61 and 62 the particles were also
injected to upper compartment of the facilty. As before the main difference between the experiments was
that in experiment 61 CsOH was applied as aerosol material, where as in experiment 62 the material was
silver. Results from experiments 60 and 61 have been published [10]. Details of experiment 62 can be
found in a data report [11].
When aerosol was fed to lower compartment particle mass and number concentrations in the upper
compartment were much smaller than in the lower compartment. Aerosol mass and number concentrations
in the lower compartment decreased fast due to high RH and sedimentation during the steam feed into the
lower compartment. Eventually they reached values that were smaller than in the upper compartment. With
hygroscopic material the average particle diameter increased during the steam feed and after that the
NEA/CSNI/R(2009)5
235
diameter decreased as a function of time because large particles were settling faster. The measured wet size
of CsOH aerosol responded to the increasing RH as was expected.
When the aerosol was fed to the dome part of the upper compartment, the dome was in a saturated
condition at a temperature of about 60 °C. A part of the aerosol particles was carried into the ice
condensers and the lower compartment by a convective flow, which was driven by asymmetrical
TH conditions between the two ICs. The lower part of the upper compartment, that is the volume between
the ICs, remained superheated due to heat transfer through the surrounding structures, and no mixing with
the saturated dome part took place. Thus, a clear difference (factor >3) could be found between the aerosol
concentration decay times in these two parts of the upper compartment.
The results from experiment number 61 were compared with calculated results using FIPLOC and
CONTAIN codes [12, 13]. Both the CONTAIN [14] and FIPLOC [15] calculations of the VICTORIA
experiment gave fairly good overall results on thermal hydraulics. Containment pressurisation as well as
temperatures and humidities in the ICs, the lower compartment and the dome part of the upper
compartment were modelled accurately. The largest deviations from the measurements were found in the
temperature and RH of the lower part of the upper compartment. It was evident that of a strong temperature
and humidity gradient between two inter-connected volumes could not be modelled with
lumped-parameter codes. Inaccuracy in modelling the convective flow pattern in the containment was
another significant source of deviation in aerosol transport and deposition. The study indicated that most of
the straits in containment aerosol modelling can be traced not to the aerosol model package itself, but to its
physical and numerical coupling to the thermal hydraulic calculation, and parameter choices [10].
References
[1] O. Hongisto, K. Lammila, H. Tuomisto Experiments for Hydrogen Distribution in an Ice Condenser
Containment USNRC 20th Water Reactor Safety Information Meeting, October 21-23, 1992,
Bethesda, Maryland, USA
[2] O. Hongisto, H. Tuomisto Experimental Verification of the Loviisa Ice Condenser Containment
Transient Operation in Reactor Accidents American Nuclear Society, Nuclear Reactor Safety
Division’s ”Safety of Thermal Reactors”, International Topical Meeting, July 21-25, 1991, Portland,
Oregon, USA, 1991
[3] P. Lundström, H. Tuomisto T. Lamberg, O. Hongisto Experimental studies of Hydrogen Behaviour
in Ice Condenser Containments In: Proceedings of the OECD/NEA/CSNI Workshop on the
Implementation of Hydrogen Mitigation Techniques. Winnipeg, Manitoba, 1996 May 13-15, pp.
159-179 AECL-11762, NEA/CSNI/R(96)8
[4] V. Saldo, E. Verloo, T. Montanelli, J. Mäkynen, J. Jokiniemi, E.I. Kauppinen, H. Tuomisto,
T. Routamo Aerosol physics in containment In: FISA-97 – EU research on severe accidents,
Mid-term review symposium on shared-cost and concerted actions in reactor safety. Ed: Van
Goethem, G., Keinhorst, G., Martin Bermejo, J. and Zurita, A. EC, Luxembourg, 17 to 19 November
1997, pp. 270-278. EUR 18258 EN
[5] E. Heikkilä Technical description of VICTORIA Facility E.C. Report ST-APC(96)-P07 (1996)
[6] R.E. Hillamo, E.I. Kauppinen On the performance of the Berner low pressure impactor Aerosol Sci.
Technol. 14, 33-47, 1991
NEA/CSNI/R(2009)5
236
[7] J. Keskinen, K. Pietarinen, M. Lehtimäki Electrical low pressure impactor J. Aerosol Sci.23, 353,
1992
[8] J.M. Mäkynen, J.K. Jokiniemi, E.I. Kauppinen, H. Tuomisto,
T. Routamo LWR Containment
Aerosol Experiments at Victoria Facility - Data Report 1/96; E.C. Report ST-APC(96)-P08 (1996)
[9] J.M. Mäkynen, J.K. Jokiniemi, E.I. Kauppinen, H. Tuomisto, T. Routamo LWR Containment
Aerosol Experiments at Victoria Facility – Final Report; E.C. Report ST-APC(98)-P19 (1998)
[10] J.M. Mäkynen, J.K. Jokiniemi, E.I. Kauppinen, A. Silde, S. Outa, T. Routamo, H. Tuomisto
Experimental and Modelling Studies on Containment Aerosol Behaviour in the VICTORIA Facility,
(1998)
[11] J.M. Mäkynen, T. Routamo LWR Containment Aerosol Experiments with the VICTORIA
Facility-Data report Experiment 62 (1999)
[12] G. Weber, S. Schwarz, F. Ewig, K. Fischer FIPLOC 3.1, Benutzerhandbuch Gesellschaft für
Anlagen- und Reaktorsicherheit (GRS) mbH, Januar 1998 GRS-P-2
[13] K.K. Murata et.al.User´s Manual for CONTAIN 1.1, A Computer Code for Severe Nuclear Reactor
Accident Containment Analysis Revised for Revision 1.11. Nov. 1989, Revised July 1990
[14] A. Silde Analyses of three containment accident sequences using the CONTAIN code: Source term
analyses for Loviisa nuclear power plant Research Report ENE4/58/96, VTT Energy, Espoo 1996
[15] S. Outa Modelling of Aerosol Behaviour in the Containment During Severe Reactor Accidents
Master's Thesis, Helsinki University of Technology, January 1998
5.4 Aerosol Release in the Course of MCCI (ACE-C)
As part of the internationally sponsored Advanced Containment Experiments (ACE) program, seven
large-scale experiments on molten core concrete interactions (MCCIs) have been performed at Argonne
National Laboratory. One of the objectives of these experiments is to collect and characterise all the
aerosols released from the MCCIs. Aerosols released from experiments using four types of concrete
(siliceous, limestone/common sand, serpentine, and limestone/limestone) and a range of metal oxidation
for both BWR and PWR reactor core material have been collected and characterised. Release fractions
were determined for UO
2
, Zr, the fission products: BaO, SrO, La
2
O
3
, CeO
2
, MoU
2
, Te, Ru, and control
materials: Ag, In and B
4
C. Release fractions of UO
2
and the fission products other than Te were small in
all tests. However, release of control materials was significant [1].
Results of aerosol release calculations by six groups from six countries were compared with the releases
from ACE MCCI test L6. The codes used for these calculations included: SOLGASMIX-PV,
SOLGASMIX Reactor 1986, CORCON.UW, VANESA 1.01, and CORCON mod2.04/VANESA 1.01.
Calculations were performed with the standard VANESA 1.01 code and with modifications to the
VANESA code such as the inclusion of various zirconium-silica chemical reactors. Comparisons of results
from these calculations were made with test L6 release fractions fro U, Zr, Si, the fission-product elements
Te, Ba, Sr, Ce, La, Mo and control materials Ag, In, and Ru. Reasonable agreement was obtained between
calculations and test L6 results for the volatile elements Ag, In and Te. Calculated releases of the low
volatility fission products ranged from within an order of magnitude to five orders of magnitude of test L6
values. Releases were over and underestimated by calculations. Poorest agreements were obtained for Mo
and Si [2].

NEA/CSNI/R(2009)5
237
References
[1] J.K. Fink, D.H. Thompson, B.W. Spencer, B.R. Sehgal Aerosols released during large-scale integral
MCCI tests in the ACE program Technical Report, January 1992
[2] J.K. Fink, M. Corradini, A. Hidaka, E. Hontanon, M.A. Mignanelli, E. Schrödl, V. Strizhov Results of
aerosol code comparisons with releases from ACE MCCI tests Technical Report, January 1992
5.5 REST, REVENT, ThAI Re-Entrainment Tests
Introduction
Only a few experiments on re-entrainment from boiling sumps have been performed under LWR accident
typical conditions. The most comprehensive work are the REST-tests. In the REVENT-tests especially the
re-entrainment during a controlled filter venting was investigated. Finally two large-scale re-entrainment
tests were carried out in the multi purpose ThAI containment facility.
REST tests
The REST tests (Resuspension Source Term) were carried out at the Kernforschungszentrum Karlsruhe
[1]. The re-entrainment of soluble and insoluble FP surrogates was measured at four different heating
levels. The superficial steam velocity lay both in the bubbly flow as well as in the low churn turbulent flow
regime. The geometric sump surface was 91.6 cm
2
.
In more than 100 separate tests the following
parameters were varied: heating power, concentration of soluble and insoluble materials, condensing and
non-condensing atmospheres above the sump, temperature and pressure.
Fig. 5.5-1 shows the measured re-entrainment of the FP surrogates in REST tests with dry atmospheric
conditions. The given superficial velocity is uncertain because the reported thermal hydraulic data for the
tests are not complete. The re-entrainment of insoluble material (Fe, Zn) is an order of magnitude higher
than for soluble material (CsI) because the insoluble material accumulates at the pool surface and thus in
the droplets. The scatter of the measured values is wider for the insoluble material than for the soluble
material.
REST-Tests: Measured Re-entrainment
Non-condensing atmosphere
1,0E-05
1,0E-04
1,0E-03
1,0E-02
0,00 0,02 0,04 0,06 0,08 0,10
Superficial steam velocity (m/s)
FP surrogate re-entrainment
soluble,
0,1% solution
bubbly flow
churn turbulent flow
insoluble,
0,1% solution
Fig. 5.5-1 Re-entrainment for insoluble and soluble material measured in the REST tests
NEA/CSNI/R(2009)5
238
The relative humidity in the atmosphere had a strong impact on the measured re-entrainment. The
re-entrainment was significantly higher in a dry, non-condensing atmosphere, where the droplets shrank by
evaporation of water and consequently sedimentation decreased. It was also observed in the REST tests
that at the beginning of boiling when there are many small bubbles the re-entrainment can increase
drastically (up to a factor 50) for a short time. Details of the mechanism are still not well understood and
the phenomenon has not been modelled.
In the REST-study at the basis of the measured values an empirical re-entrainment correlation for rough
estimations has been developed. In codes this correlation is not used because important dependencies of
the re-entrainment like the superficial velocity are not considered and the correlation is valid for a limited
gas flow range only.
REVENT tests
In the REVENT tests the re-entrainment of aerosols from boiling pools during a controlled filtered
containment venting was measured [2]. The vessel was a 1:20 linear scaled model of a PWR containment.
The pool was electrically heated (20 kW) and had a heated surface of 0.24 m². The vessel was equipped
with a depressurization system for a controlled pressure relief. In the REVENT facility re-entrainment was
measured under steady state conditions as well as under transient venting conditions. Soluble (Na
2
SO
4
,
CsI, KI) and insoluble (Al
2
O
3
, SiC) fission product simulants were used.
For soluble material the measured re-entrainment is in the same order of magnitude as in the REST tests.
For the insoluble material the re-entrainment was found to be one order of magnitude smaller than for the
soluble one. This result is in contradiction to the REST tests where the re-entrainment for insoluble
substances was always significantly higher than for soluble ones. By the REVENT tests it was further
shown that solid airborne particles are always smaller than 3 µm. In the REVENT test a higher
re-entrainment was measured at steady state conditions than at venting conditions. The reason is a
pronounced volume condensation in the containment during venting, which causes droplet growth and
enhances aerosol settling considerably.
ThAI tests TH14 and TH15
Two tests, TH14 and TH15, in the 60 m³ ThAI containment facility of Becker Technologies, Eschborn,
have been devoted to the re-entrainment of fission products from a boiling sump [3]. The surface of the
boiling sump was 0.55 m². The sump was electrically heated. In order to increase the superficial gas
velocity additionally steam and/or air bubbles were released into the sump via a gas distributing system.
Fission products in the sump water were simulated by soluble CsCl and KI salts.
The superficial gas velocity was varied between 0.03 m/s and 0.12 m/s. The released droplets were dried
in the superheated vessel atmosphere, the residual salt particles being monitored by a Condensation Nuclei
Counter to determine the number concentration, and by a Differential Mobility Analyser to obtain the size
distribution of the salt particles. Additionally, filter samples have been taken to determine the aerosol mass
concentration. The tests performed with a boiling sump surface area of 0.55 m² and 72 kW heating power
yielded re-entrainment factors in the order of 5·10
-5
, re-entrainment being defined as the mass ratio of
released droplets and released steam. The re-entrainment values obtained confirm former REST
laboratory-scale test data of [1]. However, as a result of the more sophisticated aerosol instrumentation
applied in ThAI, the size of the released droplets and of the dried particles respectively turned out to be
significantly smaller. The mass median diameter of the dried particles was about 0.1 µm. The contribution
of re-entrainment to the overall source term should be re-evaluated in the light of the recent and coming
experimental findings.

NEA/CSNI/R(2009)5
239
References
[1] H. Bunz, M. Koyro, B. Propheter, W. Schöck, M. Wagner-Ambs Resuspension of Fission Products
from Sump Water CEC, JRC, EUR 14635 EN (Nov. 1992)
[2] M. Müller et al. REVENT Program – Aerosol Re-entrainment from Boiling Pool During Controlled
Filtered Venting after a Severe Core Melt Accident NEA/CSNI/R(98)4, Session VII (Feb. 2000)
[3] T. Kanzleiter, G. Poss, F. Funke, H.-J. Allelein ThAI Multi-Compartment Containment Test
Program 14
th
International Conference on Nuclear Engineering (ICONE-14) July 17-20, 2006,
Miami, Florida, USA
5.6 Pool Scrubbing Tests
Until mid 90’s, a good number of experimental programmes had addressed the pool scrubbing issue.
Table 5.6-1 and Table 5.6-2 [1] present, respectively, the main variables investigated and major specifics
of the tests conducted.
Table 5.6-1 Pool scrubbing experimental programmes conducted until mid 90’s
Programme Variables investigated
UKAEA [2]
•
Total gas flow
•
Steam mass fraction
GE [3]
•
Aerosol particle size
•
Injector diameter
•
Submergence
EPRI [4-6]
•
Total gas flow
•
Steam mass fraction
•
Submergence
•
Aerosol species
JAERI [7]
•
Total gas flow
•
Particle size
•
Aerosol concentration
•
Submergence
POSEIDON/
POSEIDON II [8-10]
•
Injection system
•
Submergence
•
Water temperature
ACE [11-13]
•
Total gas flow
•
Steam mass fraction
•
Submergence
•
Water temperature
•
Water pH
LACE-España [14]
•
Total gas flow
•
Steam mass fraction
•
Particle size
SPARTA [15]
•
Only one test conducted
CIEMAT (RCA and
GECI) [16]
•
Total gas flow
•
Steam mass fraction
•
Particle size
EPSI [17, 18]
•
Submergence
•
Pressure

NEA/CSNI/R(2009)5
240
Table 5.6-2 Boundary conditions of the pool scrubbing experimental programmes conducted until mid
90’s
Research
project
No.
of tests
We Submergence
(m)
% steam Pool conditions
UKAEA (1966) 7 6 10
6
- 1.8 10
8
0.61 4 - 75 Room
GE (1982) 18 Bubble regime 0.34 - 1.7 0 Room
EPRI (1986-91) 146 10 - 10
4
0.15 - 1.65 0 - 95 Room
near saturation
JAERI (1987) 1.5 10
2
- 2 10
3
1, 2 0 Room
POSEIDON
(1987)
1.5 10
4
1, 2, 3 100 273 ºC
1 - 6 MPa
ACE (1992) 4 5 10
4
- 1.5 10
5
1.4 - 4.6 1 - 40 25 - 80 ºC
LACE España
(1992)
11 5 10
3
- 1.5 10
5
2.5 10 - 90 110 ºC
3 bar
SPARTA (1992) 1 2 10
4
1.8 0 near saturation
CIEMAT (1996)
(RCA and GECI)
10 2.5 10
4
- 2.8 10
5
0.25 - 2.5 0, 50, 90 80 ºC
near saturation
POSEIDÓN-II
(1998)
17 0.3 – 4.00 0, 0.55,0.72 85 ºC
A good part of the experimental investigation were encapsulated in computer codes such as
SPARC90 [19], BUSCA [20] and SUPRA [21] which were principally developed in the 80’s. They contain
models based on the basic knowledge gained on pool scrubbing phenomena (as summarised in the
supplementary report on nuclear aerosols in reactor safety issued by NEA [22]) from the experimental
programmes carried out until late 80’s. Some limited model updates were done using the data made
available later. Nonetheless, no further major development were made from early 90’s although more
detailed information were made available by the tests carried out throughout the last decade of the XX
century.
Major analytical activities associated with the recent pool scrubbing research can be summarised as:
•
The Source Term project of the 3
rd
FWP of Euratom [23]: a model for fission product scrubbing
under churn turbulent flow was developed. In addition, a peer review of last versions of SPARC and
BUSCA codes were assessed.
•
Simplified models for scrubbing of particles during Molten Core Concrete Interaction (MCCI) with
overlying water pool [24] and for BWR suppression pools [25]. Both of them were used to develop a
simplified model of decontamination accounting for the uncertainties associated with both scenarios.
NEA/CSNI/R(2009)5
241
References
[1] M.J. Escudero, M.J. Marcos Crespo, M. Swiderska-Kowalczyk, M. Martin Espigares, J. López
Jiménez State of the Art Review on Fission Products Aerosol Pool Scrubbing under Severe Accident
Conditions ST(93)-P61, Rev. 2, ITN/TS-22/DP-93, 1994
[2] J.J. Hillary, J.C. Taylor, F. Abbey, H.R. Diffey Iodine removal by a scale model of the SGHW
reactor vented steam suppression system UKAEA, TRG Report 1256 (W), August 1966
[3] S.A. Ramsdale, G.J. Barford, S. Fishwick, H.C. Starkie Status of research and modelling of water
pool scrubbing Final report, EUR 14566 EN, 1992
[4] J.C. Cunnane, M.R. Kuhlmann, R.N. Oehlberg The scrubbing of fission product aerosols in LWR
water pools under severe accident conditions - experimental results Proc. of Fission Product
Behaviour and Source Term Research, 1984
[5] D.D. Paul, L.J. Flanigan, J.C. Cunnane, R.A. Cudnik, R.P. Collier, R.N. Oehlberg Radionuclide
scrubbing in water pools - gas-liquid hydrodynamics EPRI-NP-41554, Vol. 1, 1985
[6] M.R. Kuhlmann, J.A. Gieseke, M. Merilo, R.N. Oehlberg Scrubbing of fission product aerosols in
LWR water pools under severe accident conditions IAEA-SM-281/47
[7] K. Hashimoto, K. Soda, S. Uno, H. Nakatani, H. Tateoka Effect of pool scrubbing of insoluble
aerosol in two-phase flow in a pipe IAEA-SM-296/60
[8] S. Güntay Experiment POSEIDON: Elemental iodine retention in water pools ANS 1990 Winter
Meeting, Washington D.C., November 11-15, 1990, Volume 62, TANSAO 062 1-722 (1990), ISSN:
0003-018X
[9] S. Güntay Experiment POSEIDON: Pool scrubbing effect on iodine decontamination pp 937-941,
ENC'90, ENS/ANS-Foratom Conference Transactions, Verlag TÜV Rheinland
[10] A. Dehbi, D. Suckow, S. Güntay Aerosol retention in low-subcooling pools under realistic accident
conditions Nuclear Engineering and Design 203, 2-3, 229-241, 2001
[11] J.D. McCormack, D.R. Dickinson, R.T. Allemann Experimental results of ACE vent filtration pool
scrubber tests AA1-AA4 and DOP1 - DOP5 ACE-TR-A1, January 1989
[12] K. Fischer, M.R. Kuhlmann, V. Kogan Fission product pool scrubbing data and modelling
assessment ACEX TR-A-01, Vol. 1, December 1996
[13] K. Fischer, M.R. Kuhlmann, V. Kogan Fission product pool scrubbing data and modelling
assessment ACEX TR-A-02, Vol. 2, June 1997
[14] M.J. Marcos, F.J. Gomez, I. Melches, M. Martin, J. López LACE-España Experimental programme
on the retention of aerosols in sugmerged beds Final report, CIEMAT, ITN/TS-08/DP-93, April
1993
[15] M. Furrer, R. Passalaqua SPARTA project: scoping test results and comparison with pool scrubbing
codes predictions ENEA-CRE Casaccia, January 1992

NEA/CSNI/R(2009)5
242
[16] V. Peyrés, M.M. Espigares, J. Polo, M.J. Escudero, L.E. Herranz, J. López Jiménez Pool scrubbing
and hydrodynamic experiments on jet injection regime CIEMAT 785
[17] K. Hashimoto, K. Soda, S. Uno High pressure pool scrubbing experiment for a PWR severe accident
ANS International Topical Meeting on Safety of Thermal Reactors, July 1991
[18] K. Hashimoto, K. Soda, S. Uno, H. Nakatani, H. Tateoka Effect of pool scrubbing of insolubile
aerosol in two-phase flow in a pipe IAEA-SM-296/60
[19] P.C. Owczarski, K.W. Burk SPARC-90: A Code for Calculating Fission Product Capture in
Suppression Pools NUREG/CR-5765, 1991
[20] S.A. Ramsdale BUSCA-JUN90 Reference Manual, SRD-R542, 1991
[21] A.T. Wassel, A.F. Mills, D.C. Bugby Analysis of Radionuclide Retention in Water Pools Nucl. Eng.
& Des. 90, 87-104, 1985
[22] NEA, Nuclear Aerosols in Reactor Safety: Supplementary Report, 1985
[23] J. López Jiménez, L.E. Herranz, M.J. Escudero, M.M. Espigares, V. Peyrés, J. Polo, Ch. Kortz, M.K.
Koch, U. Brockmeier, H. Unger, L.M.C. Dutton, Ch. Smedley, W. Trow, A.V. Jones, E. Bonanni,
M. Calvo, A. Alonso Pool Scrubbing. ST(95)-P195, ITN/TS-12/SP-95, 1995
[24] D.A. Powers, J.L. Sprung A Simplified Model of Aerosol Scrubbing by a Water Pool Overlying
Core Debris Interacting with Concrete NUREG/CR-5901, SAND92-1422, 1993
[25] D.A. Powers A Simplified Model of Decontamination by BWR Steam Suppression Pool
NUREG/CR-6153, 1997
5.7 Resuspension Tests
The experiments performed on the topic of resuspension of aerosols are divided into two classes. The first
class analyses the resuspension under a continuous airflow of at least several minutes. Such conditions are
expected in the primary cooling system or at a slow depressurisation of the containment in the course of an
accident scenario. The second class examines the influence of transient airflows after short time events like
hydrogen deflagrations or steam explosions.
5.7.1 Continuous flow experiments
PARESS
In the PARESS (Particle Resuspension Studies) experiments Fromentin [1] analyses the resuspension
under a continuous airflow in a wind channel. In a first step aerosol is injected into a sedimentation
chamber, where the aerosol settles under predefined conditions onto deposition coupons. In a second step
the deposition coupons are recovered and put into the wind channel. There a constant air current velocity is
adjusted and the removal of aerosol mass is measured in dependence of time. Different aerosol materials
are used in this study like iron oxide (Fe
2
O
3
), tin (Sn), and silicon (Si) or mixtures of these materials. A
resuspension flux
F
res
is observed that decreases inversely proportional to time. Furthermore other
influences like aging of the deposition layer, relative humidity and homogeneity of the deposition are
investigated.

NEA/CSNI/R(2009)5
243
STORM
The experimental conditions of the STORM facility at JRC are chosen to simulate the conditions in the
pressure relief lines of a PWR reactor in a station blackout scenario (de los Reyes [2]). The test section
consists of a 5.0055 m long pipe with an internal diameter of 63 mm. The test SR11 is chosen as ISP40 and
is performed in two phases. In the first phase the pipe is streamed by tin oxide (SnO
2
) aerosol with a carrier
gas of nitrogen and steam. During this period of 5 h a part of the aerosol is sedimented on the internal pipe
walls. In the second phase the pipe is fed with pure nitrogen. During this phase the prior sedimented
aerosol is resuspended and relocated inside the pipe or released with the carrier gas. The gas flow is
increased in six consecutive steps and the resuspension rate is determined by the aerosol concentration in
the carrier gas. A benchmark with different severe accident codes modelling resuspension has been
performed on ISP40. Further details of the STORM experiments can be found in chapter 5.2.3.
5.7.2 Transient flow experiments
VANAM-M4 add-on
Subsequent to the Vanam-M4 test in the Battelle Model Containment (BMC) an add-on experiment with
resuspension due to a hydrogen deflagration in a multi-compartment geometry is performed (Kanzleiter
[3]). In a first step hygroscopic NaOH aerosol and insoluble SnO
2
aerosol is injected into the inner
compartments of the BMC. The outer rooms are separated from the inner rooms by rupture foils. In a
second step hydrogen is injected into the same compartments as the aerosol. The hydrogen is ignited in the
inner rooms and the expanding atmosphere spreads out into the outer containment rooms. Although the
deflagration runs very mild, the generated air currents are able to resuspend round about 1 % of the initially
injected aerosol mass. It is observed that the resuspended aerosol material settles faster than the initially
injected aerosol. This indicates the generation of a larger aerosol component. The observation of the
particles found in filter stations with a scanning electron microscope show a wide particle spectrum with a
large number of very fine particles but also some very large particles, which carry a great fraction of the
aerosol mass.
AEREST
At technical university of Munich an experimental programme in the aerosol resuspension shock tube has
been performed (Schneider [4]). The aerosol test section is located in a 7 m long pipe with a pressure tank
on the input side. This pressure tank is discharged over a ball valve and the expanding atmosphere hits an
aerosol deposition bed that is deposited on coupons with different angles of attack, which are prepared in
an extra sedimentation vessel. The aerosol materials used in these experiments are silver particles of
different shapes and tin oxide (TiO
2
) particles. In these experiments a large scattering of the resuspended
aerosol mass is observed under comparable conditions. Anyway the AEREST experiments show a large
relative particle removal at high aerosol mass loads on the surface but only a minor relative particle
removal at lower particle mass loads. This can be explained by a larger adhesive force of particles located
directly on the surface in comparison to particles in higher positions of the particle bed.
ThAI experiments Aer-1, Aer-3, Aer-4
In the ThAI facility at Becker Technology three experiments on the topic of resuspension have been
performed (Kanzleiter [5]). For that purpose a horizontal deflagration tube has been installed into the
facility that was loaded with a hydrogen-air mixture. In a first phase CsI is injected into the atmosphere and
settles during a period of 18 h. Then the hydrogen in the deflagration tube is ignited and the expanding
atmosphere is released through a 2 * 50 cm² large nozzle over a deposition plate, on which aerosol material
has deposited during the sedimentation phase. In the three experiments Aer-1, Aer-3, and Aer-4 the
NEA/CSNI/R(2009)5
244
hydrogen load and thus the airflow velocities are varied. The findings are similar to that of the
VANAM-M4 test with a resuspended fraction of 1 % of the initially injected aerosol mass. Also in
accordance with VANAM-M4 is the higher settling velocity of the resuspended aerosol in comparison with
the deposition phase.
References
[1] A. Fromentin Particle Resuspension from a Multi–Layer Deposit by Turbulent Flow Paul Scherrer
Institut, 1989 (PSI 38)
[2] A. de los Reyes, J.A. Capitão, G.D. Santi International Stanard Problem 40 - Aerosol Deposition and
Resuspension OECD, 1999 (NEA/CSNI/R(99)4)
[3] T. Kanzleiter VANAM-Mehrraum-Aerosolabbau-Versuch M4 mit Mischaerosol (lösliches und
unlösliches Material) und Resuspension durch einen Wasserstoffbrand Battelle–Institut e.V., 1993
(BIeV-R67.098-305)
[4] R. Schneider Resuspension von Aerosolen durch transiente Strömungen im Containment Lehrstuhl
für Thermodynamik, TU München, 2003 (150 1102)
[5] T. Kanzleiter, G. Ahrens, K. Fischer, W. Häfner, A. Kühnel, G. Poss, F. Funke, G. Langrock, H.-J.
Allelein, G. Weber, S. Schwarz Versuchsanlage und Programm zur Untersuchung offener Fragen
zum Spaltproduktverhalten im Sicherheitsbehälter; ThAI Phase II Becker Technologies, Areva NP
und GRS, 2006 ( 150 1272 – S1)
5.8 Spray Systems (French Tests)
For model development and validation purposes concerning the effects of sprays in the containment
atmosphere, the Institut de Radioprotection et de Sûreté Nucléaire (IRSN) conducted two experimental
programmes; CARAIDAS (an extensive analytical programme) and TOSQAN (comprising
small-to-intermediate-scale tests that are still in progress). The Commissariat à l’Energie Atomique (CEA)
is carrying out some tests in the MISTRA facility where these are large-scale and complementary to those
of IRSN but in which it is not foreseen to include injection of aerosols.
The CARAIDAS programme comprised analytical tests covering three effects of sprays: droplet relaxation
(condensation and evaporation); aerosol capture; and iodine absorption, [1, 2]. The CARAIDAS apparatus
(see Fig. 5.8-1) involved a vessel of dimensions: height of 5.7 m; internal radius of 0.6 m; total volume of
nearly 1.4 m
3
. Single drops were generated that fell through a homogeneous air atmosphere with different
humidity levels and with or without cesium-iodide aerosols or iodine vapor, respectively. The atmospheric
temperature was controlled by the regulated wall temperature. Nearly 100 tests were performed showing
the collection efficiency to range over more than two decades and allowing development of modelling for
the ASTEC code covering droplet kinetic and thermal relaxation, gravitational coagulation, inertial capture
and interception of aerosols, and iodine mass transfer and chemical transformation in the droplets, [3]. In
particular, twenty-one of these tests were retained for evaluation of aerosol-capture modelling where the
polydisperse (GSD ≤ 1.7; 0.5 < AMMD < 5 microns) CsI aerosol interacted with pure-water droplets (see
Fig. 5.10-1). These aerosol-capture tests can in fact be grouped into five families: two analytical series
using particles with an aerodynamic volume-median diameter (AVMD) of 2-4 µm and either large
(700 µm diameter) or small (300 µm diameter) spray droplets; another two analytical series using smaller
particles (AVMD between 1 and 1.5 µm) with the same large and small droplets; and a fifth series in more
severe-accident representative conditions, i.e., higher pressure (0.2 - 0.4 MPa) and higher temperature
(120 to 140 °C). Unfortunately, this latter series was affected by large experimental uncertainties (with
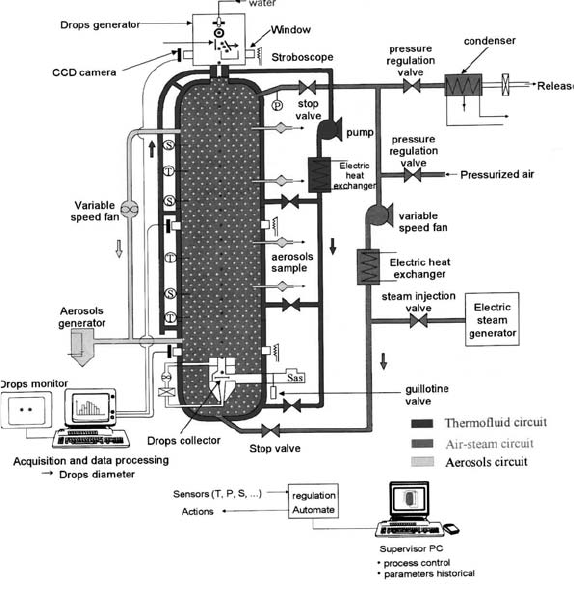
NEA/CSNI/R(2009)5
245
consequent dispersion of results) arising mainly from unexplained difficulties with respect to droplet
collection at the containment base.
Fig. 5.8-1 Comparison of the ASTEC aerosol-capture model with the CARAIDAS data - after [1]
The TOSQAN experiments are performed in thermal-hydraulic conditions representative of containment
severe-accident scenarios (wall condensation, spray, sump). The principal aim has been the measurement
of steam condensation onto (or water evaporation from) spray droplets in atmospheres comprising steam
and non-condensable gases while, recently, a new phase including aerosols has started. The TOSQAN
facility is based on a vessel 7 m
3
in volume (4.8 m high, 1.5 m wide) with thermostatically-controlled walls
which is highly instrumented (gas temperature, steam concentration, droplet velocity, diameter and
temperature), [4]. The main thermal-hydraulic phenomena when sprays are used the mixing induced by
spray entrainment and the heat and mass transfer with respect to droplets and walls where validation of the
modelling of these processes constitutes the main objective of the programme, [5, 6]. The TOSQAN spray
test matrix consists of one reference test with an air-steam mixture and another with an air-steam-helium
mixture. Other tests were changed the spray injection rate, the spray temperature, the superheating, the
initial gas temperature, the difference between saturation temperature and injection temperature, and the
gas composition. A benchmark was initiated between SARNET partners based on TOSQAN Test 101
studying droplet and wall heat and mass transfer, [7]. In this test, a cold-water spray was injected into the
steam-air-filled vessel resulting in partial steam condensation and pressure reduction. This exercise
involved both lumped-parameter and computational fluid dynamics (CFD) codes with a first phase that
was a blind analysis and a second one (in 2005) using open results. It was seen that the calculated total
pressure was very sensitive to the modelling of droplet vaporization into the gas or onto structures.
Modelling of the spray injection required care and use of experimental data was necessary. A third phase
with open results is in progress that includes new experimental data on spray injection. In general,
calculated pressure is found to be lower than in the experiments where a possible explanation is the

NEA/CSNI/R(2009)5
246
droplet-wall interaction which is not taken into account in the calculations. A second TOSQAN spray
benchmark is being performed based on Test 113 which concerned mixing by sprays of an
initially-stratified air-helium atmosphere.
Fig. 5.8-2 Comparison of the ASTEC aerosol-capture model with the CARAIDAS data - after [3].
Tests designed for the validation of CFD codes were performed by CEA in the MISTRA facility, a much
larger-scale experiment (vessel volume of 100 m
3
) than TOSQAN, [8, 9]. The experiments study
axisymmetric and non-axisymmetric injection of steam into the containment with condensation on
temperature-regulated walls investigating heat and mass (steam condensation) transfer rates as well as
hydrogen distribution. Standard models for condensation used in lumped-parameter codes and multi-
dimensional codes have been validated. Some results of these tests are available to the SARNET
community with respect to tests M2 and M3, [10].
Finally, it is worth mentioning that many TOSQAN, MISTRA as well as ThAI results were used in
ISP-47 [11]. This ISP assessed lumped-parameter and CFD codes with respect to containment thermal
hydraulics involving analyses that comprised progressive modelling difficulties. The exercise highlighted
the dominant impact of user effects, especially concerning nodalization, both with lumped-parameter and
CFD codes. Furthermore, in spite of their higher numerical burden, CFD results were not generally better
than those of lumped-parameter codes. Nevertheless, for assessing hydrogen distribution in the
containment, combined use of both lumped-parameter and CFD codes was recommended it was concluded
that further code development and establishment of nodalization rules and user guidelines are necessary to
achieve more accurate predictive capabilities.
NEA/CSNI/R(2009)5
247
References
[1] D. Ducret, Y. Billarand, D. Roblot, J. Vendel Study on collection efficiency of fission products by
spray: experimental device and modelling 24
th
DOE/NRC Nuclear Air Cleaning and Treatment
Conference, Portland, USA, 15-18 July 1996, NUREG/CP-0153.2, 1996
[2] D. Ducret et al. Etude expérimentale et modélisation du rabattement des aérosols par des systèmes
d’aspersion 14e Congrès Français sur les Aérosols, Dec. 1998, Paris, France, 1998
[3] W. Plumecocq, V.D. Layly, A. Bentaib Modelling of the containment mitigation measures in the
ASTEC code, focusing on spray and hydrogen recombiners International Topical Meeting on
Nuclear Thermal-Hydraulics (NURETH-11), 3-6 October 2005, Avignon, France, 2005
[4] P. Lemaitre, E. Porcheron, G. Grehan, L. Bouilloux Development of a global rainbow refractometry
technique to measure the temperature of spray droplets in a large containment vessel Meas. Sci.
Technol. 17, pp 1299-1306, 2006
[5] J. Malet, E. Porcheron, J. Vendel Filmwise condensation applied to containment studies: conclusions
of the TOSQAN air-steam condensation tests International Topical Meeting on Nuclear Reactor
Thermal-Hydraulics (NURETH-11), 3-6 October 2005, Avignon, France, 2005
[6] J. Malet, W. Plumecocq, P. Lemaitre, E. Porcheron, J. Vendel Modelling of sprays in containment
applications: results of the TOSQAN spray tests International Congress on Advances in Nuclear
Power Plants (ICAPP), 4-8 June 2006, Reno, NV, USA, 2006
[7] A. Bentaïb, J. Malet, P. Lemaitre, E. Porcheron, J. Vendel, W. Plumecocq Modelling of sprays in
containment applications; Results of the TOSQAN spray benchmark European Review Meeting on
Severe Accident Research (ERMSAR), 14-16 November 2005, Aix-en-Provence, France, 2005
[8] M. Caron-Charles, J.J. Quillico, J. Brinster Steam condensation experiments by the MISTRA facility
for field containment code validation Proceedings of the International Conference on Nuclear
Engineering (ICONE), Volume 3, pp 1041-1055, 2002
[9] I. Tkatschenko, E. Studer, J.P. Magnaud, L. Blumenfeld, H. Simon, H. Paillère Status of the
MISTRA programme for the validation of containment thermal-hydraulic codes International
Topical Meeting on Nuclear Thermal-Hydraulics (NURETH-11), 3-6 October 2005, Avignon,
France, 2005
[10] A. Bentaïb, J. Vendel, H. Simon, L. Blumenfeld, I. Tkatschenko, H. Paillère Air-steam tests in the
MISTRA facility: Experimental results and validation of the lumped-parameter/CFD TONUS code
European Review Meeting on Severe Accident Research (ERMSAR), 14-16 November 2005,
Aix-en-Provence, France, 2005
[11] H.-J. Allelein, K. Fischer, J. Vendel, J. Malet, E. Studer, S. Schwarz, M. Houkema, H. Paillère, A.
Bentaib International Standard Problem ISP-47 on containment thermal hydraulics - final report.
OECD/NEA (to appear), 2006
5.9 Containment Venting Filters
Severity of the conditions during severe accidents varies depending on the successfulness of the accident
management measures attempted. However, anticipated conditions: high temperature, high pressure, high
steam concentrations, hydrogen burns or detonations, high aerosol and gaseous fission product
NEA/CSNI/R(2009)5
248
concentration, and resulting high activity levels, are very much depending on the accident progression
driven by the status of the hardware as well as the accident management efforts. Contrary to the
operational or design basis accident conditions the anticipated severe accident conditions cannot be used as
the design parameters for the conventional filtration systems within the practical limitations. However, as a
result of the emerging new regulatory requirements for the severe accidents, which can not be ‘normally’
fulfilled by the conventional filtration systems new filtration concepts were developed in 1980s to backfit
the current operating reactors in some countries. The main emphasis in the new regulatory requirements is
to keep the pressure in the containment under the design limits in order to avoid catastrophic containment
failures by relieving the pressure by venting through a containment venting filter, which should at the same
time remove the aerosol particles and molecular gaseous iodine with certain efficiencies.
Some of the new developed systems by various vendors at that time were tested by an international project,
Advanced Containment Experiments (ACE) Phase A [14], 1988-1992. The following section summarises
the filter concepts and the results achieved from the ACE experiments. Another containment venting filter
unit developed and tested in Switzerland is also introduced.
5.9.1 International efforts for qualification of containment venting rilters
Phase A of the ACE project was comprised of two parts; the first part consists of four pool-scrubbing tests
and accompanying five mono-dispersed aerosol tests. The objectives of these tests were to provide a basic
database for the retention capability of the water pool before conducting the tests with various commercial
containment venting filters in the second part. The filters were designed and developed by various
international organizations as shown below:
−
the submerged gravel scrubber from Westinghouse/USA,
−
the Multi Venturi Scrubber System from ABB/Sweden,
−
heat sink gravel bed from ABB Atom, Sweden,
−
the sand bed filter from CEA and EdF, France,
−
the submerged combined venturi filter from FRAMATOME ANP (former Siemens-KWU/Germany),
−
the metal-fibre filter developed by FZK (former KfK)/ Germany
−
the Soviet filter system provided by the former Soviet Union.
The filter units used in the test programme were scaled units, and the boundary conditions used were
selected to demonstrate the filter efficiencies at the desired conditions. Surrogate aerosol particles,
composed of CsOH, CsI and MnO, were generated using evaporation of the manganese powder by a
plasma torch, evaporation of cesium with an oven and by condensation of metallic vapors in steam
environment, in which hydrogen iodide (HI) was also introduced. Simultaneous chemical reactions of
vaporised Mn and Cs with steam and later CsOH with HI caused the production of the desired chemical
speciation. The particles generated were about 2.5 µm AMMD with geometric standard deviation of about
2. The aerosol concentration ranged from 5 to 15 g/m
3
(at standard conditions) depending on the test
conducted.

NEA/CSNI/R(2009)5
249
Submerged gravel scrubber
A submerged gravel bed filter was a system developed by Westinghouse, USA. The filter contained a
gravel bed, which was submerged in water. The gas as flowed up through the gravel bed. The water served
as a sink for both the heat and aerosol removed from the gas. A schematic diagram of the filter system used
is depicted in Fig. 5.9-1. Tests were conducted to investigate the effect of bed depth below the pool
surface, pool temperature and inlet steam fraction Table 5.9-1 presents the boundary conditions and
measured average material dependent decontamination factors.
Fig. 5.9-1 Schematic Diagram of Submerged Gravel Bed Scrubber
FILTRA-MVSS
The FILTRA-MVSS (Filtered Containment Venting Multi Venturi Scrubber System) was a wet scrubber
for filtered containment venting system designed and manufactured in Sweden by ABB Atom and Fläkt
Industry AB. The filter contains a bank of venturis, which is located in a water pool. A schematic diagram
of the filter system used is depicted in Fig. 5.9-2. A moisture separator, which contains a dry gravel bed, is
attached at the exit of filter unit to reduce the content of the water droplets in the gas mixture from the
venturi scrubber before the gas was discharged to the environment.

NEA/CSNI/R(2009)5
250
Fig. 5.9-2 FILTRA - schematic drawing
The multiple venturi part of the filter unit (without the moisture separator) was tested in the ACE-Project.
Tests conducted provided aerosol removal characteristics as a function of changing the steam mass fraction
in the aerosol carrier gas and also determined the level of re-entrainment of liquid from the filter test vessel
pool.

NEA/CSNI/R(2009)5
251
Table 5.9-1 ACE project: measured key parameters and the retention factors based on the inlet and
outlet concentrations

NEA/CSNI/R(2009)5
252
FILTRA
The FILTRA filter developed in Sweden utilised a gravel bed. The FILTRA system was installed in two
boiling-water reactors at Barseback Nuclear Power Stations in southern Sweden. The gravel bed is
designed to provide a static heat sink for condensing steam and also to serve as an expansion volume and a
filter medium for removing radioactive aerosols. A schematic diagram of the filter system used is depicted
in Fig. 5.9-3. The tests conducted used a similar bed, but smaller in capacity and in depth then the real
FILTRA unit, provided data (Table 5.9-1) on the aerosol removal characteristics as well as the temperature
and entertainment (carry-over) behaviour from the unit during passage of moist gas.
Fig. 5.9-3 FILTRA - MVSS schematic drawing
Sand bed filter
A dry sand bed filter was designed and developed by CEA and EdF in France for filtered vented
containments for use at EdF’s pressurised water reactors. The filter system tested at the ACE-Project used
a 0.8 m deep bed of 0.6 mm grain sand and a layer of 1.5 mm gravel supporting the sand. The tests
provided data (Table 5.9-1) during both condensing and non-condensing bed conditions as well as
re-entrainment and temperature behaviour of the sand bed. A schematic diagram of the filter system used is
depicted in Fig. 5.9-4

NEA/CSNI/R(2009)5
253
Fig. 5.9-4 Schematic layout of french sand filter
Combined venturi metal-fibre filter
A combined venturi metal-fibre filter unit, containing a venturi scrubber and a metal-fibre filter demister,
which was developed by FRAMATOME ANP (former Siemens-KWU), was tested. The aerosol-laden gas
flowed upward through a venturi tube and was scrubbed by water from surrounding pool, which was drawn
in at the throat of the venturi and mixed with the gas. The metal fibre demister, mounted at the top of the
unit, served the final filtering of the outlet gas. A schematic diagram of the filter system used is depicted in
Fig. 5.9-5. Table 5.9-1 presents the boundary conditions as well as the decontamination factors measured.

NEA/CSNI/R(2009)5
254
Fig. 5.9-5 Schematic diagram of combined venturi scrubber
Metal Fibre Filter
A metal fibre filter was developed by FZK (former KfK) in Germany as a possible device to remove
radioactive aerosols during venting. The gas flowed horizontally through pads of stainless steel fibres of
progressively smaller size. A schematic diagram of the filter system used is depicted in Fig. 5.9-6 The
conducted (Table 3.4-2) demonstrated the filter efficiency at two inlet steam fractions.
Russian Filter
The filter system, developed by the former Soviet Union and tested at the ACE-Project, was consisted of
two units in series. The first unit was a jet scrubber and a droplet separator above the pool to remove
entrained liquid. The second unit was a dry-packed filter containing beats of an adsorbent material to
remove molecular and organic species of iodine. Fig. 5.9-6 presents a schematic diagram of the filter
system. The tests provided (Table 5.9-1) the aerosol removal characteristic, decontamination factor and
pressure drop.

NEA/CSNI/R(2009)5
255
Fig. 5.9-6 Schematic diagram of metal fibre filter
5.9.2 CCI containment venting filter
CCI (former Sulzer Thermtec) in Switzerland designed and developed a wet filter system [15], composed
of a specially designed orifice unit, creating small bubbles, which flow in a riser where the pool scrubbing
removes the aerosol particles and gaseous species. The riser causes water and bubble circulation for an
enhanced mass transfer. Upper section of the filter, containing CCI specific filter elements, removes the
droplets as well as remaining aerosol particles. A schematic diagram of the filter system used is depicted in
Fig. 5.9-8 Table 5.9-2 shows the results of a qualification program conducted at PSI [15]. A further
qualification program on the retention efficiencies for molecular iodine and organic iodide at anticipated
accident conditions was conducted in 1999 -2002 at PSI.

NEA/CSNI/R(2009)5
256
Fig. 5.9-7 Schematic diagram of jet scrubber and packed filter of the Russian filter

NEA/CSNI/R(2009)5
257
Fig. 5.9-8 Schematic diagram of CCI (former Sulzer Thermtec) containment venting filter

NEA/CSNI/R(2009)5
258
Table 5.9-2 Test conditions and measured decontamination factors (DF) for the CCI containment filter
system
Configuration of the
Filter System
‘Low Pressure’
for PWR applications
‘High Pressure’
for BWR applications
Pressure at the inlet 3 bar 1.6 bar 5 bar
Aerosol concentration (g/m
3
) ~0.2 6.4 to 15.4 1.9 to ~2.1
AMMD at the inlet (µm) 0.65 1.8 1.1
Decontamination Factor
≥ 48690
> 46300
≥ 195000
5.9.3 Removal of iodine by the containment venting filters
Gaseous iodine is scrubbed by wet scrubbers (ABBs FILTA-MVSS, Framatome ANP’s combined venturi
metal-fibre and CCI’s filters), however, conditioning the filter water by use of chemicals to keep pH at a
high value as well as to decompose molecular iodine or organic iodide is generally accepted procedures.
No special engineering attempts were taken in the design of the gravel bed or sand bed filters, however,
natural deposition processes in combination with steam condensation, which might be temporary in nature,
might remove molecular iodine. The Russian system not only removes iodine by scrubbing in the filter
water pool but the main removal is achieved by the dedicated iodine adsorber unit.
5.9.4 International status of use of containment venting filters
The practice of controlling pressure during a postulated severe accident in a containment of the operational
nuclear power plants varies country to country due to the differences in the national regulatory practices.
Therefore, the use of filters during containment venting is very plant and country specific. Most of the
nuclear power plants in European countries are equipped with containment venting filters. The venting
strategy is also plant and country specific. The FRAMATOME ANP’s combined venturi metal-fibre filter
design, ABB's multiple venturi and FILTRA systems, French sand bed and Swiss CCI filter are the ones
currently installed in most of the units in the west, central and northern European countries.
5.10 Ongoing Tests
5.10.1 Aerosol behaviour in steam generators
5.10.1.1 Studies of vertical steam generator in the ARTIST facility
The integral tests of vertical SGs have been conducted in a representative scaled-down model of the
Beznau PWR (Switzerland) SG called ARTIST facility [1]. The facility is erected and operated by PSI.
The main components of the model steam generator are a bundle, a shroud, a flooding system, a full size
steam separator and dryer. The bundle is consisted of 270 straight tubes, 130 bends, one break tube and
two support plates. The original tube size and configuration, the distance between the tube sheet and the
support plates are maintained. The bundle is attached to tube sheet. The facility is equipped with many
aerosol-sampling stations. Only the bundle section of ARTIST was used in the EU-SGTR project [1] (Fig.
5.10-1). Five tests comprised the experiments performed for this project. The first three tests dealt with the
aerosol retention in the break stage under dry and wet conditions. The other two tests addressed accident
management (AM) issues whereby the SG bundle goes from a fully dry state to a fully flooded state. An
axis-symmetric guillotine break was used and located 300 mm above the tube sheet in the middle of the
bundle. The aerosol AMMD’s at the inlet were in the 2.25-3.70 µm range, while at the outlet, the
AMMD’s were in the 0.49-0.84 µm range.

NEA/CSNI/R(2009)5
259
When the bundle is dry, and the full break flow directed into the bundle, aerosol deposition takes place all
over the bundle. There is strong evidence that the aerosols disintegrate into smaller particles because of the
sonic conditions at the break. This obviously promotes particle escape from the secondary and lowers the
overall DF. Further investigation needs to be performed to determine the influence of the type of aerosol.
For the far-field conditions, under a flooded bundle and in the presence of steam, the DF is between 482 to
1081. A large fraction of the aerosols is scrubbed at the break level because of strong impaction of the
incoming jet on the water interface and fast steam condensation. The additional water head beyond the
break stage has only a secondary influence on the magnitude of decontamination. When no steam is
present, the DF increases exponentially from 124 to 5739 when the water height in the bundle increases
from 1.30 m to 3.6 m. The aerosol removal rate is roughly constant with height, and hence the DF is solely
a function of residence time in the water pool (water height). When steam is present in the carrier gas
under flooded secondary, condensation inside the tube causes aerosol deposition and produces blockages
near the break, with a subsequent primary pressure rise. This has implications for real plant conditions, as
aerosol deposits inside the broken tube will cause more flow to be diverted to the intact tubes, with a
corresponding reduction in the source term to the secondary.
Fig. 5.10-1: Schematic and photo of the ARTIST bundle test section
The International cost share project ARTIST (2003 - 2007) addresses the specific issues associated with
the aerosol behaviour in seven distinct phases:
1.
Phase I: Aerosol retention in SG tubes under dry conditions. In this phase, in-tube aerosol
deposition/resuspension is studied under high velocity conditions (up to 300 m/s). Tube length, bend
curvature, and aerosol type, size and concentration are varied.
Far -
Far-field
stages
stage s
Break
stage
Bend section
Tube sheet
Gap filled wit
h
straight tubes
Support
Support
plates
Flooding
water inlet
NEA/CSNI/R(2009)5
260
2.
Phase II: Aerosol retention in the break vicinity under dry conditions. Aerosol
deposition/resuspension at very high velocities is addressed. The break gas flow rate and break type
(fish-mouth, double guillotine, vertical) are varied.
3.
Phase III: Aerosol retention in the bundle far from the break, under dry conditions. Aerosol
deposition due to thermophoresis and impaction is studied at relatively small velocities (less than 1
m/s) because the flow has evened out across the secondary side flow area. The gas flow rate and the
gas-structures temperature differential are varied.
4.
Phase IV: Aerosol retention in the separator and dryer under dry conditions. This phase studies
aerosol impaction and interception due to complex 3D flows in the upper components of the SG.
The gas flow rate and the gas-structures temperature difference will be varied.
5.
Phase V: Aerosol retention in the bundle section under flooded pool conditions. This phase
investigates condensation-induced aerosol scrubbing by the SG water pool as well as inertial
impaction upon the structures. The break flow rate, pool submergence, carrier gas steam content and
pool subcooling are varied.
6.
Phase VI: Droplet retention in separator and dryer sections under dry conditions. This phase deals
with Design Basis Accident (DBA)-type phenomena i.e. the potential for “primary bypass”, whereby
a break at the top of the tube bundle sprays fine primary liquid droplets that might find their way to
the environment through, for example, a stuck-open safety valve. Carrier gas flow rates and droplet
sizes are varied to match prototypical Stokes numbers.
7.
Phase VII: Integral tests. The seventh set of experiments is integral in nature and is focused on
aerosol retention in the whole model SG. The conditions of the tests will be determined based on
insight gained from the results of the previous phases.
ARTIST project has further demonstrated and highlighted significance of various mechanisms that might
have a potential to alter the aerosol behaviour:
a)
De-agglomeration of aerosol agglomerates subjected to high shear.
b)
Effect of high turbulence on the particle agglomeration and hence the sedimentation velocity of the
agglomerates.
Current ARTIST tests demonstrated that if aerosol agglomerates experience a large shear force they could
display a shift in the size distribution since smaller particles are generated. As an example, the
deagglomeration of aerosol agglomerates has caused a reduction in the aerodynamic mass median diameter
from an initial value of 3-4 µm to about 2 µm. Further de-agglomeration did not happen. Large shear
forces under the actual conditions can be generated by very high (up to sonic) velocity in the tubes or in a
sonic front when the aerosol laden gas is discharged from a break into the secondary side from the primary
which could be at a pressure at least 2 times higher than the secondary side. The physics of
deagglomeration is not currently fully understood. The relevance of the deagglomeration to the SG tube
rupture issue is that the deagglomeration can modify the aerosol input size distribution significantly as the
aerosols enter into the secondary side from the break.
The ARTIST tests also demonstrated a significant amount of settled aerosol agglomerates at the floor of
the 1:1 sized dryer unit but not so much on the surfaces of the dryer panels. The flow recirculation coupled
with local turbulence produce a faster settling of aerosols then predicted. Research is underway to
understand the mechanisms responsible for enhanced settling rates of aerosols inside cavities with

NEA/CSNI/R(2009)5
261
prevailing turbulent natural convection. The research makes use of Direct Numerical Simulation (DNS)
coupled with Lagrangian particle tracking to determine the particle trajectories and hence their deposition
rates. DNS is a rigorous methodology, which computes turbulent flow fields without introducing any
modelling of turbulence. To obtain this detailed knowledge, high space and time resolutions are needed,
and hence the requirements for computer power are significant.
5.10.1.2 Integral experiments of horizontal SG in the HORIZON facility
Integral experiments of horizontal SG were conducted in HORIZON facility [2] (Fig. 5.10-2), which is a
scaled-down model of horizontal SGs used in VVER-440, with tube dimensions similar to real SGs. The
objective of the studies was to gather data on aerosol behaviour in the primary side of the SG tubes at
realistic pressure and temperature levels in different flow velocities representing either the defect or intact
SG tubes. The importance of the intact tubes on the overall primary side deposition depends on the break
location along the defect tubes. The data were used for the model development.
Fig. 5.10-2 Picture of the HORIZON facility
The results of aerosol deposition on the primary side of the horizontal SG were compared with the values
obtained from the calculations with the existing deposition models. It appeared that the current models are
adequate at low Reynolds numbers (Re) below 5000, but give too high deposition velocities at high Re
above 70 000 compared to the experimental results. The turbulent impaction is considered to be the main
deposition mechanism at high Re. However, the effect of resuspension, which becomes significant at high
Re, is not usually taken into account in the calculations, and it should be added to the models. When
looking at the amount of deposited material as a fraction of the material injected into the tubes, it is seen
that in all experiments the deposited fraction per unit length has a peak at the tube bend. The effect of
flooding the secondary side with water was also shown to be significant. Still, majority of the aerosol
injected into the tubes is transported as aerosol out of the tubes, and therefore, the effect on environmental
releases is small. More important effect of the secondary side flooding comes from the secondary side
mechanisms such as pool scrubbing.
5.10.1.3 Separate effect studies of vertical SG in the PECA facility
An experimental program was carried out in the PECA rig of the Laboratory for Analysis of Safety
Systems of CIEMAT [3]. The test section consisted mainly of a scaled mock-up of the tube bundle
(Fig. 5.10-3) of a SG that was introduced in the 8 m
3
vessel of the PECA facility. The test matrix was set
up based on best estimate calculations for two real pressurised nuclear power plants [4]. The major
variables to be analysed were type (guillotine and fish-mouth) and orientation of the breach and gas flow

NEA/CSNI/R(2009)5
262
rate. TiO
2
particles were used to keep the tests as similar as feasible to ARTIST’s and, as there, there were
evidences of particle fragmentation during the tests.
Fig. 5.10-3 Picture of the bundle used in the PECA facility
Particle retention within the breach stage of a SG was observed to be rather low (less than 20 %) under the
studied conditions. This result looks consistent with those from ARTIST.
The results indicated that retention efficiency decayed with gas mass flow rate from 100 kg/h to 250 kg/h
follows a very simple correlation [3].
The type of the breach and the breach orientation did not result in quantitative differences in the mass
removed from the aerosol source coming into the secondary side, when gas flow rates were above
100 kg/h. Conversely, when flow rates were lower the mass retained in all the break configurations did
distinguish clearly from each other. The deposition pattern within the bundle was proved to be highly
dependent upon breach type. Guillotine tests showed a squared-shaped deposition profile, while in fish
mouth tests a triangular-shaped one was observed. In addition, retention in guillotine type break was
concentrated on the first nearest tubes, while in the fish-mouth configuration farther tubes as a whole gave
a significant contribution to the total mass depleted.
5.10.1.4 Separate effect studies of horizontal SG in the PSAERO facility
The separate effect experiments of horizontal SGs were conducted in PSAERO facility [2] (Fig. 5.10-4).
The separate effect experiments were designed to complement the integral experiments conducted with the
HORIZON facility. In the experiments aerosol deposition and the movement of deposited particles were
measured online using radiotracer technique. The objective of the experiments was to gain mechanistic
understanding about aerosol behaviour in the SG tubes.
Resuspension was observed to take place simultaneously to deposition in turbulent flow. Particles most
probably resuspended as large agglomerates, since the deposition velocity of resuspended particles was
observed to be much higher than that of the injected aerosol. It was also evident that the resuspended
agglomerates mainly moved close to the surface. The relation with the deposition and time dependence of
the process requires that resuspension should thus be modelled dynamically

NEA/CSNI/R(2009)5
263
.
N2
Steam
Filter
Flow Furnace
Gamma-
detectors
Dry powder
generator
Mixer
Deposition tube
L = 3 m, D = 13 mm
Mixing tube
Fig. 5.10-4 A schematic picture of the PSAERO facility
The flow rate during the deposition phase had a very significant impact on the strength particles adhered to
the surface. It was evident that
particles deposited in a higher flow rate were much harder to resuspend than
was the case with a lower flow rate
. The probable reason for this was that impaction of large particles
packed the deposit near the tube inlet. Therefore, resuspension was first observed close to the outlet of the
tube, where the deposit was mainly formed by settling.
Particle diameter was also observed to be an important parameter in determining the adhesion of deposit.
When results from these experiments were compared to previous studies, it was noted that polydisperse
aerosol adheres to the surface much better than monodisperse aerosol [5]. The reason for this is that
particles in the deposit layer have more contacts to other particles than is the case with monodisperse
aerosol. A major problem in resuspension modelling is that the effect of particle size distribution is
generally not taken into account. Parameters derived from experiments, conducted with monodisperse
particles, should be used with caution in models describing the behaviour of polydisperse aerosol. As a
further complication, surface roughness of the particles significantly influenced the adhesion, even if the
size distribution of aerosol did not change.
The results from the experiments were adequately reproduced with a correlation model that used friction
velocity as a variable. This can be understood, if it is assumed that turbulent bursts are the main
mechanism for particle resuspension. The frequency of turbulent bursts in laminar sub-layer depends
primarily on the friction velocity. The impaction of large particles must also have caused erosion. A
significant fraction of the already deposited particles were knocked from the surface and subsequently
deposited further downstream.
References
[1] S. Güntay, D. Suckow, A. Dehbi, R. Kapulla “ARTIST: Introduction and first results” Nuclear
Engineering and Design, 231(2004) 109-120
[2] A. Auvinen
a
, J.K. Jokiniemi
a
,. A. Lähde
a
, T. Routamo
b
, P. Lundström
b
, H. Tuomisto
b
, J. Dienstbier
c
,
S. Güntay
d
, D. Suckow
d
, A. Dehbi
d
, M. Slootman
e
, L. Herranz
f
, V. Peyres
f
, J. Polo
f
,
“SG tube rupture
(SGTR) scenarios” Nuclear Engineering and Design 235 (2005) 457–472
a
VTT Processes, Biologinkuja 7, P.O. Box 1602, VTT Espoo 02044, Finland
b
Fortum Nuclear Services, Vantaa, Finland
c
Nuclear Research Institute Rez plc, Czech Republic
d
Paul Scherrer Institute, Villigen-PSI, Switzerland
e
Nuclear Research and Consultancy Group, Arnhem, Netherlands
f
Centro de Investigaciones Energeticas, Medioambientales y Tecnologicas, Madrid, Spain
NEA/CSNI/R(2009)5
264
[3] L.E. Herranz, F.J.S. Velasco, C. López del Prá "Aerosol retention near the tube breach during SG
tube rupture sequences" Nuclear Technology, Accepted for publication, 2005
[4] P. Bakker, M. Slootman, J. Dienstbier, S. Güntay, L. Herranz, J. Jokiniemi, T. Routamo, Accident
Management Aspects of EU-SGTR Project Workshop on Implementation of Severe Accident
Management Measures, NEA/CSNI/r(2001)20, 2001
[5] L. Biasi, A. de los Reyes, M.W. Reeks, G.F. de Santi "Use of a simple model for the interpretation
of experimental data on particle resuspension in turbulent flows" Journal of Aerosol Science 2001,
32, pp.1175-1200
5.10.2 EVAN
Within the ISTC (International Science and Technology Center) frame some Russian organisations headed
by 'Saint Petersburg Research and Design Institute ATOMENERGOPROEKT' have just started with the
work on a project called EVAN (Ex-Vessel Source Term Analysis [1]). Some Western partners like VTT
(Finland), GRS (Germany), CEA and IRSN (France), PSI (Switzerland) and ITU of the Joint Research
Center (EC) have joined the project as so-called collaborators.
Concerning aerosols there are two experimental tasks of the working programme being of particular
interest:
−
aerosol, transport, deposition and resuspension in the primary circuit
−
release of low volatile fission products from a molten pool
In a first project phase scoping tests are planned. Concerning the aerosol behaviour in the circuit the
upwards flow of liquid and solid aerosol particles (up to 10 µm) respectively will be investigated in a
vertical pipe with 6 m height and 36 or 98 mm diameter. These EVAN tests are adjacent to the former
STORM tests (see chapter 5.2.3) in which transport, deposition and resuspension in horizontal pipes were
investigated.
In the scoping phase for the release tests low volatile compounds of the elements Mo, Ce, La, Sr and Ba will be
examined. Their release from an UO
2
-ZrO
2
-Zr pool under oxidizing conditions at temperatures in the range of
50 - 100 K above T
liq
will be measured. It is expected that these EVAN tests increase the knowledge based on
past EC projects [2, 3]. For the future some Western partners recommend to vary the pool composition and to
add in some tests the main decomposition products from molten-corium-concrete-interactions.
In parallel to the experiments analytical work is planned.
References
[1] ISTC The 'Ex-Vessel Source Term Analysis' (EVAN) ISTC project includes theoretical and
experimental research on the processes affecting the late phase fission ….
[2] C.G. Benson, H. Hein, M.P. Kissane, M.K. Koch Fission Product Release from Molten Pools:
Final Summary Report, CEC, 4
th
Framework Programme on Nuclear Fission Safety, Contract No.
F14S-CT96-0021, ST: MP(99)-P031, May 1999
[3] A.M. Beard, S. Bechta, C.G. Benson, V.T. Berlepsch, F. Funke, C.C. Kemp, M.P. Kissane, M.K.
Koch, J. Kronenberg, B. Kujal, M.S. Newland, K.-G. Petzold, H. Plank, W. Plumecocq Late
Phase Source Term Phenomena: Final Report, 5
th
EURATOM Framework Programme, Contract No.
FIKS-CT-1999-00005, SAM-LPP-D032, July 2003
NEA/CSNI/R(2009)5
265
5.10.3 Penetration leakage tests
A series of experiments are being performed at AECL on water droplet aerosol leakage through simulated
containment leak paths. The experiments are designed based on the assumption that aerosol leakage
through containment leak paths such as valves and airlock-door seals will be characterised by an abrupt
change in the cross-sectional flow area, where gas and aerosol flows move from a high pressure
(containment) region, through small gaps resulting from seals or valves being improperly seated, to a lower
pressure region. The abrupt change in flow area for a pressurised flow is expected to lead to aerosol
leakage occurring under choked-flow (or sonic) conditions at the contracted portions of the leak paths.
The experiments are described in detail in Section 3.1.3. They are performed in a cubic plexi-glass
chamber fitted with an aerosol characterization port. The chamber also contains two matched sampling
lines fitted with filtration ports (U1 and U2). The U1 line has a high efficiency filter assembly to collect
water droplets upstream of the prototypical leak path, whereas the U2 line has the filter assembly
downstream of the leak path. Each line is connected to a rotameter through a valve to measure and match
the flow rates through each path. Choked-flow conditions are achieved by maintaining low pressure
downstream of the leak paths sufficient to ensure that the downstream-to-upstream pressure ratio is lower
than 0.53. A vacuum pump is connected to the downstream port of the rotameters to maintain the low
pressure.
A Cyclone Fogger (Curtis Dyna-Fog
®
, Model 3000) containing a solution of an uranine (sodium
fluorescein) dye in water is used for aerosol generation. The dye fluoresces at a characteristic wavelength
and concentrations of the water retained on the filter assemblies and in the leak paths can be determined
using fluorescence spectrophotometry. In a typical experiment, the vacuum pump is started, and the flow
valves for each line are adjusted so that the rotameter reading on each line is the same. The fogger is
switched on to inject aerosols into the cubic reservoir, and a phase-Doppler anemometer (PDA) is focused
through the aerosol characterization port to measure the mean (average) diameter of wet aerosols. Droplet
mass concentration is not measured, but can be estimated from the ratio of the aerosol injection rate and the
volumetric flow rate through the filtration port. The experiments performed to date have been ambient
temperatures. Filters and leak path assemblies are removed after each experiment and washed thoroughly
with known quantities of distilled water, to re-dissolve the deposited uranine dye. Samples of the filter and
leak path washes are then submitted for fluorescence analysis to determine the uranine concentration.
The wet aerosol experiments indicate that there is significant aerosol transport through single leak path
contractions representative of airlock door seals and isolation damper valves in CANDU containment, and
that leak path plugging does not occur. Further experiments are required to characterise aerosol transport
through sequential expansion and contraction regions representative of the leak path from containment to
the outside atmosphere during a postulated accident scenario. Additional experiments are also required to
evaluate the extent of leak-path plugging at the higher aerosol mass densities (up to 1000 g·m
-3
) that could
be anticipated during the containment over pressurization period in a CANDU accident scenario.
In connection with these investigations Japanese results [1] reported at the Cologne Workshop in 1998
should be mentioned. Their results of experiments are dealing with fission product trapping in the leakage
paths of the containment. Three series of tests were conducted to study the containment integrity under
accident management, the failure temperature, and the fission product retention along the leakage paths,
respectively. No leakage was detected under Japanese accident management conditions of 200 °C
containment temperature and twice the design pressure. Beyond these conditions, a small leakage was
observed at temperatures above 280 °C. Fission product decontamination factors of 10 to 1000 were
observed along the leakage paths depending on the type of penetration studied.
NEA/CSNI/R(2009)5
266
In 1998 there was agreed that knowledge of fission product retention in containment leakage is adequate
for the types of paths looked at (small electrical penetrations, flanges). Additional work would be needed
to assess the leakage and retention through other types of paths such as containment cracks.
Reference
[1] A. Watanabe, T. Hashimoto, M. Osaki Fission Product Aerosol Trapping Effects in the Leakage
Path of Containment Penetration under Severe Accident Conditions Workshop "Nuclear Aerosols in
Reactor Safety", June 1998 NEA/CSNI/R(98)4 (February 2000)
Private communication between J. Ball and the Chairman.
5.10.4 ThAI aerosol tests
The technical-scale ThAI test facility (ThAI = Thermal hydraulics, Aerosols, Iodine) has been operated
since 1998 by Becker Technologies at Eschborn, Germany, with the objective to provide an experimental
data base for validation of lumped-parameter and CFD (Computational Fluid Dynamics) containment
codes. Tests have been performed in the areas of containment thermal hydraulics, hydrogen distribution,
combustion and mitigation, and behaviour of fission products, in particular aerosols and iodine, with
respect to a potential source term [1].
Fig. 5.10-5 depicts the ThAI facility including its auxiliary rooms. Main component of the facility is the
60 m³ stainless steel vessel, 9.2 m high and 3.2 m in diameter. It can be operated up to 180 °C and 1.4 MPa
overpressure, and withstand moderate hydrogen deflagrations. The vessel volume can be subdivided by
removable inner structures into any multi-compartment configuration. The cylindrical part of the test
vessel is equipped with three independent heating/cooling jackets for controlled wall temperature
conditioning. The outer sides of the vessel and the heating/cooling jackets are thermally well isolated by
rockwool. A large top flange and two man holes provide access to the interior of the vessel for
modifications of internals and instrumentation. Measuring flanges on five levels at five circumferential
positions allow installation of in-situ optical and conventional instrumentation, and of sampling lines. Feed
systems are available for injection of steam, air, gas (e.g. helium or hydrogen), iodine, and aerosols at
variable positions.
In the first ThAI test programme (2000 - 2003) exclusively thermal hydraulic tests on stratification
phenomena in a multi-compartment geometry and iodine tests were carried out. In the second ThAI
programme (2003 – 2006) additional tests on the aerosol issues re-entrainment from a boiling sump,
resuspension by a H
2
deflagration, thermal decomposition of a CsI aerosol in a PAR (passive autocatalytic
hydrogen
recombiner), and the formation of IO
x
aerosol were made. They are described here briefly.

NEA/CSNI/R(2009)5
267
Fig. 5.10-5 ThAI facility with 60 m³ test vessel
Re-entrainment from a boiling sump
Two ThAI re-entrainment tests were made with a boiling sump surface (0.55 m²) being larger than used in
earlier tests, a large gas volume above the sump (60 m³) and sophisticated aerosol instrumentation.
Non-radioactive soluble CsCl and KI salts were added as fission product simulants to the boiling sump.
The maximum heating power of the sump was 75 kW. In both tests the atmosphere was superheated and
the released droplets dried there. The measured re-entrainment values confirm the results of the former
REST tests and the KWU tests, but due to the better aerosol instrumentation the measured droplets and the
dried particles respectively were significantly smaller. For the dry aerosol a mass median diameter
< 0.1 µm was found. These findings may have an influence on source term estimations and should be
considered.
Resuspension by a H
2
-deflagration
In three ThAI tests the “dry” resuspension of deposited aerosol by a H
2
deflagration was measured. First a
layer of deposited aerosol was prepared by injecting CsI aerosol followed by a settling period of 24 h. Then
the 5.5 m long deflagration tube was filled with a hydrogen/air mixture and ignited. The burnt gas escaped
through a slit nozzle at the bottom in horizontal direction over the aerosol deposits. Only a relatively small
area was blown on by the gas with a maximum velocity between 17 and 70 m/s. However, a significant
portion of the CsI was resuspended as the measured peak in the airborne aerosol concentration indicates

NEA/CSNI/R(2009)5
268
Aer-1: Aerosol Resuspension by a H
2
Deflagration
0,0001
0,001
0,01
0,1
1
10
-25 -20 -15 -10 -5 0 5 10 15 20
time h
aerosol concentration g/m³
filter station 1
filter station 2
cascade impactor
D
E
F
L
A
G
R
A
T
I
O
N
A
E
R
O
S
O
L
I
N
J
E
C
T
I
O
N
Just after the deflagration the measured particle size shows a large fraction of coarse particles. It has to be
mentioned that gas velocities caused by faster deflagrations, local detonations and fuel-coolant interactions
will be significantly higher resulting in a higher resuspended aerosol fraction. The tests are a valuable
extension for the poor data base on resuspension at highly transient gas flows.
Fig. 5.10-6 Aerosol resuspension by a hydrogen deflagration in the ThAI vessel
Thermal decomposition of a CsI aerosol in a PAR
Passive autocatalytic hydrogen recombiners (PAR) are installed in LWR containments in order to reduce
the hydrogen concentration in the case of a reactor accident. Laboratory-scale tests have shown that in a
PAR CsI aerosol will be decomposed into gaseous molecular iodine (I
2
) and CsOH aerosol at high
temperatures. It is necessary to know the reaction because volatile species as I
2
or organic ones can be
easierly released to the environment. The volatile species do not deposit in such a degree as iodine aerosols
and their retention in filters is less efficient.
Two ThAI tests were made on the interaction of a CsI aerosol with a commercially available PAR from
Framatome ANP. First the CsI aerosol injection was started, then hydrogen was injected which
continuously recombined in the PAR. The CsI concentration lay between 0.1 and 1.0 g/m³ and the
maximum hydrogen concentration was approximately 9.0 Vol.-%. In both tests no I
2
could be detected, i.e.
the CsI decomposition rate was always smaller than 3 %.
Formation of IO
x
aerosol
Ozone produced under reactor accident conditions in the containment atmosphere will react with molecular
iodine (I
2
) forming an IO
x
aerosol. Two ThAI tests were performed on the so-called iodine/ozone reaction.
Surface effects have been significantly reduced compared to laboratory-scale tests.
NEA/CSNI/R(2009)5
269
In both tests ozone produced in a commercial apparatus was released to the vessel atmosphere containing
approximately 1·10
-8
mol/l I
2
. The ozone concentrations were different in the two tests. In one test the
gaseous I
2
was totally converted to IO
x
(gas-to-particle conversion) while in the other test only a portion of
the I
2
reacted. The measured particle size distribution of the generated fine disperse IO
x
aerosol had a mean
particle diameter of 0.2 µm. In these tests no so-called background aerosol simulating the nuclear aerosol
was present. Such a test is planned in the next ThAI program.
The third ThAI program (2006 – 2009)
A major part of the tests planned in the German ThAI-3 program is offered to international participation in
the frame of an OECD project. Among others two aerosol issues will be investigated in ThAI-3.
In continuation of the tests in ThAI-2 the formation and behaviour of an IO
x
aerosol will now be measured
in the presence of a simulated nuclear aerosol. The fine-disperse IO
x
aerosol generated in the ThAI-2 tests
remained airborne over a long period of time. It is expected that in the new tests the IO
x
will be rapidly
taken up by the nuclear aerosol and that the settling of the mixed aerosol with IO
x
is significantly faster
than for the IO
x
aerosol alone.
A new issue is the wash-down of deposited aerosols from wall surfaces by condensate. Of particular
interest is the distribution of the fission products between walls and sump especially with respect to decay
heat effects. Decay heat released in the sump produces steam and raises the containment pressure while a
decay heat release into walls and gas dries the containment atmosphere. For wash-down investigations two
vertical coolers will be installed in the ThAI vessel, one with a steel surface the other with a painted
surface. They will be exposed to condensing atmospheres containing soluble and insoluble aerosols as well
as gaseous iodine. The time-dependent aerosol concentrations on the walls and in the sump will be
measured.
Reference
[1] T. Kanzleiter, G. Poss, F. Funke, H.-J. Allelein THAI Multi-Compartment Test Program
Proceedings of ICONE14 14
th
International Conference on Nuclear Engineering, July 17-20, 2006,
Miami, Florida, USA
5.10.5 Impact of catalytic hydrogen recombiners
Background
Passive hydrogen re-combiners have been studied for many years as a means of preventing accumulation
of hydrogen in the containment of a water-cooled reactor following a design-basis or severe accident [1, 2].
Their installation is now an established and sometimes mandatory measure. Back-fitting of such devices on
existing nuclear power plants has been performed or is in progress in many countries while Generation III
reactor designs (AP600, EPR, etc.) are already equipped with them.
Passive autocatalytic recombiners (PAR) are usually based on palladium and/or platinum dispersed on
some substrate medium. A PAR comprises a vertical conduit with the catalytically-active part near the
bottom. If hydrogen is present in the containment, the hydrogen molecules making contact with the
noble-metal catalyst react with the oxygen of the containment atmosphere producing steam and heat. The
reaction heat provokes heating up of the catalytic elements inducing natural convection which draws more
of the containment atmosphere into the PAR from below. The effect is not only to recombine hydrogen
with oxygen as it passes through the catalytic elements but to mix the containment atmosphere eliminating
any pockets where hydrogen concentrations may be elevated. We note also that carbon monoxide is
oxidised on the catalysing surface. While the operating principle of PARs is well understood, there remains
NEA/CSNI/R(2009)5
270
some progress to be made before it can be said that a thorough understanding exists of the sensitivity of
PARs to the conditions expected to be produced by design-basis or severe accidents. It should be noted,
however, that while little information is in the public domain (e.g., see [2, 3]) much more probably remains
proprietary. There are a number of companies marketing PARs, e.g., Atomic Energy of Canada Limited,
AREVA/ Framatome-ANP, Nuklear Ingenieur Service mbH, Electrowatt-Ekono AG, and each design is
different having its own operating characteristics.
There is a potential problem with the use of PARs in relation to aerosol particles suspended in the
containment atmosphere. As these pass through the catalytic elements they will be heated up along with the
gases and this will inevitably lead to partial evaporation of volatile species from the aerosols. Peak
temperatures of the catalytic elements vary according to the manufacturer. In any case they are about
500 °C and higher. But the gas temperatures between the elements are significantly lower except for the
boundary layer close to the elements. The level of temperature is strongly dependent from the
H
2
-concentration in the gas. These high temperatures might be high enough to evaporate some fission
product species. These fission-product vapors may well interact chemically with each other and/or with the
gases of the atmosphere (in general a combination of nitrogen, oxygen, steam, carbon monoxide and
carbon dioxide), especially oxygen. There is therefore the possibility that reactions in PARs could lead to
formation of more volatile forms of fission-product species aggravating the source term by converting
easily-filtered aerosol material into more troublesome vapors and gases.
RECI tests
A series of experiments, known as RECI, has been performed to investigate the thermal decomposition of
fission-product species in conditions related to those of a severe accident [4]. The objective of the RECI
experiments was measurement of any creation of more volatile forms of iodine, viz. I
2
, HOI and HI, from
metal-iodide species expected in severe accidents, viz. AgI, InI, CdI
2
and CsI. Two of these species,
cesium iodide or cadmium iodide, in an atmosphere of humidified air were injected as aerosols into a
heated tube in tests both with and without the presence of a catalysing surface. The experiments comprised
separate tests for aerosols of each of the two pure substances. The peak temperature of the heated tube was
varied between 500 and 950 °C. The gas-phase iodine species were not measured in the heated tube but
downstream where temperature had once again become ambient. It was found that thermal decomposition
producing molecular iodine could occur even for the more stable of these species, cesium iodide, where the
presence of a catalyst increased the iodide to iodine conversion by a factor of two to three. At the highest
temperatures, conversion rates of more than 10 % were measured for cesium iodide. Conversion rates for
cadmium iodide were significantly greater. Sensitivity to parameters such as particle size and transit time
through the heated zone was checked where longer transit times and smaller particles led to higher
conversion rates. A further effect of the partial evaporation of the aerosols was to produce a population of
small particles as the vapor(s) re-condensed during cooling downstream of the heated tube. This new
population resulting from homogeneous nucleation was significantly smaller than any of the source
particles injected into the heated tube.
One of the worst actors poisoning catalysts used in PARs may be sulfur being part of the air atmosphere
inside the containment and coming from cable insulation in cases of fire. Another potential effect of the
molecular iodine production would be to poison the catalyst with respect to hydrogen conversion.
However, in separate effect tests, this poisoning was found to be very limited [3].
Initial analysis of the RECI tests supports the idea that the maximum gas temperature (incl. boundary
layer) and the kinetics of the chemical reactions downstream of the heated zone are keys to the
understanding of the conversion process. In other words, if a thermodynamic approach to chemistry is
assumed (i.e., equilibrium chemistry) as the flow cools then the volatile species convert back to less
volatile forms and conversion is virtually zero. Furthermore, the conversion rates calculated at the peak
NEA/CSNI/R(2009)5
271
temperature, i.e., in the heated tube, are close to those measured at ambient temperature implying almost
complete quenching of chemical reactions once they left the heated tube.
It should be understood that these experimental results are simply a confirmation of the potential for iodine
species from containment aerosols to convert to more volatile species while in transit through a PAR. A
number of representativity aspects prevent these results from being extrapolated to the reactor case. In the
first instance, the aerosols investigated were pure substances: the consequences of using prototypical
mixed-substance aerosols will necessarily alter the gas-phase chemistry produced in the PARs. In addition,
the presence of mixed aerosols with refractory kernels will perhaps facilitate re-condensation of evaporated
species during cooling onto existing aerosols rather than formation of new ones, i.e., heterogeneous rather
homogeneous nucleation. The gas mixture used in these tests was humidified air where, in the
containment, at least during a severe accident, a less-oxidizing mixture containing a higher steam fraction
as well as hydrogen will be present: it is known that reducing conditions are thermodynamically less
favourable to formation of volatile iodine species. Finally, the cool-down characteristics of the flow
leaving the PARs have not been reproduced in the RECI tests: this is crucial to the propensity for vapors to
re-convert as they cool where more rapid cooling will not favour this re-conversion to a gas-vapor-aerosol
mixture closer to that at equilibrium at ambient temperature.
ThAI tests
(see chapter 5.10.4)
Conclusions
Analytical experiments have demonstrated that there is potential for PARs to generate volatile forms of
iodine, namely molecular iodine, by thermal decomposition of metal-iodide species contained in
containment aerosols. It is uncertain whether such chemical transformations will be reproduced in
conditions fully representative of an accident (a certain mitigation of molecular-iodine production might be
expected in realistic conditions) where a new programme of experiments introducing more representativity
is being planned. It has also to be recognised that iodine may not be the only fission product concerned:
some formation of the highly volatile species ruthenium tetroxide is possible in the conditions expected
within the PARs though no investigation of this has been performed. Nevertheless, on the basis of current
knowledge, any speculation as to the consequences for the source term of PAR operation during an
accident would seem unwise though, clearly, negative effects seem possible.
References
[1] F. Fineschi, G. Koroll, J. Rohde “Mitigation of hydrogen hazards in water cooled power reactors”
IAEA-TECDOC-1196 (2001)
[2] E. Bachellerie, F. Arnould, M. Auglaire, B. de Boeck, O. Braillard, B. Eckardt, F. Ferroni, R.
Moffett “Generic approach for designing and implementing a passive autocatalytic recombiner
PAR-system in nuclear power plant containments” Nucl. Eng. Des. 221(1-3), 151-165 (2003)
[3] F. Morfin, J.-C. Sabroux, A. Renouprez “Catalytic combustion of hydrogen for mitigating hydrogen
risk in case of a severe accident in a nuclear power plant: study of catalysts poisoning in a
representative atmosphere” Applied Catalysis B: Environmental 47, 47-58 (2004)
[4] J.-C. Sabroux et al. "Iodine chemistry in hydrogen recombiners" EUROSAFE 2005, Brussels,
November 7-8, 2005
NEA/CSNI/R(2009)5
272
5.10.6 Aerosol growth under saturated conditions (Canadian tests)
At present the AECL containment code SMART is still lacking the models required to simulate aerosol
behaviour under conditions where fission products are released and aerosols are formed in a steam-only
discharge (as opposed to a two phase jet). Although various models exist for the growth of initially dry
aerosol particles by heterogeneous nucleation steam condensation or adsorption of water vapor by
hygroscopic species, there does not appear to be an industry consensus regarding which of these models
are the most appropriate for nuclear containments. Recent aerosol code comparison exercises have
demonstrated that many aerosol codes do not model condensation (particularly solubility effects) well
[see Section 5.2.5]. A significant limitation to implementing condensation models in aerosol codes is that
they rely upon accurate modeling of containment thermalhydraulic parameters [see Section 3.2], and
require the correct coupling (i.e. feed-back at appropriate time intervals) between thermalhydraulics and
aerosol physics models. As a result, inaccurate thermalhydraulic coupling or modelling would result in
large uncertainties in the condensation rates.
Given these limitations of currently available models for water aerosol production by steam condensation,
a semi-empirical approach is proposed for SMART modelling of fission product release in high humidity
steam environments. This approach would use existing information from large-scale experiments,
augmented with new experiments, to develop a range of input parameters for the equilibrium size
distribution, and the number and droplet density of water droplets aerosols formed in a steam discharge, as
a function of thermalhydraulic conditions. The approach assumes that aerosol growth by steam
condensation in the humid (near saturated) environment postulated in a post-accident CANDU
containment will be rapid relative to aerosol depletion mechanisms, and that an equilibrium “wet aerosol”
size distribution can be used as a starting point for aerosol transport and removal calculations.
Both the KAEVER and VANAM experiments were obtained under high humidity conditions that are
relevant to CANDU accident conditions. Unfortunately, the published data from these experiments does
not contain enough information about aerosol particle size as a function of time to be considered a sole
source for validation of any single aerosol phenomenon. Consequently, the CANDU Owner’s Group is
funding experiments at AECL to acquire the additional aerosol data required to characterise aerosol droplet
size distribution, number density and mass density that would result from condensation of steam on fission
product aerosols in a saturated steam environment. The planned experiments will be similar in nature to
those performed in the KAEVER facility, using hygroscopic and non-hygroscopic simulated fission
products, but with more frequent sampling of aerosol size. The experiments are to be performed in the
Large Scale Containment Facility (LSCF) at Chalk River Laboratories, a 1650 m
3
facility, instrumented
with temperature and relative humidity probes, and with ports at three different elevations for the injection
of saturated or slightly superheated steam. The facility has recently been fitted with a PDA measurement
system for aerosol size and velocity.
Results observed from the KAEVER experiments indicated that aerosols of different hygroscopicity
agglomerated to give particles with the same overall composition that behaved like aerosols of the most
hygroscopic of the individual components. Based on these results it is anticipated that the time required for
fission product/water droplets to reach.equilibrium size distribution by steam condensation and adsorption
of water would be short relative to the time required for their depletion by aerosol removal processes.
Confirming this experimentally would mean that there is no reason to incorporate a detailed model for
steam condensation into SMART.
Reference
Private communication between J. Ball and the Chairman.

NEA/CSNI/R(2009)5
273
6. EXAMPLES FOR VALIDATION
Here it is to remark that the assessment of the results presented in Chapter 6 reflect the opinion of the
organisation providing the contribution.
6.1 Comparison of MELCOR Predictions to Experiments
It might be expected, MELCOR predictions are compared to experiment results frequently. Many of these
comparisons of code predictions deal with the hydraulic and heat transfer aspects of the code predictions.
Here some examples more directly pertinent to the issues of aerosol behaviour are shown.
Fig. 6.1-1 shows a comparison of the predicted releases of iodine from irradiated reactor fuel and the
results of the PHÉBUS FPT-1 test [1]. The agreement between code predictions and tests observations of
iodine release are considered satisfactory for the purposes of MELCOR. Fig. 6.1-2 shows a comparison of
experimental results for aerosol (NaOH) depletion in the VANAM-M3 test [2] to predictions of the
MELCOR code. Observed and predicted aerosol depletions are thought to be in satisfactory agreement for
the purposes of the MELCOR computer code.
MELCOR Prediction of PHEBUS Data
Iodine Release Fraction FPT-1
Time (seconds)
8000 12000 16000 20000
Iodine Release Fraction
0.0
0.2
0.4
0.6
0.8
1.0
MELCOR
PHEBUS Data
Fig. 6.1-1 Comparison of MELCOR predictions of iodine release with observations made in the
PHÉBUS-FPT-1 test

NEA/CSNI/R(2009)5
274
Aerosol Depletion in Dome
Time (hours)
16 18 20 22 24 26 28 30
Aerosol Mass Concentration (g/m
3
)
0.0001
0.001
0.01
0.1
1
10
MELCOR prediction
test data
Fig. 6.1-2 Comparison of results from the VANAM-M3 test to predictions of the MELCOR computer
code
CSE Test A9 CsOH Concentration
Time (hours)
0123456
CsOH Aerosol Concentration (g/m
3
)
1e-8
1e-7
1e-6
1e-5
1e-4
1e-3
MELCOR dome
MELCOR middle room
MELCOR sump
Dome data
Middle room data
Sump data
Fig. 6.1-3 Comparison of predictions obtained with the MELCOR code to results of the CSE A9 test

NEA/CSNI/R(2009)5
275
Suspended CsOH in LACE Test LA-4
Time (hours)
0.1 1 10
Suspended CsOH Mass (kg)
1e-6
1e-5
1e-4
1e-3
1e-2
1e-1
1e+0
1e+1
MELCOR
Data
MnO Aerosol in LACE Test LA-4
Time (hours)
0.1 1 10
Suspended MnO Mass (kg)
1e-6
1e-5
1e-4
1e-3
1e-2
1e-1
1e+0
1e+1
MELCOR
Data
Fig. 6.1-4 Comparison of MELCOR predictions to the results of the LA-4 test

NEA/CSNI/R(2009)5
276
Comparison to ACE Pool Scrubbing Tests
Calculated Decontamination Factor
1 10 100 1000 10000
Observed Decontamination Factor
1
10
100
1000
10000
Perfect Correlation
Standalone SPARC 90
MELCOR
Comparison to EPRI/BCL Test Results
Calculated Decontamination Factor
1 10 100 1000 10000
Observed Decontamination Factor
1
10
100
1000
10000
Perfect Correlation
SPARC 90
MELCOR
Fig. 6.1-5 Comparison of computer code predictions to suppression pool decontamination observed in
various tests
NEA/CSNI/R(2009)5
277
A comparison of code predictions with experimental results obtained in the CSE-A9 test [3] is shown in
Fig. 6.1-3. This comparison illustrates the ability of MELCOR to treat aerosol phenomena in
multicompartment facilities as well as predicting decontamination by containment sprays operating in the
experiment dome. Finally, comparisons of code predictions to results of the LACE LA-4 test [4] are shown
in Fig. 6.1-4. In this test CsOH aerosol followed by MnO aerosol were injected into a very large
containment volume. Overall agreement between predictions and test results is good. There is a tendency
for MELCOR to overpredict the long term aerosol concentration and to underpredict the concentration of
the second component concentration in the aerosol. These trends are observed in other code comparisons
as well. A comparison of the decontamination by suppression pools predicted by MELCOR and by the
standalone version SPARC90 code with decontaminations measured in the ACE tests [5] and the
EPRI/BCL tests [6] are shown in Fig. 6.1-5. Were code predictions and test observations perfectly
correlated, points shown in the comparisons would fall on the diagonal lines.
References:
[1] D. Jacquemqin, S. Bourdon, A. de Bremaecker, M. Barrachin PHÉBUS P.F.: FPT1 Final Report
Institut de Protection et de Surete Nucleaire, Centre d’Etudes de Cadarache, France, January 2000
[2] M. Firnhaber et al. International Standard Problem ISP37: VANAM M3 - A Multi Compartment
Aerosol Depletion Test with Hygroscopic Material OCDE/GD(97)16, December 1996
[3] E. Lindroth
Containment Systems Experiment, Part 1: Description of Experiment Facilities,
BNWL-456, Battelle-Northwest Laboratory, March 1970
[4] R.K. Hilliard Test Plan - LWR Aerosol Containment Experiment (LACE) Test LA-4-Late
Containment Failure with Overlapping Aerosol Injection Periods Westinghouse Hanford Company,
Richland, WA, July 1986
[5] R.T. Allemann, J.A. Bamberger, Comparison of Code Results withACE Pool Scrubbing Tests,
ACE-TR-A13, Battelle Pacific Northwest Laboratory, Richland, WA, June 1990
[6] J.C. Cunnane et al. The Scrubbing of Fission Product Aerosols in LWR Water Pools Under Severe
Accident Conditions - Experimental Results NP-4113-SR, Electric Power Research Institute, Palo
Alto, CA, 1984
6.2 CONTAIN for PHÉBUS FPT1
Introduction
The present Technical Note summarises the main results obtained by CIEMAT in the analysis and
interpretation of the PHÉBUS-FPT1 experiment with the CONTAIN 2.0 code. As this note will be
integrated in the State Of the Art Report (SOAR) on Nuclear Aerosols, it is focused on aerosol aspects,
leaving other phenomena studied, like thermal-hydraulics and iodine chemistry, out of the scope of this
document.
This technical note is based on the paper “Simulating In-Containment Aerosol Behaviour during Severe
Accidents: A Validation of CONTAIN 2.0 Code Based on the PHÉBUS-FPT1 Experiment”, presented by
[1] at the International Congress of Advanced Nuclear Power Plants, Seoul (Korea) 15-19 May, 2005.

NEA/CSNI/R(2009)5
278
Experimental description
PHÉBUS-FP is an international program set up to investigate key phenomena involved in Light Water
Reactor (LWR) severe accidents, particularly those in the field of core degradation and fission products
behaviour. Six integral in-pile experiments have been planned and they will be executed in a facility scaled
down 1:5000 from a 900 MWe Pressurised Water Reactor (PWR). The experimental rig consists of three
main sections: core, primary circuit and containment. A more exhaustive description of the program was
reported by [2].
The FPT1 test
[3] was aimed at investigating core degradation and release, transport and behaviour of
fission products and aerosols. The specific conditions imposed in the experimental rig were: irradiated fuel
(∼23 GWd/tU), presence of a Ag-In-Cd control rod, low pressure and highly oxidizing environment in the
primary circuit, a condensing and unsaturated atmosphere and a subcooled and acidic sump in the
containment. From the point of view of containment phenomena, the test evolved in four main phases:
bundle degradation, aerosol depletion, floor washing and iodine chemistry.
The PHÉBUS-FP containment is a 10 m
3
steel vessel (Fig. 6.2-1). Three cylindrical structures, hereafter
called condensers, were attached to the ceiling in order to achieve a surface-to-volume ratio characteristic
of a 900 MWe PWR. Each of them consisted of a wet upper part, where temperature was controlled below
the saturation one during most of the test, and a dry part, quite overheated with respect to the atmosphere.
The vessel walls were also kept at temperatures higher than the saturation temperature throughout the test.
The floor of the vessel was equipped with a sump containing around 105 l of water at a temperature similar
to the wet condenser ones. The injection point in the containment vessel is located at the lower region (0.8
m above the sump) and it is directed upward to the space bounded by the three condensers.
Fig. 6.2-1 Geometry and thermal conditions of containment vessel during the FPT1 test
At the beginning of the test, the vessel atmosphere was essentially nitrogen (61.4 %) and steam (35.4 %) at
about 2 bar and 108 ºC (the remaining 3.2 % was oxygen). Steam and hydrogen (resulting from oxidation
reactions in the fuel bundle) came into the containment according to the histories presented. As can be
noted, steam flow rate showed some abrupt changes but it was never zero until about 18000 s. Hydrogen
NEA/CSNI/R(2009)5
279
input, however, was much smaller and quite more restricted in time (it only reached a noticeable
magnitude at around 11500 s).
Between 7900 s and 14500 s from the beginning of the test, the release from the control rod took place and
fuel liquefaction started. As a consequence, between 11000 s and 18600 s, control rod elements as well as
volatile fission products such as iodine, cesium and tellurium, arrived at the containment carried by the
cooling steam and hydrogen. The aerosol input rate was far from being constant due to both bundle
phenomena and/or gas flow-rate variations.
As a result of the history of steam injection through the fuel bundle as well as of the thermal boundary
conditions, the atmosphere of the containment vessel was unsaturated throughout the test. In spite of this,
the presence of cold surfaces on the condensers allowed to investigate aerosol dynamics in steam
concentration gradients. The thermal state of the vessel became steady from 23000 s on, showing a
temperature of approximately 108 °C and a relative humidity of 60 % (sump and condensers were kept
constant at 90 °C and 92 °C, respectively). A more detailed description of specific thermal variables will
be presented in next sections along with code predictions.
Concerning source term in the containment the main results were reported by [4].
•
Fission products were conveyed to the containment by aerosol particles that were essentially
composed of structural material (more than 60 % was attributed to silver, rhenium and uranium).
•
Aerosols were shown to be homogeneous in composition regardless particle size.
•
A total aerosol mass of about 130 g entered the containment.
•
The aerosol mass distribution might be described by a log-normal function characterised by a
geometric standard deviation around 2.0. Aerosol Mass Median Diameters (AMMD) of about
3.5 –4.0 µm was measured.
•
Most of aerosol mass settled (~65-70 %) but a substantial fraction (25-28 %) was entrained by
steam condensing on the cold surfaces (i.e., diffusiophoresis). Just a minor fraction was found on
the vessel walls (Fig. 6.3-2).
•
Cesium distribution in condensers and floor (~44 % and ~50 %, respectively) was noticeably
different from the rest of elements.

NEA/CSNI/R(2009)5
280
Ag
Cd
Cs
MixIn
I
Te
FPT1 FPT1 FPT1
BE BE BE
20%
40%
60%
80%
Settling: Diffusiophoresis: Walls:
Fig. 6.2-2 Mass distribution (% of the total mass injected)
Contain modelling
The “in-containment” thermal and aerosol phenomena have been simulated with the CONTAIN 2.0 code
[5] and a set of assumptions and approximations have been adopted. The conditions imposed in the
experiment were not particularly challenging for CONTAIN 2.0 models, but they allowed testing them
when using a rather representative aerosol source under well controlled thermal-hydraulic conditions.
A thorough description of the major approximations and hypotheses made in the simulation was reported
by [1]. The PHÉBUS-FP containment vessel was modelled as a single compartment consisting of an upper
and a lower cell where the sump is located. A total of 18 AISI 316L heat structures contacting vessel
atmosphere have been simulated. The change in atmosphere composition was governed by three gas flows:
incoming hydrogen; entering steam; and sampled gas. It has been assumed that steam and hydrogen
entered the containment with the temperature measured at the closest point to the containment inlet. This
temperature varied from 157 °C to 177 °C. The sump contains an initial water volume of 105 l. The role of
the sump as a potential condensation site underlined the importance of capturing accurately its temperature
evolution. In order to achieve it, three actions were taken through the code input deck: to impose an initial
water temperature of 89.3 ºC, to simulate a contacting heat structure at 90 ºC and to cool the water volume
at a time dependent rate.
The aerosol source in CONTAIN 2.0 is described through composition, flow rates, density and size. The
particulate mass entering containment has been grouped in seven aerosol types according to their
composition: Ag, Cd, I, Cs, In, Te and “Mix” (i.e., structural and bundle materials). None of the aerosols
were defined as hygroscopic. Aerosol input rates were estimated from measurements of isotopes flow rates
near the containment entry point. A mass-averaged density of 7.07 g/cm
3
characterises all the aerosols.
This estimate has been calculated from individual densities of the chemical species assumed for each
element (i.e., Ag, Cd(OH)
2
, In
2
O
3
, CsOH, SnO
2
, U
3
O
8
, Re
2
O
7
, MoO
3
). Aerosol particles have been

NEA/CSNI/R(2009)5
281
supposed to be spherical and to distribute log-normally along size domain with a mass median diameter
(MMD) of 1.05 µm and a geometric standard deviation (GSD) of 1.9 [3]. As cesium particles behaved
differently than the rest, its identity was kept by defining an individual particle size based on its actual
density as CsOH. So that, = 0.742 µm.
Results and discussion
CONTAIN 2.0 results were too close to data as to set meaningful quantitative comparisons. Most of the
predictions have been found to be within the uncertainty range associated to measurements. All the
experimental values were drawn from [3].
Fig. 6.2-2 shows a very good agreement between data and CONTAIN 2.0 predictions regarding final mass
distribution. Sedimentation was estimated to be the main removal phenomenon acting on airborne
particles. About 60-80 % of the injected mass was depleted by settling, and the rest (20-40 %) was swept
away from the atmosphere by the condensing steam (diffusiophoresis). The amount of mass on
containment walls was negligible and CONTAIN 2.0 did calculate so as well. As observed, CONTAIN 2.0
results were rather accurate and deviations never exceeded 10 %. Nonetheless, the code underestimated
noticeably the cesium fraction depleted by diffusiophoresis, whereas it tended to overestimate
diffusiophoresis for the rest of aerosols.
Fig. 6.2-3 shows the cesium concentration in the vessel as a function of time. Until 18000 s the
disagreement between the data recorded by γ-spectrometry and by sampling prevents any statement about
CONTAIN 2.0 accuracy, although from a qualitative point of view the CONTAIN 2.0 profile is rather
closer to the sampling data. From 18000 s on, however, both experimental techniques approached each
other and indicated that CONTAIN 2.0 removal from the atmosphere has been lower than observed. This
deviation was associated to a slight under-prediction of the steam condensation rate from that time 18000 s
on.
10000 15000 20000 25000 30000
-5.0x10
-5
0.0
5.0x10
-5
1.0x10
-4
1.5x10
-4
2.0x10
-4
2.5x10
-4
3.0x10
-4
3.5x10
-4
4.0x10
-4
Time (s)
Mass concentration (kg/m
3
)
γ-spec data
Sampling data
BE
Fig. 6.2-3 Cesium concentration versus time
The case of iodine is somewhat different. The measurements from different experimental techniques
looked pretty consistent all over the time (Fig. 6.2-4). CONTAIN 2.0 predicted rather accurately the

NEA/CSNI/R(2009)5
282
evolution during the injection period (~11000-17500 s), but, as in the case of Cs, its removal rate has been
estimated to be slower than measured from that time on.
10000 15000 20000 25000 30000
0,0
1,0x10
-5
2,0x10
-5
3,0x10
-5
4,0x10
-5
5,0x10
-5
γ-spec data
Sampling data
CONTAIN 2.0
Mass concentration (kg/m
3
)
Time ( s )
Fig. 6.2-4 Iodine concentration versus time
Finally, CONTAIN 2.0 predicted particle agglomeration along the injection phase until around 20000 s;
however, no experimental data are available to compare with. In Table 6.2-1 the AMMD and GSD
measured by impactors are presented together with CONTAIN 2.0 predictions. It should be observed the
consistent decreasing trend predicted between 20700 and 26700 s, as well as the quantitative similarity
between measurements and estimates in this same period.
Table 6.2-1 Experimental and predicted AMMD and GSD
Final remarks
The CONTAIN 2.0 code and the theoretical approach followed, despite its overall simple modelling,
resulted in very good agreement with experimental data available and provided explanation to most of the
phenomena observed in the test. In short, the main conclusions drawn from this study are the following:
•
Simplified approaches of in-containment scenarios may be suitable to achieve a thorough
understanding of governing thermal and aerosol phenomena when the main assumptions and
approximations made are taken into account in the discussion of the results.
•
CONTAIN 2.0 results indicated that airborne concentration of fission products, i.e., iodine and
cesium, were well predicted. Even further, CONTAIN 2.0 results highlighted that cesium
concentration evolved according to data from sampling of the atmosphere, reaching values well
above the measurements coming from γ-spectroscopy.
AMMD GSD
Time FPT1 CONTAIN 2.0 FPT1 CONTAIN 2.0
20710 s
3,91
µ
m 4.10
µ
m
1.95 1.46
21002 s
3,91 µm 4.09 µm
1.95 1.45
26109 s
3,54 µm 3.76 µm
1.84 1.40
26709 s
3,54
µ
m 3.72
µ
m
1.84 1.40
NEA/CSNI/R(2009)5
283
References
[1] L.E. Herranz, C.L. del Prá “Simulating In-Containment Aerosol Behaviour during Severe Accidents:
A Validation of CONTAIN 2.0 Code Based on the PHÉBUS-FPT1 Experiment” International
Congress of Advanced Nuclear Power Plants, Seoul (Korea) 15-19 May, 2005
[2] M. Schwarz, R. Zeyen “Status of the PHÉBUS-FP Program” 5
th
Technical Seminar on the
PHÉBUS-FP Programme, Aix-en-Provence, France, June 24-26, 2003
[3] D. Jacquemain, S. Bordon, A. Braemaeker, M. Barrachin FPT1 Final Report (Final version)”
IPSN/DRS/SA/PDF report SA1/00, IP00/479, France, December 2000
[4] F. Arregini, D. Jacquemain, Y. Garnier “Summary of Fission Product Behaviour and Structural
Material Behaviour in FPT1” 4
th
Technical Seminar on the PHÉBUS-FP Programme, Marseille,
France, March 20-22, 2000
[5] K.K. Murata, D.C. Williams, J. Tills, R.O. Griffith, R.G. Gido, E.L. Tadios, F.J. Davis, G.M.
Martinez, K.E. Washington “Code Manual for CONTAIN 2.0: A Computer Code for Nuclear
Reactor Containment Analysis” Sandia National Laboratories Albuquerque, NM 87185, December
1997
6.3 Example for Uncertainty and Sensitivity Analyses of Two Aerosol Calculations
Introduction
The main questions addressed in sensitivity and uncertainty analyses on aerosol problems are: (1) What are
the uncertainties of the aerosol results like aerosol concentrations, deposited mass and the aerosol source
term to the environment? (2) Which are the uncertain parameters contributing most to the uncertainties of
the aerosol results?
The study described here was performed on applications of the coupled thermal hydraulic and aerosol code
FIPLOC, a precursor of COCOSYS. In the first application the dry aerosol behaviour in the test
VANAM M2 was investigated [1, 2]. The test was carried out in a multi-compartment geometry.
The second application was on the LACE test LA4 with a two-component aerosol under wet conditions in
a single volume geometry [3].
Aerosol problem at dry conditions
VANAM M2 was performed with an insoluble SnO
2
injected into one of the nine rooms of the 640 m³
Battelle Model Containment. Only the dry part of the test without steam injection was used. The aerosol
was inhomogeneously distributed by aerosol flows and depleted by natural processes. The post test
FIPLOC calculation which served as a base for the study were in a good agreement with the experiment
(Fig. 6.3-1).

NEA/CSNI/R(2009)5
284
uncertainty and
sensitivity analysis
Fig. 6.3-1 Measured and calculated aerosol concentrations in the test VANAM M2 The course
until 19.7 h was used for the uncertainty and sensitivity analysis
The uncertainty and sensitivity analysis was performed by use of the program package SUSA [4]. A total
of 179 uncertain aerosol and thermal hydraulic parameters were identified, e.g. number of size classes,
accuracy criteria, aerosol deposition areas, shape factors, aerosol source parameters, geometry parameters
for junctions and zones, heat transfer coefficient, leak size, etc. The number of size classes was varied
between 5 and 10. The state of the knowledge about the parameters was expressed by subjective
probability distributions and the correlations between the selected parameters.
A parameter sample of size 100 was generated with randomly selected parameter values as input and the
FIPLOC code was run for each. The 100 results (Fig. 6.3-2) along with the parameter form the data basis
from which all subsequent uncertainty and sensitivity statements were derived.

NEA/CSNI/R(2009)5
285
Fig. 6.3-2 Aerosol concentration in the dome compartment
100 time histories obtained with FIPLOC for randomly selected parameter vectors
At the end of the calculation 0.2 kg of the injected 8.91 kg SnO
2
are still airborne. The two side (90 %,
90 %) tolerance limits are 0.07 kg and 0.49 kg. The aerosol mass released to the environment is 0.29 kg
with the tolerance limits 0.1 kg and 0.63 kg. A large amount was released early in the experiment. This is
the reason why this uncertainty range is not broader than that of the total aerosol although large
uncertainties of parameters for the leakage path and the gas pressure are involved.
The uncertainty of the total airborne aerosol mass depends on a few uncertain aerosol parameters:
−
Dynamic and agglomeration shape factors
−
Turbulence dissipation rate
−
Number of size classes
−
Aerosol injection rate
The uncertainty of the aerosol injection rate influences only the short term aerosol results.
The uncertainty of the released aerosol mass depends on the uncertain aerosol parameters:
−
Leakage parameters (cross section area, flow resistance number)
−
Dynamic and agglomeration shape factors
The results confirm the expected high ranking of the main contributors to uncertainty from aerosol
modelling and reveal the importance of uncertainties in thermal hydraulics for computed aerosol
behaviour.
NEA/CSNI/R(2009)5
286
Aerosol problem at wet conditions
The test LACE LA4 was carried out in the 852 m³ CSTF-vessel. A hygroscopic CsOH aerosol and an
insoluble MnO aerosol were injected with overlapping release periods. During the whole test steam was
released. Steam condensation on the hygroscopic CsOH aerosol component was higher than on the MnO
aerosol which resulted in a more rapid CsOH aerosol removal. In the FIPLOC calculation used for the
study the component behaviour and the hygroscopic effect were simulated. The analytical results were in a
good agreement with the experimental values.
For the purpose of the uncertainty and sensitivity analysis 58 uncertain parameters were identified.
At the end of the calculation (t = 20000 s) 1.4·10
-6
kg/m³ of the injected CsOH are still airborne. The two
side (90 %, 90 %) tolerance limits are 2.3·10
-9
kg/m³ and 3.25·10
-5
kg/m³. At the same time 1.2·10
-5
kg/m³
MnO are still airborne. The two side (90 %, 90 %) tolerance limits for the MnO concentration are 2.5·10
-8
kg/m³ and 1.02·10
-4
kg/m³.
The uncertainty of CsOH and MnO aerosol concentrations depends on a few uncertain aerosol parameters:
−
Average diameter of the injected particles
−
Kelvin effect regarded (yes / no)
−
Numerical approach of droplet growth (steady state / dynamic)
−
Feedback of hygroscopic effect on thermal hydraulics (yes / no)
The average diameter is an input parameter. Its range for variation was relatively wide (factor 10) because
of a lack of experimental information. The other parameters steer model alternatives for the condensation
calculation available in FIPLOC. Owing to this study recommendations for the use of the option were
given.
References
[1] J. Langhans, H.G. Friederichs, E. Hofer, B. Krzykacz, B.M. Schmitz, G. Weber Unsicherheits- und
Sensitivitätsanalyse zum Aerosolmodell in FIPLOC-M, Teil 2: Nasses Aerosolverhalten im
LACE-Experiment LA4 GRS-A-2217 (1994)
[2] E. Hofer, B. Krzykacz, L. Langhans, G. Weber Uncertainties and Sensitivities in Aerosol
Calculations – An Analysis of a FIPLOC-M Application to the Experiment VANAM M2
PSAM II-Conference, San Diego, 20 – 25 March 1994
[3] J. Langhans, H.G. Friederichs, E. Hofer, B. Krzykacz, G. Weber Unsicherheits-und
Sensitivitätsanalyse zum Aerosolmodell in FIPLOC-M, Teil 1: Trockenes Aerosolverhalten im
VANAM-Experiment M2 GRS-A-2183 (1994)
[4] E. Hofer Probabilistische Unsicherheitsanalyse von Ergebnissen umfangreicher Rechenmodelle
GRS-A-2002, GRS Garching (1993)
NEA/CSNI/R(2009)5
287
7. SOURCE TERM CALCULATIONS IN PLANT APPLICATIONS
7.1 MELCOR Calculation for a US American PWR (Station Blackout Scenario)
To illustrate the effects aerosol processes have on the radioactive material available for release over the
course of an accident, an example calculation of the progression of a severe accident in a pressurised water
reactor is presented here. The analysis was done with the MELCOR computer code. The hypothesized
accident is a Station Blackout at the Zion nuclear power plant. This nuclear facility is a four-loop
pressurised water reactor in a large, dry containment. A diagram of the reactor and its containment is
shown in Fig. 7.1-1. For the purposes of this illustration, attentions are focused on the behaviour of
radioactive cesium released from the fuel. Times in the various figures shown here are based on the time of
accident initiation. The accident progresses with the reactor coolant system pressurised at about 155 bar
until core debris penetrates the reactor vessel at about 4.3 hours following accident initiation. The
temperature, pressure and relative humidity of the containment over the course of the accident are shown in
Fig. 7.1-2. Note that the relative humidity of the containment atmosphere is high only during the early
period of the accident when coolant is being boiled from the reactor coolant system. There is a modest
upward excursion in the relative humidity following vessel failure. Otherwise, the containment humidity is
fairly low and water condensation on aerosol particles is not expected to be significant.
Core uncovery, fuel cladding rupture and the beginning of cesium release from the fuel occur at about
3.7 hours. The inventories of cesium released from the fuel and residing in the core region, upper core
internals, hot leg, and one of the steam generators are shown as functions of time in Fig. 7.1-3. Cesium is
present in these various regions as vapor, aerosol and materials deposited on surfaces in the region. The
abrupt drop in the cesium inventories at about 4.4 hours is caused by the depressurization of the reactor
coolant system when core debris penetrates the reactor vessel and flows into the reactor cavity. Airborne
cesium present as vapor or aerosol in the various volumes is vented to the containment during
depressurization. The version of the MELCOR code used for these calculations does not predict
resuspension of deposited particulate during the depressurization.

NEA/CSNI/R(2009)5
288
Fig. 7.1-1 Diagram of the containment for the Zion reactor. Dimensions are in English units.
Conversions are: 9 ft. = 2.74 m; 140 ft. = 42.7 m; 212 ft. = 64.6 m

NEA/CSNI/R(2009)5
289
PWR Station Blackout
Time (hours)
0 20406080100
Relative Humidity
0.0
0.2
0.4
0.6
0.8
1.0
PWR Station Blackout
Time (hours)
0 20406080100
Containment Pressure (MPa)
0.0
0.2
0.4
0.6
0.8
1.0
1.2
1.4
1.6
PWR Station Blackout
Time (hours)
0 20406080100
Containment Temperature (K)
280
300
320
340
360
380
400
420
440
460
480
Fig. 7.1-2 Conditions in the reactor containment curing a station blackout accident
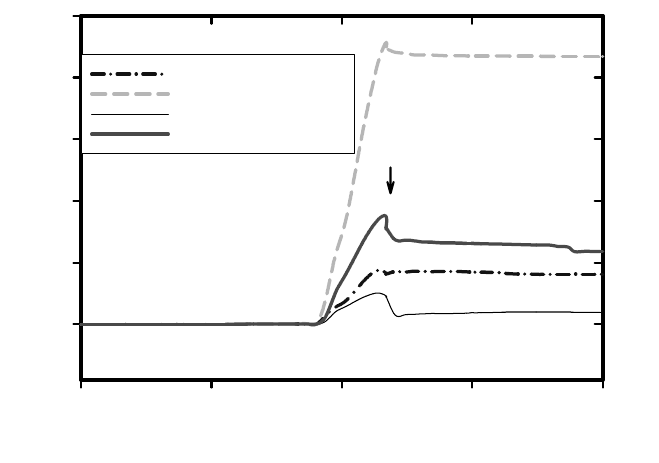
NEA/CSNI/R(2009)5
290
Time (hours)
23456
Cesium Mass (kg)
0
10
20
30
40
50
Cs in core region
Cs in upper internals
Cs in Hot Leg
Cs in Steam Generator
Vessel
Depressurization
Fig. 7.1-3 Cesium within the reactor coolant system early in the accident
Comparison of the amounts of cesium present in the regions before and after depressurization provides an
indication the fraction of cesium present as airborne material present as either vapors or aerosol.
Most of the cesium in the core region and in the upper internals of the reactor vessel is predicted to be
deposited on surfaces. The model predicts the cesium will react to form compounds such as cesium silicate
as observed on upper core internals in the accident at Three Mile Island. In contrast to this, the model
predicts that much of the cesium in the hot leg remains in the gas phase.
Cesium in the reactor containment is shown in Fig. 7.1-4. Following core uncovery and the onset of cesium
release from the fuel, there is only a slow rise in the containment inventory of cesium. This comes from the
venting of the reactor coolant system to the containment through the safety relief valves. The cesium
inventory of containment rises abruptly when core debris penetrates the reactor vessel and the reactor
coolant system depressurises. Depressurization is complicated by the discharge of the accumulators when
system pressure falls below about 44 bar. Any cesium that remains in the reactor fuel expelled from the
reactor vessel is released during core debris interactions with concrete following vessel failure. (About
10 % of the cesium inventory was found to remain in degraded reactor fuel from the Three Mile Island
Accident.) There is a continuing discharge of fuel and some cesium from the vessel after depressurization
as residual fuel from the peripheries of the core heats and melts.

NEA/CSNI/R(2009)5
291
Time (hours)
23456
Cesium Mass (kg)
0
20
40
60
80
Cs in core region
Cs in upper internals
Cs in Hot Leg
Cs in Steam Generator
Cs in containment
Fig. 7.1-4 Cesium in containment in comparison with cesium in reactor coolant system
Most of the very dynamic events of the accident have ended about 17 hours after accident initiation. But,
as shown in Fig. 7.1-5, the cesium inventory of the containment continues to rise for about 60 hours after
accident initiation. The increasing containment inventory comes from the revaporization of cesium
deposited on surfaces within the reactor coolant system. Revaporization occurs because the surfaces are
heated by both convection and by decay heating so that cesium compounds on the surfaces have significant
vapor pressures. Convective flow through the reactor coolant system sweeps these vapors into the
containment which is cool enough to condense the vapors and form aerosols. The progression of
revaporization can be seen most clearly in Fig. 7.1-6 which shows the cesium inventory in one of the steam
generators as a function of time. Revaporization of cesium (and other radionuclides) from surfaces in the
reactor coolant system recharges the containment atmosphere with radioactive aerosol to replace, in part,
material lost from the atmosphere by aerosol deposition processes. For this particular reactor and accident
sequence, the deposition of aerosol from the containment atmosphere is dominated by gravitational
deposition to upward facing surfaces.

NEA/CSNI/R(2009)5
292
Cesium in PWR Station Blackout Accident
Time (hours)
0 102030405060
Cesium Mass (kg)
0
20
40
60
80
Fig. 7.1-5 Cesium in the reactor containment
Cesium Revaporization
PWR Station Blackout
Time (hours)
0 10203040
Cesium Mass (kg)
0
2
4
6
8
10
12
14
16
18
20
Revaporization
Vessel Depressurization
Fig. 7.1-6 Cesium revaporization from the steam generator
The aerodynamic mass median diameter of aerosol particles in the containment atmosphere is shown in
Fig. 7.1-7. The aerosol in the containment has an approximately lognormal size distribution. The geometric
standard deviation of the size distribution is shown in Fig. 7.1-8. The median size of the aerosol particles
goes through a wild excursion following vessel rupture. Large amounts of radioactive and nonradioactive
mass are injected into the atmosphere by both depressurization of the reactor vessel immediately and for a
protracted period by core interactions with the limestone concrete of the reactor basemat. Mass median

NEA/CSNI/R(2009)5
293
particle diameters exceed 5 µm at the peak. Over the longer term, aerosols in the containment atmosphere
have mass median diameters between 2 and 3 µm. The geometric standard deviation of the aerosol size
distribution is not so variable. Typical values are between 2.1 and 2.4 throughout the accident. Episodic
excursions in these values may reflect hydrogen combustion events taking place in the atmosphere.
Time (hours)
0 20406080
Aerodynamic Mass Median Diameter (
µ
m)
0
1e-6
2e-6
3e-6
4e-6
5e-6
6e-6
Fig. 7.1-7 Aerodynamic mass median diameter of aerosol particles in containment atmosphere
Geometric Standard Deviation
Time (hours)
0 20406080
Geometric Standard Deviation (-)
0.0
0.5
1.0
1.5
2.0
2.5
3.0
Fig. 7.1-8 Geometric standard deviation of aerosol in containment atmosphere

NEA/CSNI/R(2009)5
294
This example calculation for a pressurised water reactor makes it clear that there can be abundant
opportunities for radionuclides released from the reactor fuel to deposit within the reactor coolant system.
Revaporization of these deposited radionuclides is an important consideration in the prediction of the
inventory of radionuclides available for release to the environment should there be a major loss of
containment integrity. Aerosol physics is quite dynamic especially in the early stages of the accident when
large amounts of particulate material are injected into the containment atmosphere. Without intervention
by engineered safety features such as containment sprays, the period over which significant containment
inventories of airborne, radioactive aerosol exist can be quite long - certainly in excess of 24 hours.
7.2 ASTEC Calculation for a German PWR (MB LOCA Scenario)
Introduction
The severe accident sequence of a medium break LOCA (200 cm² leak in the hot leg of the main coolant
line) in a German PWR with 1300 MWe (KONVOI type) was analysed with ASTEC V1.2 rev1. The plant
application sequence from the opening of the leak until vessel rupture, corium slump into the cavity and
MCCI was investigated. FP, aerosol and iodine transport phenomena in the circuit to the leak until the
release into the containment and the transportation within the containment have been considered.
Input model for a German PWR 1300 MWe
The investigations have been carried out for a typical German PWR with 1300 MWe. The 4 loop plant
with U-tube steam generators has been modelled with one single loop containing the pressuriser and the
break and one triple loop. The break is situated between the reactor pressure vessel and the surge line
connection (Fig. 7.2-1).
single loop
Konvoi 1300 MW
Nodalization for ASTEC
triple loop
Fig. 7.2-1 ASTEC V1.21 nodalisation scheme of primary circuit with break in hot leg

NEA/CSNI/R(2009)5
295
The containment (Fig. 7.2-2) is subdivided into two nearly symmetrical parts. Exceptions concern the
central situated compartments for sump, cavity, reactor well and dome. They are not further subdivided.
Smaller rooms and for example staircases are combined and added to the adjacent rooms. The equipment
compartments in the lower part of the containment are modelled by eleven volumes and the operational
compartments in the upper part by nine volumes.
20
OBKUPPEL
18
KUPPELA
11
OPERA
10
UPERA
21
RRUNTEN
22
RRMITTE
23
RR
OBEN
12
UPERB
5
DH
HKPB
4
HKPA
19
KUPPELB
13
OPERB
FILTER
24
ENVIRON
16
UKUPA
17
UKUPB
8
DEOBOXA
9
DEOBOXB
7
DEMBOXB
14
RRAUM
CAVITY
3
PKLB
1
SUMPF
1
SUMPF
2
PKLA
6
DEMBOXA
A
TMOS_JU
RUPTURE
DRAIN_BOT
Fig. 7.2-2 ASTEC V1.21 containment nodalisation
The annulus is divided into 3 volumes. A virtual volume with time independent and constant boundary
conditions represents the environment. Existing connections between the compartments within the
containment are combined considering the selected arrangement of the volumes.
In the course of the accident the free convective flow area between the equipment compartments and the
operational compartments is determined by the failure of a discrete number of rupture diaphragms in the
steam generator towers (red arrows). For the connections in the missile protection wall equipped with burst
devices a sequential failure was modelled.
There is no containment spray installed in this type of PWR. The condensate discharge from the different
compartments into the sump is modelled by a special type of connection. Initial conditions for all
compartments of the containment are: 30 °C for gas and wall temperatures, a relative humidity of 50 % and
a total pressure of 1 bar. The catalytic recombination of hydrogen is performed by the use of 18 catalytic
boxes. The carrier gas, generally a steam-hydrogen mixture, transports released species through the reactor
coolant system. The transportation of the fission products is calculated with the ASTEC module
SOPAEROS. The purpose of the SOPHAEROS code is the numerical simulation of FP transport and
deposition in light-water reactor circuits during a severe accident involving significant core degradation
due to loss of primary coolant. The transportation path in the case of the 200 cm
2
leak in the cold leg leads

NEA/CSNI/R(2009)5
296
through the upper plenum (UPPL), a vertical volume situated above the core (see Fig. 1) and in the single
loop via the hot leg (B_HL1) to the leak.
Description of the severe accident sequence
With the opening of the 200 cm² leak in the hot leg at the beginning of the accident a fast depressurisation
occurs and the water level in the core decreases. Water and steam are released into the containment. The
emergency feeding systems inject water into the loops until the water supply is empty. Switch over to
sump suction is assumed to fail and core heat up begins. The steam generators are in hot standby. At
5612 s core degradation with fission product release starts. The fuel cladding begins to burst; relocation
and melting occur, and at 6721 s the first lateral corium slump takes place. A pool of molten material is
built up in the vessel lower head and the temperature escalation beyond 1200 °C causes a failure of the
vessel wall at 20868 s. The following molten corium concrete interaction (MCCI) is investigated until the
end of calculation at 50000 s. For MCCI no aerosol release is calculated as at present there is no reliable
model for aerosol release from molten corium pools mixed with concrete available in ASTEC.
Containment thermal hydraulics during MBLOCA
In the beginning of the accident the containment pressure raises up to 2.9 bar due to the blow down via the
break (Fig. 7.2-3) and drops with the feeding of the emergency systems. During dry out and core
degradation phase the pressure rises up to 2.5 bar. The temperatures in this phase are in the range of 100 °C
to 150 °C (Fig. 7.2-4) except for the break room where high temperature peaks can be observed. The
corresponding humidity is shown in Fig. 7.2-5 The relative humidity in the compartments of the
containment is high during the phase of accident, where a large amount of coolant is injected. After this
period the humidity decreases. Only some compartments, e.g. PKLA (see Fig. 7.2-5), show a level of
humidity that reaches 80 % which possibly could lead to hygroscopic effects on aerosol particles. But in
this calculation hygroscopic effect were not taken into account.
PWR1300 ASTEC V1.21
0 5000 10000 15000 20000 25000 30000 35000 40000 45000 50000
time
(
s
)
(
ASTEC V1.21, CPA, c
p
a
p
res.DSGN
)
0
0.5
1
1.5
2
2.5
3
3.5
Absolute Containment Pressure ( MPA )
OBKUPPEL
Fig. 7.2-3 Pressure in the containment

NEA/CSNI/R(2009)5
297
PWR1300, 200cm2-Leak in HL, ASTEC V1.21
0 5000 10000 15000 20000 25000 30000 35000 40000 45000 50000
time
(
s
)
(
ASTEC V1.21, DIVA, ztem
p
.ds
g
n
)
0
100
200
300
400
500
Temperature in the Contaiment
OBKUPPEL
UPERA
OPERA
KUPPELA
PKLA
Fig. 7.2-4 Temperature distribution between the break room (PKLA) and the dome (OBKUPPEL)
PWR1300, 200cm2-Leak in HL, ASTEC V1.21
0 5000 10000 15000 20000 25000 30000 35000 40000 45000 50000
time
(
s
)
(
ASTEC V1.21, CPA, relhum.DSGN
)
0
20
40
60
80
100
Relative Humidity ( % )
PKLA
OBKUPPEL
KUPPELA
Fig. 7.2-5 Relative humidity between the break room (PKLA) and the dome (OBKUPPEL)
Aerosol distribution in the loop
During the core degradation a total aerosol mass of 1280 kg is generated. Fig. 7.2-6 shows the
evolution of the aerosol deposition. At the late phase of the core degradation shortly after 17200 s the
deposited aerosol mass concentration in the upper plenum (UPPL) suddenly turns to very low values
typical for a mechanical resuspension process. A sudden release of steam from the core caused by a large
slump of corium at this time point leads to a significant increase in the carrier gas velocity in the upper
plenum. The wall temperature in the upper plenum increases at the same time to about 670 °C which is

NEA/CSNI/R(2009)5
298
about the boiling point of Cs. Under these conditions a part of the deposited aerosol is mechanically
resuspended and the other part is revaporated.
Fig. 7.2-7 and Fig. 7.2-8 show the particle size distribution of the aerosol in the upper plenum and the hot
leg volume with the break shortly before and after resuspension / revaporisation. At about 17200 s the
aerosol deposited in the upper plenum is resuspended and transported via the hot leg to the containment.
The resuspended aerosol contains a large fraction of coarse particles.
Fig. 7.2-6 Evolution of deposited aerosol mass concentration in volumes 1 and 2
Fig. 7.2-7
Particle size distribution in the upper plenum and the hot leg (break position) at 17012 s

NEA/CSNI/R(2009)5
299
Fig. 7.2-8 Particle size distribution in the upper plenum and the hot leg (break position) at 17512 s
At 17512 s the aerosol size distributions in the upper plenum respectively in hot leg become quite similar
indicating the end of the short resuspension period. The slight differences remaining between the particle
size distributions after the resuspension are due to different geometries in the two volumes.
The sudden aerosol release by resuspension / revaporization increases the aerosol concentration in the
break room and other volumes in the containment.
Fig. 7.2-9 shows that thermophoresis (THERMOPH) is the most effective mechanism for aerosol retention
in the upper plenum. Only at about 6000 s there is also some retention of particles deposited by inertia
effects from turbulent gas flows (TURBINER). In the adjacent horizontal pipe volume B_HL1 additionally
a small contribution to the particle deposition by impaction in bends and settling is calculated.

NEA/CSNI/R(2009)5
300
Fig. 7.2-9 Retained aerosol fractions according to different deposition mechanisms in UPPL
Aerosol in containment
From the total aerosol mass generated during the in-vessel phase a large amount of 817 kg reaches the
containment because the leak is located in the hot leg close to the upper plenum. The steep incline and the
depletion of aerosol concentration in the different containment compartments are shown in Fig. 7.2-10. The
black curve is the aerosol concentration in the break room. The concentration peaks are caused by the
material release during the corium slumping. Due to the rupture of the burst devices shortly after break
opening (see 7.2.2) the released aerosol is rapidly distributed in the containment by atmospheric flows.
However differences between the local concentrations persist during the whole sequence.

NEA/CSNI/R(2009)5
301
PWR1300, 200cm2-Leak in HL, ASTEC V1.21
0 5000 10000 15000 20000 25000 30000
time (s) (ASTEC V1.21, DIVA, sumaero.dsgn)
0.00010
0.00050
0.001
0.005
0.01
Total Aerosol Concentration( kg/m**3 )
OBKUPPEL
UKUPB
DHHKPB
DEMBOXB
PKLA
SUMPF
Fig. 7.2-10 Total aerosol concentration in different compartments
Fig.7.2-11 displays the mass median diameter (MMD) of the aerosol in the break room PKLA. The MMD
peak values are due to the aerosol releases during slumping. The MMD increases slightly by agglomeration
till 20000 s and decreases due to the enhanced deposition of the larger particles afterwards.
PWR1300, 200cm2-Leak in HL, ASTEC V1.21
0 5000 10000 15000 20000 25000 30000 35000 40000 45000 50000
time
(
s
)
(
ASTEC V1.21, DIVA, mass
_
median.ds
g
n
)
0
5.00e-007
1.00e-006
1.50e-006
2.00e-006
2.50e-006
3.00e-006
Mass Median Diameter (m)
OBKUPPEL
UPERA
PKLA
Fig.7.2-11 Mass median diameter in different compartments
Fig. 7.2-12 shows the particle size distribution in the break room before (17026 s) and after (17512 s)
arrival of the aerosol released by resuspension / revaporization in the upper plenum.

NEA/CSNI/R(2009)5
302
5.
00E-
08
7.31E-08
1.
07E-
07
1.56E-07
2.
2
9E-07
3.34E-
07
4.89E-07
7.15E-
07
1.05E-06
1.
53E-
06
2.24E-06
3.
27E-
06
4.78E-06
6.
99E-
06
1.02E-05
1.50E-05
2.
19E-
05
3.20E-05
4.
68E-
05
6.84E-05
1.E-12
1.E-11
1.E-10
1.E-09
1.E-08
1.E-07
1.E-06
1.E-05
1.E-04
1.E-03
Aerosol Concentration (kg/m³)
size (m)
Aerosol Concentration in Zone PKLA
17026 s
17512 s
Fig. 7.2-12 Aerosol size distribution in the compartment PKLA at 17026 and 17512 s
Fig. 7.2-13 depicts in more detail the deposited aerosol mass in three different compartments. Since
volumes and deposition areas are different the deposited masses cannot be compared directly. The high
amount of aerosol on the walls is deposited by diffusiophoresis as consequence of the significant wall
condensation. In two compartments (DHHKPB and DEMBOXB) the deposited aerosol mass is reduced by
wash down with draining condensate after 12000 s. Most of this aerosol mass is transported into the sump.
In Fig. 7.2-14 the deposited aerosol mass is shown for different volumes including the sump. The highest
amount of aerosols is continuously built up in the sump caused by aerosol wash down. At the end of the
calculation about one fourth of the containment aerosol has been washed down into the sump.

NEA/CSNI/R(2009)5
303
PWR1300, 200cm2-Leak in HL, ASTEC V1.21
0 5000 10000 15000 20000 25000 30000 35000 40000 45000 50000
time
(
s
)
(
ASTEC V1.21, DIVA, deptot.ds
g
n
)
0
10
20
30
40
Aerosol Deposition in Zones ( kg)
DHHKPB vert_walls
DHHKPB floor
UKUPB vert_walls
UKUPB floor
DEMBOXB vert_wall
DEMBOXB floor
Fig. 7.2-13 Aerosol deposition in different zones on floor and vertical walls
PWR1300, 200cm2-Leak in HL, ASTEC V1.21
0 5000 10000 15000 20000 25000 30000
time (s) (ASTEC V1.21, DIVA, CUMTOT.dsgn)
0.01
0.05
0.1
0.5
1
5
10
50
100
500
1000
Deposited Aerosol Mass (kg)
OBKUPPEL
UKUPB
DHHKPB
DEMBOXB
PKLA
SUMPF
Fig. 7.2-14 Deposited Aerosol mass in different compartments
Conclusions
Generation and behaviour of the nuclear aerosol in the primary circuit and the containment during a core
melt accident in a German PWR was analysed consistently with ASTEC. In this integral
multi-compartment calculation all relevant interrelations between aerosol and other phenomena like
thermal-hydraulics were considered. It is shown that aerosol processes in the primary circuit like
resuspension and revaporization influence the local aerosol concentrations in the containment directly. This
calculation indicates a rather homogeneous distribution of the suspended aerosol in the containment.

NEA/CSNI/R(2009)5
304
7.3 Aerosol-Related Uncertainties in the Prediction of Severe Accident Source Terms
In the 1990s two research projects supported by the EU examined the impact of various phenomenological
uncertainties on the prediction of plant severe accident source terms. In the STU project, reported in the
archival literature in [1], experts from a consortium of utilities, engineering consultancies and research
organisations investigated 13 processes probably occurring in severe accidents, selected on the grounds of
relevance to typical sequences and their impact on off-site risk. Eight European reference plants were
examined with respect to 23 sequences taken from recent PSA studies, with selection criteria taking into
account phenomenology, absolute frequency and contribution to risk. Basing their views on literature
surveys and in-house plant analysis, the experts considered severe accident processes both from the point
of view of their uncertainty, ranging from high, meaning too difficult to model or poorly understood, to
low, signifying modelled in a detailed way with adequate validation, and from the point of view of their
sensitivity. Processes judged to be highly sensitive were (naturally) those expected to have a significant
impact on the source term. In turn, a significant impact was taken to mean one where the predicted source
term to the environment or containment exceeded a threshold fraction of the core inventory and the
variation traceable to the phenomenological uncertainty under study exceeded half an order of magnitude
for the volatile elements (noble gases, Cs, I, Te) or an order of magnitude for the less volatile elements
such as Ru, Ce and Pu. This set of criteria was intended to be a generally applicable surrogate for the
category “large release” in use in several European countries.
The processes and their significance ratings are to be found in [1]. Processes of relevance to NARSOAR are
summarised in Table 7.3-1 below. Significance varies with the sequence examined, and a practical grouping of
the sequences was arrived at by the experts on the basis of containment failure (early or late), with or without
natural and engineered retention mechanisms, and a separate category for bypass sequences.
Table 7.3-1 Sensitivity of the source term to the environment, by aerosol-related processes and
sequence category. Bold type indicates the strongest sensitivity
Containment sequences Bypass sequences
Early containment failure Late failure
no retention retention retention no retention retention
Vapor and aerosol
transport and retention
in the primary circuit
Volatiles
Volatiles
Iodine only
Behaviour of non-
fission product materials
Iodine only
Low-volatile releases
from in-vessel pools
Involatiles
Involatiles
Low-volatile releases
from MCCI
Involatiles Te only
Aerosol behaviour in the
containment
Late revaporisation Volatiles
Pool scrubbing
Volatiles &
involatiles
Volatiles &
involatiles
Release route and failure
mode effects
Volatiles &
involatiles
Volatiles &
involatiles
Volatiles &
involatiles
NEA/CSNI/R(2009)5
305
The absence of a phenomenon from a particular cell in the table does not indicate that it is not
important for the source term, but rather that the present status of its modelling is such that residual
uncertainties do not have a significant impact on the uncertainty of the release to the environment.
In
practice the modelling considered when assessing the uncertainty of a process was that of the versions of
MAAP and MELCOR current at the time, although more specialised codes were also considered or applied
in specific cases. Sensitivities were judged from the results of PSA2 studies on plants including BWRs,
3-and 4-loop PWRs, KONVOI and the VVER-440/213 PWR.
Some of the conclusions reached within this project merit re-examination within the NARSOAR writing
group or more widely within the CSNI structure. Examples are the safety importance of the late release of
involatiles from in-vessel pools (and by analogy, from deposits within the core and the above-core
structure), the importance of pool scrubbing for bypass sequences, and the low safety importance ascribed
to uncertainties in the behaviour of aerosols within the containment.
In a follow-up study (OPTSAM, 2000-2002), a similar group of European experts made an extensive study
of severe accident management measures (both engineered safety features and operating procedures) for a
range of plant types in current operation in Europe and for risk-dominant accident sequences. The full
results of OPTSAM have not yet been published, and the information provided here is based on the project
summary report [2]. It was concluded that none of the measures examined would worsen the source term to
the environment.
For example, operation of recombiners, where installed, would always be beneficial, The obvious caveat is
that the validity of this conclusion is limited by the validation status of the models implemented in the
codes used in the sequence calculations (MAAP and MELCOR) and the former status of knowledge. As
example for the increased of knowledge the present RECI findings (see chapter 5.10.5) are mentioned here.
References
[1] M.L. Ang, E. Grindon, L.M.C. Dutton, P. Garcia-Sedano, C.S. Santamaria, B. Centner, M. Auglaire,
T. Routamo, S. Outa, J. Jokiniemi, V. Gustavsson, H. Wennerstrom, L. Spanier, M. Gren, M.-H.
Boschiero, J.-L. Droulas, H.-G. Friedrichs, M. Sonnenkalb A risk-based evaluation of the impact of
key uncertainties on the prediction of severe accident source terms - STU. Nuclear Engineering and
Design 209 (2001) 183-192
[2] M.L. Ang, E. Grindon, C.S. Santamaria, B. Centner, M. Auglaire, T. Routamo, F. Bertels, V.
Gustavsson, L. Spanier, M. Sonnenkalb, J.-L. Droulas, J. Duspiva, G. Horvath Optimisation of
severe accident management strategies of the control of radiological releases - results of study for
eleven reference plants (OPTSAM). Final Summary Report, 2002
NEA/CSNI/R(2009)5
306
NEA/CSNI/R(2009)5
307
8. IDENTIFIED OPEN ISSUES (INCLUDING RECOMMENDATIONS)
8.1 Introductory Remarks
Safety-related issues for current and near-future generations of LWRs have been reviewed several times
within the OECD framework. A relatively recent list of identified issues and research recommendations is
to be found In the proceedings of the OECD Workshop “Nuclear Aerosols in Reactor Safety” in Cologne,
June 1998 [1]. These are addressed point-by-point in Appendix 5 while, here, updated identified issues and
recommendations are presented; some unavoidable duplication exists between this section and Appendix 5.
Concerning the
reactor circuit the 1998 workshop identified as issues:
•
uncertainties in calculated thermal-hydraulics as they impact vapor and aerosol transport;
•
deposition in singularities such as valves and bends;
•
thermal-hydraulics and deposition in flow across steam generator tube bundles;
•
modelling and assessment of the safety relevance of resuspension and revaporisation of circuit
deposits.
Concerning the
reactor containment the 1998 workshop singled out:
•
validation of models for aerosol removal by sprays;
•
possible further removal mechanisms such as turbulent impaction and charge effects (suggested
by Phébus FP results at that time);
•
potential impact of hydrogen recombiners on aerosol depletion rates as well as chemical effects;
•
effect of hydrogen burns on aerosol composition and atmospheric chemistry including the
production of volatile forms of iodine;
•
uneven level of detail in pool scrubbing models may not satisfy safety tolerances for all
conditions;
•
re-entrainment from boiling pools, possibly important for off-site releases.
In addition to investigation of the issues listed the Workshop also recommended:
•
holding a meeting on the use of severe accident codes in plant calculations for source term
estimation, including codes used by utilities within the following two years;
•
in view of the intensive research into nuclear aerosols then prevailing, the writing of a SOAR on
aerosol behaviour in the primary circuit and containment.
Following the mandate from the CSNI this last recommendation has finally been fulfilled in the present
report. It takes into account the outcomes of the major experimental and analytical programmes that have
been completed or are still in progress, and has identified the issues with associated recommendations
which are contained in the sections which follow.
NEA/CSNI/R(2009)5
308
8.2 Generic Issues
8.2.1 Code-users’ workshop on plant analysis
Circuit thermal-hydraulics are important for vapor and aerosol transport in the circuit. Extensive code
comparisons in the EC projects EVITA [3] and under continuation in the EC network SARNET [4] have
identified significant thermal-hydraulic differences in supposedly similar plant calculations and helped
increase understanding of their causes. To fully explain differences in the results from different codes and
users requires a deep understanding of the modelling and numerical approaches within each code and of
the choices made by the user. Such evaluations are time consuming but necessary and should be continued
in future with more involvement of utilities and vendors. Chapters 6 and 7 of this report are intended to
reinforce the international discussions on this topic.
More generally, the CSNI workshop recommended in 1998 that a meeting on the use of
severe-accident codes in plant calculations for source term estimation, including codes used by utilities, be
held. More than eight years after formulation of this recommendation it has still not been acted upon. There
remains a need to harmonise user practices with respect to plant analyses in order to reduce divergence in
results. The objective would ideally be to produce online “best practice” guidelines for the major codes.
8.2.2 Shape factors
The models describing aerosol dynamics have been traditionally developed for spherical, fully dense
particles. Dynamic and agglomeration (collision) shape factors are introduced into the aerosol physics
equations to describe the dynamics of non-spherical particles.
Real particles of a nuclear aerosol in the primary system or the containment are seldom either fully dense
or spherical. So-called primary particles may agglomerate to form fractal structures but vapors condensing
on them can change their shapes. Only at a very high humidity or with steam condensation in the bulk do
the particles become spherical (droplets). Some evidence exists that particles in accident conditions (i.e.,
prototypical multi-component source, different vapors having condensed at different temperatures, etc.)
would not form the branching structures familiar from carbonaceous smoke; however, information is
particularly sparse for aerosols in the containment (see Appendix 1). Information that is contradictory to
this can be found but arises from less-representative experiments (see Appendix 2).
The importance of shape factors is demonstrated, for example, in a comprehensive uncertainty and
sensitivity analyses for a coupled thermal hydraulic and aerosol calculation of the dry aerosol test
VANAM-M2 [2]. The main contributors to the uncertainty of the calculated aerosol concentrations were
the dynamic and agglomeration shape factors in addition to, e.g., the turbulent dissipation rate and the
number of particle size classes.
A comprehensive theory of aerosol shape factors does not exist. The theory of dynamic shape factors,
which can be checked in a measurable way, is more advanced than the theory of agglomeration shape
factors. Understanding of dynamic shape factors is based on experiments with aerosols formed from pure
vapors. In reactor accidents multi-component aerosols formed from complex vapors are expected. A fitting
("back calculation") of shape factors is not recommended.
The influence of shape factors may be larger in accident scenarios involving large parts of the containment
with a rather low humidity. Some parametric source term calculations for such scenarios could be
performed but the difficulty is knowing what constitutes “reasonable” variation of the shape factors. Only
if the impact of shape factors on the overall results is significant are further investigations justified from
the point of reactor safety. The real requirement is further characterization of representative particles
NEA/CSNI/R(2009)5
309
where, as a minimum, measurement of two diameters such as aerodynamic diameter and
volume-equivalent diameter provides access to the dynamic shape factor.
8.2.3 Computational fluid dynamics codes
CFD treatment of flow phenomena in the reactor coolant circuit and the containment is becoming more
common and CFD methods are growing in power. Although the entire plant is presently not simulated with
CFD tools - mainly because of the immense effort required for grid preparation, the incompleteness of the
codes with regards to reactor-safety-specific models and tremendous calculation times - selected
components under well-defined boundary conditions are becoming amenable to CFD analyses. The first
applications for full containments have just been published. Today's CFD methods have the capability to
describe effects that are difficult or impossible to predict reliably with the classical lumped-parameter
approach, e.g., local inhomogeneous gas distributions in rather small volumes or hydrogen combustion
processes. Because of the more detailed knowledge of the flow field, certain aspects of the study of
fission-product transport should also be improved. CFD codes have for example been applied to simulate
aerosol transport in small scales such as the PHÉBUS FP circuit and containment (but without any
possibility to compare the code calculations with local measurements absent from these integral tests).
Even if transport and depletion of aerosols are described reasonably by experienced users using adequate
options of lumped parameter codes (where these propose comprehensive and well-validated modelling
with regard to this issue), there seems to be serious limitations of this approach for so-called complex
structures such as exist in parts of the circuit, both sides of heat exchangers and paths resulting in
containment leakages.
At present there are efforts being made towards using CFD codes to simulate particle transport and
deposition in steady conditions in complex reactor structures (as part of the simulation or as a post-test
exercise). Broadly, Lagrangian treatment of deposition with industrial CFD codes may provide reliable
predictions in laminar flow regimes. In turbulent regimes, uncertainties are introduced by the limitations
inherent in the flow-field turbulence modelling. In any case, it is advisable to resort to the best (and most
computationally intensive) turbulence models, such as the Reynolds Stress Model. In addition, modelling
turbulence-particles interactions in the framework of CFD requires using data either from experiments or
Direct Numerical Simulation computations, both of which are rather difficult and scarce for complex
geometries. Thus more work needs to be done before CFD treatment of particle behaviour in complex
turbulent flows becomes satisfactorily accurate.
Finally, it is indispensable to compare the benefit with regard to reactor safety to the effort needed to
obtain reliable results using CFD. The scientific aspect needs no discussion.
8.3 Reactor Coolant System Issues
8.3.1 Mechanical resuspension
The safety impact of aerosol resuspension in the primary circuit is both design- and scenario-dependent,
and must be evaluated case by case. It does not appear that existing resuspension models are adequate for
this purpose. Resuspension was the focus of ISP-40 and studies of the phenomenon have continued both in
general and with a nuclear safety objective. The majority of the nuclear safety studies use simulants. Some
limited information on circuit resuspension is also available from the PHÉBUS-FP programme in which
the deposits are representative in character. Theoretical and experimental investigations both in pipe
geometries and in tube bundle geometries have demonstrated that the resuspended mass for a given
geometry and given flow conditions is sensitive to the deposit’s mass loading, particle size distribution,
chemical composition and structure, this last parameter being in turn a function of the conditions under
NEA/CSNI/R(2009)5
310
which the deposit was laid down, whether by settling, thermophoresis, turbulent impaction etc. or a
combination of such mechanisms. Current deposition models do not however predict the deposit structure,
e.g., its porosity. For the purposes of resuspension modelling this is a deficiency which requires attention.
Resuspension models exist which are able to take account of the porosity of the deposit, but they are not
yet fully developed or validated. Unlike the resuspension models implemented in current safety codes such
models also aim to predict the size distribution of the resuspended clusters, a parameter important for the
prediction of its subsequent transport and deposition. The further development of such models deserves
encouragement.
Up to now all the work on resuspension has focused on the resuspension due to an increase in flow. Shocks
and vibrations, especially in conjunction with flow increases can exacerbate resuspension in ways that are
not well understood. These phenomena are expected to be prevalent in reactor accident scenarios, and one
needs therefore to address them individually as well as in combination with flow acceleration.
Little experimental or theoretical work has been done on the resuspension of wet deposits or of deposits
which have become wet and have then dried in situ. It is recommended that scoping analyses be performed
to assess the potential impact on source terms of the differing resuspension behaviour of dry and wetted
aerosols.
Finally, it has to be said that the consequences for a severe accident of a light-water reactor due to
resuspension from the RCS varies depending on the scenario, i.e., bypass or non-bypass sequences.
Resuspension occurs due to the steam spike generated by the core collapsing into remaining water in the
reactor vessel, an event occurring close in time to the peak release of fission products. Hence, for
non-bypass sequences, the influence of this resuspension on the potential source term may well be
insignificant within a few hours. However, improvement of resuspension modelling with respect to bypass
sequences is clearly very desirable.
8.3.2 Deposition in singularities and complex structures
No significant advances appear to have been made since 1998 in the experimental investigation or the
modelling of deposition in singularities such as changes in cross section or bends. Some code
improvements have been made by including the best-available models from published literature.
Regarding deposition in complex structures, progress has been made with respect to the secondary side of
steam generators (SGs). While the last decade has seen considerable efforts to understand degradation
processes that can lead to SG tube cracking, wall thinning and potentially rupture as well as to develop
improved modes of operation and preventative and corrective measures, the SG tube leakage incidents that
occurred rather frequently in the past prove that such events cannot be completely ruled out. Steam
generator tube rupture (SGTR) accidents are, however, design basis accidents so measures are in place to
cope with them: for the 11 known incidents the plants concerned coped.
A leakage of radionuclides from the primary circuit into the secondary side negates the purpose of the
containment. Under certain conditions high release of radionuclides to the environment is possible during
postulated severe accidents. Risk assessment studies generally consider two types of severe accidents:
− an operational event or design basis fault that causes a SGTR which then results in core damage;
− a core damage sequence which might impose pressure and temperature conditions that could lead to
SGTR.
NEA/CSNI/R(2009)5
311
Most probabilistic risk assessments (PRAs) and severe-accident codes assume that a significant fraction of
fission products flowing through a non-isolated break in a SG escapes to the environment. For example, in
NUREG 1150, the median estimate (based on expert opinion) of the fraction of the core inventory of
iodine released to the environment was 27 %, and the 95th
percentile estimate was 80 %.
SGTR was the first European project (2000-2002) to improve understanding in a systematic way of
possible retention mechanisms in tubes and in the complex structures of the secondary side of a SG. In
particular, the PSAERO and HORIZON experiments from Finland were conducted to study in-tube
retention whereas retention in the SG bundle has been investigated in PECA-SGTR and the ongoing
ARTIST experiments (respectively in Spain and Switzerland) – see §5.10.1. In addition, certain modelling
efforts to develop a correlation for the retention in the bundle were initiated.
Thorough interpretation of the data from the above experiments is incomplete and modelling efforts
continue. It is expected that the main issues regarding SGTR will be answered after termination of these
activities.
8.3.3 Particle break-up in highly turbulent flows
Highly turbulent flow inside a tube may induce break-up of particles due to (i) impaction on the walls, (ii)
strong shear in the flow or (iii) the vena contracta and shock wave at the tube exit. This phenomenon was
observed, e.g., in Phase I of the ARTIST tests as well as in supplementary experiments [5]. Two types of
aerosol materials were used in ARTIST Phase 1: TiO
2
particles that were loosely-packed
(low-coordination) agglomerates comprising primary particles of approximately 20-40 nm in diameter or
spherical SiO
2
particles. TiO
2
agglomerates had an AMMD of approximately 2-5 µm at the tube inlet but
were reduced to sub-micron-sized particles at the tube exit; the SiO
2
particles did not break up in the tests.
Clearly, these results indicate a possibility of particle break-up during SGTR sequences. However, to
determine whether aerosol particles may break up in severe accidents would require more information on
the structure and the nature of the bonding forces between primary particles for severe accident aerosols as
well as for the TiO
2
agglomerates used in ARTIST Phase I. In Phébus tests, which produced more
prototypical aerosols, SEM micrographs showed fairly compact, sintered agglomerate structures unlike the
ARTIST TiO
2
particles. Consequently, intra-particle forces can be expected to be higher in reality than in
these TiO
2
agglomerates. Nevertheless, the issue is of some importance since the generation of submicron
particles from supramicron ones leads to less-efficient retention of the aerosols concerned. In the first
instance, accident sequences other than SGTR inducing highly-turbulent flows need to be identified;
comparison of plant calculations without and with (assumed) break-up for SGTR and the other pertinent
sequences would then allow evaluation of the risk relevance of the break-up phenomenon. If the risk
impact is significant then, in the absence of appropriate data for severe accident aerosols, data for
prototypical particles are needed in highly-turbulent accident-relevant conditions.
8.3.4 Influence of chemistry
The fundamental importance of chemistry is well established given its direct influence on many
phenomena of high significance to prediction of source terms arising from potential severe accidents (e.g.,
nucleation/condensation, chemisorption, revaporization, etc.). Probably most critical in terms of safety
consequences is the decisive impact of chemistry for a given FP on the split between the gas/vapor fraction
and condensed phases (aerosol and condensates). Broadly, a lower-volatility species for a given FP
presents a lower hazard due to its greater propensity to be trapped on a surface (structure or filter) rather
than be released into the environment.
As described earlier in this report, nuclear-safety codes model chemical reactions using the thermodynamic
equilibrium approach where codes use empirical or estimated thermodynamic data for each chemical
NEA/CSNI/R(2009)5
312
species covered. The uncertainties associated with these data vary greatly and are often large especially
with respect to estimated data. Furthermore, divergence between data series originating from different
sources can be considerable. It can be said that, for many species and some very important systems,
uncertainties associated with the data can only be reduced by further analytical experiments. While there
seems to be little prospect presently of new experimental work producing better data, it is recommended
(as is being done for the ASTEC code) that the thermochemical data used by codes are thoroughly verified
and completed with identification of key sources of uncertainty.
Beyond the thermodynamic approach to chemistry, commonly accepted to be valid at high temperature
(i.e., roughly, in the reactor vessel and the hot leg), at intermediate and lower temperatures some reaction
rates become comparable to or slower than convection rates. The ensuing non-equilibrium state as the flow
progresses downstream will not be predicted by the equilibrium approach. While the importance of this
modelling deficiency for severe accidents may be high, it has to be recognised that sufficient rate data will
never be available for development of comprehensive kinetic models. So, while the thermodynamic
approach is pragmatic, it probably encounters significant limitations when addressing accident scenarios
involving secondary-side or cold-leg conditions and is inappropriate in the containment. In this context it
becomes important to do three things:
− assess the value of the simplified approach of stopping chemical reactions in the RCS below a
user-supplied cut-off temperature (ASTEC/Sophaeros and VICTORIA codes) where PHÉBUS FP
results with respect to iodine in the RCS should prove to be very useful;
− follow closely experiments, e.g., the French CHIP programme, investigating reaction rates for some
of the iodine system;
− assess whether important FP species other than molecular iodine, reaching the containment in the
vapor phase, require kinetic modelling at the circuit breach. This is an especially important issue
with respect to hot-leg and high-pressure sequences where vapor fractions at the RCS breach will be
significant and quenching of reactions may occur leaving highly volatile species in the gas phase
(e.g., ruthenium tetroxide, hydrogen iodide).
Lastly, the effects of radiolysis in the RCS are unknown. It may well produce significant quantities of
radical and exotic species unpredicted by thermodynamic and/or kinetic models alone. Radiolysis may
have little impact in the core region (temperatures being so high that only simple atomic and radical
species exist), but may be important in cooler regions of the RCS involving significant deposits (high local
dose rate) such as in a cold-leg sequence. In terms of direct consequences for aerosols, one effect will be
reduction of the threshold super-saturation at which vapors nucleate since a high density of
electrically-charged condensation nuclei will form. In terms of consequences for the source term, the
meagre state of knowledge renders even qualitative evaluation difficult.
8.3.5 Revaporisation of deposits
Studies on revaporisation with Phébus FP and simulant samples were undertaken in the EC 4th Framework
Programme projects RVP and REVAP-ASSESS. Based on these studies and the evaluation of PHEBUS FP
results themselves the knowledge of revaporization has significantly increased. It has been shown to
significantly influence transport of volatile fission products compounds in the RCS to the containment
during core degradation. In addition, plant calculations indicate that revaporisation can be a potential
long-term source of fission products to the containment. Currently further studies of revaporisation with
samples from PHEBUS FP experiments are on-going. In addition, release of volatile fission product
compounds due reactions on the primary circuit surfaces is carried out in EXSI project within the
SAFIR2010 programme. Lastly, in the frame of SARNET programme, one technical circle is dedicated to
NEA/CSNI/R(2009)5
313
sharing information on revaporisation. Only after termination of these evaluations can it be decided what
additional work might be necessary.
Experimental work on revaporization remains scarce; further theoretical and experimental developments
are necessary to understand the revaporization process. In addition, the safety relevance ought to be further
demonstrated by assessing, conceivably, the impact of a weak source of fission products from the reactor
coolant system for some hours after the main release-from-core phase.
8.4 Containment Issues
8.4.1 Charge effects
Small deposits of aerosols on the outer walls of the 10 m
3
containment vessel in the PHÉBUS test FPT0
could not be explained by electrophoretic effects as shown in an IRSN study (and while this study was
made available to the PHÉBUS partners it did not lead to further studies). However, even if charge effects
on aerosol deposition are not seen to be significant in test facilities (with or without a radiation field) there
is no firm evidence that this effect would be negligible in an accident. At present there is no consensus
among experts on whether further investigations of charging effects are necessary or not.
8.4.2 Mixed aerosols in condensing atmospheric conditions
Although there has been considerable progress in modelling aerosol deposition as a function of relative
humidity, a comparison of the adequacy of code results from ISP 37 and ISP 44 indicate that there is still
some work to be done to ensure satisfactory coupling between thermal hydraulic and aerosol models so
that these capture correctly aerosol behaviour in most environments. An additional uncertainty in
modelling aerosol behaviour in the containment in highly humid conditions arises from determining the
hygroscopicity associated with a mixture of aerosols of different compositions. Both the PHÉBUS tests
and the KAEVER experiments suggest that an average aerosol particle composition and size might be
attained in containment. There is still an uncertainty related to the density of multi-component aerosols.
Uncertainty analyses (see Chapter 6.4) based on experiments with well-defined material do not show that
the density is of central importance. However, this has to be confirmed for accident conditions with a wide
variety of aerosol components. The KAEVER experiments further suggest that this average particle would
behave like the most hygroscopic of its individual components. Confirmation of these findings, in a
large-or intermediate-scale experiment performed under saturated conditions might significantly simplify
modelling aerosol behaviour in wet conditions.
The impact of steam condensation on aerosols is accelerated depletion of suspended material in the
containment and so is beneficial in terms of an accident. In this respect, to implement new models for
steam condensation on aerosols in the Canadian code SMART and to ensure adequate coupling between
thermal hydraulic input (GOTHIC) and aerosol modelling, additional data relevant to this design are
required (notably from experiments using a CANDU-representative aerosol composition where, unlike for
PWRs, control-rod material is not expected to be a major component). Some CANDU relevant data are
available from experiments in the KAEVER, AHMED and VANAM facilities, however additional data
under higher bulk-condensation rates is required. Large-scale experiments (1650 m
3
) are planned at AECL,
funded by the CANDU Owner's Group, to characterize aerosol formation in a condensing steam
environment to obtain the additional data needed for Canadian model development.
8.4.3 Mechanical resuspension
Compared with deposits in the primary system, deposits in the containment are likely to feature
significantly lower surface loadings and be widely distributed over walls and floors. Depending on the
specific reactor, the accident scenario and the deposit location, the particles may undergo exposure to both
NEA/CSNI/R(2009)5
314
wet and dry atmospheres, as well as flows of surface water. Resusupension of the deposits is possible as a
consequence of a sudden breach of containment and/or a hydrogen burn. Subsequently a portion of their
radiological burden may thus be transferred to other parts of the plant or to the environment.
A limited number of specific investigations on resuspension in the containment have been performed.
These have been confined to dry deposits and indicate that resuspension is quite easily induced in
simulated containment deposits by sudden increases of flow. In particular an experimental study concluded
that the flow disturbance created by hydrogen burns efficiently resuspends containment deposits.
Therefore, in addition to probabilistic studies to evaluate the safety significance of containment
resuspension, it is recommended that experimental studies be performed on the resuspension behaviour of
real or simulated deposits at containment-typical loadings, particularly under flow disturbances, as a
function both of the composition of the deposit and of the deposit history (dry, wet, wet then dried in situ
etc.). New experimental investigations are being performed on resuspension under flow conditions caused
by real hydrogen deflagrative combustion in the ThAI facility.
8.4.4 Re-entrainment from pools
Re-entrainment of particulate fission products will occur at several water and core melt pools during a
severe accident. The release rates of radiological materials are relatively small but the sources are
persistent. A significant contribution to the source term by re-entrainment is possible in the late accident
phase. However, reliable analytical investigations including risk relevant aspects do not exist yet. Few
codes are able to simulate, with some restrictions, the FP release from boiling or flashing sumps.
Re-entrainment models need further improvements especially in the bubbly flow regime and in the
transition regime to churn turbulent conditions. The size distribution of the entrained droplets should be
described.
Up till now the main experimental investigations have been either small scale (e.g., the KWU tests and the
REST tests) or medium scale (e.g., the REVENT tests). Large-scale tests were performed in the ThAI
facility recently in order to improve the model RECOM which will be integrated into COCOSYS. The
ThAI results show in particular that the size of the released aerosol particles is significantly smaller than
those reported for earlier tests.
Up to now all re-entrainment tests including ThAI have been made with relatively ideal systems with
different concentrations of soluble and insoluble materials but without surfactants and impurities.
Therefore, tests in realistic conditions are still necessary.
After improvement and validation of re-entrainment models for realistic conditions is achieved reliable
accident calculations to quantify the effect of re-entrainment from boiling pools on the source term will be
possible. In the light of these results it may be desirable to investigate measures reducing the release of
fission products by re-entrainment.
8.4.5 Pool scrubbing
Some BWR and PWR severe accident scenarios involve transport paths of radioactive aerosols which
include passages through fixed pools of water where particles (and vapors) can be retained. Therefore, this
phenomenon, known as pool scrubbing, has the potential to reduce the source term. The extent of this
mitigating effect would be a function of prevailing conditions, such as aerosol characteristics, water depth,
pool sub-cooling and gas hydrodynamics, as well as the longer-term evolution of the radioactive material
retained in the water.
NEA/CSNI/R(2009)5
315
By the mid-1990s, a good number of experimental programmes had addressed the pool scrubbing issue and
a set of computer codes (i.e., SPARC90, BUSCA and SUPRA) were developed and partially validated.
However, these tools have not been updated with respect to additional experiments carried out in the last
decade of the 20th century. Most of the earlier available data concerned essentially gas jet injection and hot
pools. The most recent investigations have demonstrated that decontamination by bubble formation and
equilibration in a water pool can be significant, both in BWR and PWR risk-relevant sequences.
Hydrodynamic models in different codes are remarkably different both in their approach and in the results
they provide (i.e., bubble size and shape); several hydrodynamic phenomena are not modelled in codes or
are dealt with using highly-specific empirical correlations (i.e., jet injection, primary bubble rupture,
churn-turbulent flow and bubble oscillations and deformations) and these are probably important to
accurate prediction of aerosol retention in risk-relevant scenarios. We add that particle size heavily
influences the pool decontamination capability so uncertainties in this parameter also have to be
considered.
Pool scrubbing has been considered to be well investigated since results provided by stand alone models or
modules of integral codes provide satisfactory integral retention with respect to regulatory requirements.
However, there are insufficient available data for systematic validation under all relevant conditions.
Aspects hardly explored to date include: removal of aerosols during the formation of bubbles or globules
and the subsequent hydrodynamic processes (i.e., bubble disintegration and coalescence) and the effects of
submerged structures interfacing with the incoming gas flow and of contaminants (surfactants) in the
aqueous bulk.
8.4.6 Removal by sprays
This issue has been extensively investigated by the French organisations CEA and IRSN using specific
apparatuses and the CARAIDAS, MISTRA and TOSQAN test facilities. The data should be made
accessible to the nuclear community, at least the OECD partners. Validated modelling based on these
experimental investigations has been implemented in the codes ASTEC and TONUS. The ASTEC model
can be found in the open literature. Further work on containment sprays is low priority for countries that
have access to this data but in other countries and for certain advanced designs it remains important to
establish effective removal by spray systems and both experimental and analytical efforts continue.
8.4.7 Influence of recombiners
Phenomenological experiments have demonstrated that there is potential for PARs to generate volatile
forms of iodine, namely molecular iodine, by thermal decomposition of metal-iodide species that would be
present in containment aerosols. It is likely that such chemical conversions will be reproduced in
accident-representative conditions but initial (limited) results from relevant experiments indicate high
mitigation of this molecular-iodine production. It has also to be recognised that iodine may not be the only
fission product concerned, e.g., some formation of the highly volatile species ruthenium tetroxide might be
possible in the conditions expected within PARs though no investigation of this has been performed.
Furthermore, scoping calculations have shown that such a conversion process even when very limited
might make a non-negligible contribution to the gas-phase iodine in the containment atmosphere. Further
experimental investigations in realistic conditions (mixed-aerosol and mixed-atmosphere composition) are
necessary.
8.4.8 Hydrogen-burn effects on suspended aerosols
Heat release by hydrogen burns may have a strong effect on aerosol characteristics as a result of the
thermal-hydraulic transient and could possibly liberate volatile forms of iodine. Experiments in the ThAI
NEA/CSNI/R(2009)5
316
facility demonstrate that there is a clear effect of hydrogen-combustion-induced flows on resuspension of
already deposited CsI aerosol. Initial source-term calculations for plant conditions show an increase of
airborne aerosol of up to one order of magnitude. Assuming a small leak in the containment of 0.01 m
2
,
the
released aerosol mass increases by a factor of 4, in the case of a global containment failure, by a factor of
10. These findings have to be expanded to consider other types of relevant aerosol species and other plant
applications. However, chemical effects on iodine-containing aerosols have not been studied; information
from the ongoing investigation of the impact of recombiners on aerosols may be relevant.
8.4.9 Release from MCCI pool
The behaviour of aerosols formed following releases from a molten corium concrete pool was notably
investigated in the late 1980s and early 1990s in the frame of the ACE phase C tests and the BETA tests
(from which the ISP 30 should especially be mentioned). In parallel, models such as VANESA were
developed along with approaches using thermodynamic equilibrium codes such as SOLGASMIX or
ChemSage to calculate release of fission products. Summarizing the results of these efforts it can be said
that uncertainties remained high and the predictive capability remained poor.
Some investigations of molten-corium concrete interactions were started again some years ago, e.g., within
the OECD Melt Coolability and Concrete Interaction project, but there is no work related to aerosols. In
addition there have been two projects (LPP and MP within recent EC Framework Programmes) in which
the release from molten corium pools was investigated for in-vessel pool conditions, i.e., without concrete.
As far as an accident is concerned, from the experimental data it can be said that MCCI is likely to add a
large amount of non-active aerosol material (constituents of concrete and structural materials) to the
containment atmosphere in the size range of the existing aerosols. This will promote agglomeration and
diversification of the aerosol composition and increase settling of the already-suspended aerosols.
In terms of modelling needs with respect to aerosols, it can be assumed that transport, deposition and
resuspension of aerosols caused by MCCI can be adequately treated by the same aerosol modelling
elaborated for aerosols coming directly from the RCS. The uncertainty arises with respect to the release
and formation mechanisms of such MCCI aerosols where these were describe in §3.9. The relevant
parameters are:
a) the type of concrete, e.g., calcareous or siliceous;
b) the progress of the concrete erosion process in time being responsible for
− the temperature of the magma
− the generation rates for vapors and gases, e.g., CO, CO2, H2 and H2O, leading to sparging;
c) aerosol nucleation due to vapors from the free upper surface of the magma and within gas bubbles
leaving the pool
d) mechanical aerosol production when bubbles burst at the pool surface.
In this context with, in particular, no significant activity in this area at present, the following steps seem
necessary in the near future:
−
recalculation of the older tests mentioned above using current models (for processes b) and c), in
order to check progress in relation to, e.g., the thermodynamic aspects; if these models perform
satisfactorily then more reliable estimates of quantities of aerosols produced in an accident can be
produced;
NEA/CSNI/R(2009)5
317
−
synthesis of the information on the characteristics of MCCI-generated aerosols; conventional
(non-nuclear) knowledge of concrete aerosols may of use;
− review of the applicability of the EC projects MP and LPP where some of these tests included a
significant silica component.
8.4.10 Penetration through leak paths
From the review of available databases, models in the open literature and ongoing research within
SARNET on dry aerosol transport in cracks, the recommendation can be made that both separate-effect
and integral tests should be performed:
•
separate-effect tests should provide a detailed characterization of the mechanisms involved and
they would contribute to model development and to detailed validation;
•
integral tests should focus on measuring overall process variables, e.g., the mass retained, and
would provide a database for checking overall model performance.
Investigations regarding the influence of boundary conditions should focus in particular on the hydraulic
diameter and curvature of the path, the fluid composition and pressure drop, wall temperature, and aerosol
size, obviously as close as feasible to actual scenarios. Concerning particle size, great emphasis should be
placed on submicron particles, around 0.1 to 0.3
μm, as they would largely contribute to the release.
Although there are some deposition models that have been developed for dry aerosol retention in leak
paths, these may not be applicable to wet aerosol behaviour since aerosol characteristics such as particle
shape, and deposit characteristics (fluid rather than solid) could cause somewhat different behaviour. Wet
aerosols (droplets containing suspended or dissolved fission products) are more prevalent than dry aerosols
in most postulated design-basis CANDU accident scenarios.
The wet aerosol experiments performed at AECL indicate that there is significant aerosol transport through
single leak path contractions representative of airlock door seals and isolation damper valves in CANDU
containment. Taking into consideration the Japanese findings mentioned in chapter 5.10.3
recommendations regarding this process are:
•
Further experiments are required to characterise aerosol transport through sequential expansion
and contraction regions representative of the leak path from containment to the outside
atmosphere during a postulated accident scenario;
•
Additional experiments are also required to evaluate the extent of leak-path plugging at higher
aerosol mass densities that could be anticipated during the containment over-pressurization
period in a CANDU accident scenario.
8.4.11 Fire aerosols
Fires in a nuclear power plant can threaten the safety of the plant and initiate a severe accident. Cable fires
are of most concern compared to other possible fires.
Cable fires can produce an enormous amount of aerosol which is quite corrosive. Fire aerosols can cause:
(1) equipment damage, (2) aerosol filter plugging, and (3) contamination of passive autocatalytic
recombiners (PARs). In case of core degradation the fire aerosol will interact with the nuclear aerosol. The
depletion behaviour of the nuclear aerosol will be changed. Organic components of the fire aerosol will
react with certain iodine species, e. g. to form organic iodides.
NEA/CSNI/R(2009)5
318
Only little is known on the amount of aerosols produced from fires and their properties (particle size
distribution, shape factors). There is a need for further experimental investigation of fire aerosols
especially from cable fires. This could be done in a future step of the OECD PRISME and/or the Sandia
CAROLFIRE projects. The aerosol production rate, the particle size distribution and the shape factors are
of main concern. Existing multi-component aerosol models should be extended in order to simulate the
interaction of fire aerosols with a present nuclear aerosol. Of special interest is the mixing process of
probably branched-chain fire aerosols with core-generated aerosols affecting their depletion behaviour.
8.5 Concluding Remarks
At the time when the previous state of the art report on circuit aerosols was written (1994) the plant
analysis codes, as distinct from the special-purpose research tools, were relatively crude, and their
experimental support only partial and largely confined to tests using simulant materials. Since that time
substantial progress has been made. While still using lumped-parameter descriptions of the
thermal-hydraulics, systems codes now include more complete calculation of gas-phase chemistry and
chemical interactions with particles and surfaces in the primary circuit, and a better treatment of coupling
between aerosol dynamics and thermal-hydraulics in the containment.
The limited accuracy and resolution of the calculated thermal-hydraulics are now constraining the
reliability of aerosol predictions in some special cases. Models are available for the aerosol physics in a
number of components such as suppression pools in BWRs and the complex structures on the secondary
side of the steam generator in PWRs, as well as for retention in engineered safety features.
The experimental database supporting such codes and models has benefited from more accurate and
extensive instrumentation covering a wider range of phenomena, e.g., able to measure airborne water in
containment experiments. More experimentation on specific phenomena, e.g., resuspension,
revaporisation, trapping in complex structures, etc., has been performed where some of this is ongoing.
Large-scale and small-scale containment aerosol experiments have been performed and some have been
analysed in international programmes, notably the KAEVER tests. Most significant on the experimental
side is perhaps the availability of integral experiments on fission-product release and transport using a
degrading-fuel and control-rod bundle as the source, viz. the PHÉBUS FP programme. The PHÉBUS FP
tests have had a strong impact on our understanding of nuclear aerosols, particularly in the circuit, where
now for certain scenarios we are better informed, for instance, with respect to particle sizes, shapes and
compositions whereas in the past all these quantities could only be estimated. PHÉBUS has also been able
to provide information helpful to modellers on specific phenomena, e.g., revaporisation.
A large number of PSA2 plant studies has been performed around the world, frequently involving aspects
of aerosol behaviour, but rather few of them have been published or even summarised in the open
literature. The aerosol community is, therefore, not always fully briefed on the risk-relevance of the
numerous phenomena and processes currently under study.
Although large strides have been made in our understanding and application of the physics and chemistry
of nuclear aerosols, their study is by no means over. Aerosol-related experimental programmes such as
ARTIST and ThAI are either still in progress or their analysis is incomplete. The PHÉBUS FP series of
integral experiments is now terminated but post-test analyses are not complete, and the code-based
interpretation of the results continues. Conclusions drawn from the PHÉBUS FP results are at this stage
necessarily provisional. The experiments did not attempt to cover the full range of conditions encountered
in plant severe-accident scenarios and it remains a challenge to extrapolate from the limited aerosol data
available to, e.g., aerosol emissions and transport in high-pressure scenarios.
NEA/CSNI/R(2009)5
319
It is expected that increasingly stringent safety standards in combination with new generations of power
reactors will continue to produce aerosol-related safety questions and that to meet the ongoing challenge
both experimental expertise and analytical tools supported by the know-how to use them intelligently will
need to be maintained. The aerosol-related computational and modelling development now underway to
tackle industrial problems and major environmental issues such as climate change is producing a body of
knowledge which should be integrated with that built up within the nuclear-safety community. The CSNI
structure appears well suited to developing structures and mechanisms for stimulating such
cross-fertilisation.
The question of risk importance deserves a more concerted effort, in aerosol physics as in other relevant
fields. This report has included some examples of plant analyses coupled with sensitivity studies to reveal
the impact of aerosol-related processes and parameters, but this only scratches the surface. A rational
assessment of risk importance requires the investigation of more designs and their accident scenarios with
associated probabilities, and of sensitivity to models as well as to parameters.
References
[1] H.-J. Allelein Third OECD specialist meeting on nuclear aerosols in reactor safety GRS-166,
NEA/CSNI/R(98)4, ISBN 3-931995-31-3, June 1998
[2] J. Langhans, H.G. Friederichs, E. Hofer, B. Krzykacz, G. Weber Unsicherheits-und
Sensitivitätsanalyse zum Aerosolmodell in FIPLOC-M, Teil 1: Trockenes Aerosolverhalten im
VANAM-Experiment M2 GRS-A-2183 (1994)
[3] H.-J. Allelein et al. EVITA - European validation of the integral code ASTEC Final report of the
project FIKS-CT-1999-00010 (5
th FwP), 1999
[4] H.-J. Allelein, K. Neu, J.P. Van Dorsselaere European validation of the integral code ASTEC
(EVITA) - First experience in validation and plant sequence calculations, Nuclear Engineering and
Design, August 2004
[5] Y. Ammar (2008). Agglomeration and break-up of aerosols in turbulent flows. Ph.D. thesis,
University of Newcastle, UK.
NEA/CSNI/R(2009)5
320
NEA/CSNI/R(2009)5
321
LIST OF APPENDICES
Appendix 1:
On the characteristics of aerosols arising during a severe accident of a water-cooled reacot
Appendix 2:
Aerosol Shape Factors
Appendix 3:
Spray Modelling Developed from Recent Analytical Work
Appendix 4:
Complete filter contribution of Güntay
Appendix 5:
Point-by-Point of Issues Identified at the 1998 Aerosol Workshop
NEA/CSNI/R(2009)5
322

NEA/CSNI/R(2009)5
323
9. APPENDIX 1: Characteristics of Aerosols under LWR Severe Accident Conditions
9.1 Context
The behaviour of an aerosol particle can depend strongly not just on classic properties such as aerodynamic
size but on properties that are microscopic involving internal structure and composition (where these are
not necessarily independent parameters)
10
. A concern is that the role of structure and composition is
particularly pertinent to situations of strong differential forces on the particle such as during impact with a
surface or in flows involving intense shear. Particle deposition can be highly sensitive in the former
situation by leading to, e.g., capture of the particle on the surface or its break-up and re-entrainment in the
form of a number of fragments. With respect to the latter situation, evidence of particles breaking up due to
intense shear has recently been observed in high-velocity flow tests of the ARTIST programme [1]. This is
not an isolated example of this behaviour, e.g., see [2, 3]. Evidently, particle break up may have significant
safety implications where it is a question of easily-trapped supra-micron particles fragmenting to produce
sub-micron ones for which trapping is less efficient
11
.
In this report, information on aerosol characteristics from prototypical experiments (i.e., those producing
aerosols from over-heated irradiated fuel) is reviewed in order to identify common features and typical
variations. For completeness, both aerosols in the reactor coolant system (RCS), i.e., relevant to an
experiment such as ARTIST, and the containment are dealt with though, it must be said, information on
these latter particles turns out to be quite limited. Subsequent effort will need to be devoted to detailed
consideration of whether interparticle bonding forces within prototypical and non-prototypical
agglomerated particles are comparable. This aspect could be resolved relatively simply by calculating Van
der Waal’s forces between primary particles, e.g., [4], and estimating the bond structure (the so-called
internal co-ordination) of the agglomerates from images of prototypical particles and the non-prototypical
ones used in experiments. However, given the complex composition of core-melt-produced aerosols (see
below), major difficulties arise from the heterogeneity of primary-particle composition and, potentially,
chemical reactions at points of contact.
9.2 Review of Available Information
A search for literature providing information on aerosols produced in prototypical, severe-accident
conditions shows public-domain information to be rather meagre. Three principal sources have been found
for particles relevant to the RCS and only one (PHÉBUS PF) with respect to the containment.
10
It should be understood that we are dealing here with the general, realistic case of agglomerated, compound particles as opposed
to uniform, single-substance ones.
11
Another implication that arises concerns experiments: given that particle composition and structure can have safety implications,
an experiment not using prototypical particles and involving high impact velocities and/or intense shear may not produce aerosol
behaviour representative of what would happen in an accident. This report can also serve as an initial step in the process of
assessing the use of non-prototypical particles in nominally representative experiments performed in severe-accident conditions.

NEA/CSNI/R(2009)5
324
9.2.1 Aerosols in the RCS
The information reviewed excludes experiments with significant non-prototypical features, these being
typically a flawed source (e.g., low temperature, incomplete or uncertain inventory) and injection of only
inert gas. The following experiments constitute the best information available where the focus here is not
on particles close to their point of formation (for which, in any case, there is virtually no information) but
more in relation to hot leg conditions, i.e., after some amount of conditioning (cooling, further
condensation of vapors, agglomeration) where particle evolution is less rapid.
9.2.1.1 AECL
Mulpuru [5] performed small-scale experiments on Zircaloy-clad CANDU fuel samples heating them to
and holding them at 1860 K in a flowing steam-rich atmosphere at ambient pressure. CANDU fuel has a
typical end-of-life burn-up ≤ 8GWd/tU. Apart from the cladding, no structural materials relevant to LWRs
were present in the furnace. Thermal-hydraulic boundary conditions are not well-known between the
specimen and the exit of the furnace tube where temperature (of the gas, presumably) dropped to 380 K
and, schematically, is indicated to have remained at this level up to and including the aerosol sampling
zone. In this zone aerosols were collected during four distinct phases: during heat up then during three one-
hour periods at the hold temperature of 1860 K. The four sequential systems comprised thin platinum wires
for individual SEM
12
(size) and WDX
13
(elemental composition) analysis with the outflow from these
proceeding downstream to a common filter.
The experimenters conclude that spherical particles of around 0.1 to 0.3 µm formed (though their
composition was not established) then these agglomerated giving rise to a mixture of compact particles
between 0.1 and 3.0 µm in size at the point of measurement. The composition of the particles was found to
be dominated by Cs, Sn and U: while the Cs and Sn mass contributions remained constant and very similar
in mass, U was relatively minor in the first hour at 1860 K evolving to be the main contributor in the third
(very approximately: 42 % U, 26 % Sn, 33 % Cs). Neither break down of composition by particle size nor
statistical size information was measured.
9.2.1.2 PBF-SFD
Information is available from analyses of aerosols produced during the most prototypical test of the
large-scale PBF programme, test SFD 1-4, [6, 7]. The test comprised a bundle of 28 Zircaloy-clad fuel rods
(of which 26 with an average burn-up of 36 GWd/tU) with 4 stainless-steel-clad Ag-In-Cd control rods.
The presence of 4 control rods leads, according to the authors own figures, to a higher-than-normal
proportion of control-rod alloy, e.g., a ratio of 3.5 higher than was the case for the TMI-2 core. The
Zircaloy content was also somewhat high, around 6 kg as opposed to nearly 15 kg of UO
2
. With pressure
fixed at 6.9 MPa and the bundle immersed in water, a flow of water at 0.6 g.s
-1
was injected while bundle
nuclear power was increased. Nowhere is it stated that the initial or injected water was borated and it must
be presumed that it was not. During a one-hour transient, dry out and extensive degradation occurred with
peak temperature thought to have reached nearly 3100 K. Vapors and aerosols were transported along a
line initially heated to 800 K descending to ~600 K in the aerosol sampling zone (no steam condensation).
SEM was used on deposits on a specific deposition structure over a 2 m distance starting about 0.3 m
above the bundle. This analysis, concerning only (seemingly) individual particles, gives no statistics on the
size distribution and, being post-test, can be misleading given that particles may have agglomerated upon
deposition. The SEM analyses showed some very large particles, 25-250 µm, on horizontal surfaces. More
12
Scanning electron microscopy.
13
Wavelength dispersive X-ray.

NEA/CSNI/R(2009)5
325
interestingly, while impactors were not used (and, consequently, no possibility of quantitative information
on composition as a function of aerosol size), large variation in deposit composition is seen at the same
axial location depending on whether the deposition surface was vertical (in the direction of the flow) or
horizontal. In terms of the structural elements and volatile fission products at the 0.6 m elevation, Table
9.2-1 provides the details. It can be inferred that, over the duration of the test in this zone, significant
variation in aerosol composition occurred where larger particles (favouring settling and inertial deposition
due to changes of geometry) contained a very high cadmium fraction whereas smaller particles were far
more heterogeneous in composition. Since thermophoretic deposition is relatively insensitive to size if
particles are not very small, and since gas-to-coupon temperature difference is seen to be between 20 and
70 °C at this elevation during the period of release (Figure 38 of [6]), it can be argued that the
vertical-surface deposit occurred mainly due to thermophoresis and that its composition can be considered
representative of that of the overall suspended aerosol at this location.
Further interesting measurements for purposes here were six isokinetic, sequential, filtered samples located
about 13 m from the bundle outlet. These were used to follow the evolution of the aerosol composition and
to examine particle size (SEM). Based on these analyses the authors state that particle geometrical-mean
diameter varied over the range 0.29-0.56 µm (elimination of the first filter due to it being early with respect
to the main transient gives the range 0.32-0.56 µm) while standard deviation fluctuated between 1.6 and
2.06. In the images of filter deposits needle-like forms are seen. Turning to composition, if the first filter
sample is eliminated and “below detection limit” is taken as zero, for the structural components and
volatile fission products we have in terms of percentages the values given in Table 9.2-1.
Lastly, it should be noted that no data are provided on uranium release; though a very low release in
fractional terms such a release is potentially very significant in terms of absolute mass. It might be
concluded that the release was below detection limits since the range of analysis techniques applied-which
included alpha analysis - ought to have measured any significant U in deposits (though the authors do not
state this explicitly). Furthermore, the test conditions at high temperature comprising the low
water-injection rate and the metal-rich bundle led to full reduction of the steam during most of the transient
as measured downstream of the bundle (§5.2.1 of [6]). This total starvation, probably occurring from the
hottest point in the bundle upwards, would have been unfavourable to uranium release from the bundle.
Table 9.2-1 Aerosol composition (%) in terms of the measured elements (NB: data for In are not shown
due to being below detection limits
14
location position/time
Ag Cd Sn Zr volatile FPs
0.6 m vertical surface 0.2 8.3 44.2 13.3 34.0
horizontal surface 0.5 75.1 0.3 0.2 24.0
13 m
2040 s (filter 2) 1.9 6.2 75.9 3.9 12.0
2100 s (filter 3) 1.4 27.9 39.5 2.6 28.6
2385 s (filter 4) 1.6 24.2 36.3 0 37.9
2850 s (filter 5) 1.2 13.3 39.9 0 45.6
3060 s (filter 6) 3.9 12.5 29.7 2.4 51.5
14
Compilation of this table relies on Table VI of [5] which provides the volatile-FP content. Data in that table have been taken as
mass percentages since molar percentages would imply even higher contributions of volatile FPs given that the other principal
contributions arise from Cd and Sn.
NEA/CSNI/R(2009)5
326
9.2.1.3 PHÉBUS FP
For the PHÉBUS tests a great deal of information is available on aerosols that can either be inferred from
deposits or arises from direct measurements. However, at the present time, only two tests are considered
“open” (allowing results to be freely discussed): tests FPT0 and FPT1, [8, 9]. Furthermore, though two
other tests, FPT2 and FPT3, are of great interest here due to the presence of boron (boric acid in the
injected steam for FPT2, boron carbide in the control rod of the bundle for FPT3), the final, self-consistent
data have not yet been issued for these tests and partial results would have to be treated with caution.
Hence, presentation of results from the FPT1 test will be the focus here. It is worth noting that FPT1
complements the PBF-SFD1-4 test rather well by being at low pressure (<0.3 MPa) and comprising highly
oxidizing conditions apart from a very brief phase where molar hydrogen concentration peaked at about
50 %.
For purposes here, FPT1 (and FPT0) can be described as comparable to PBF-SFD 1-4 with a slightly
smaller bundle in terms of the number of fuel rods where these were of lower burn-up, viz. 23 GWd/tU
(trace irradiated for FPT0). A single steel-clad Ag-In-Cd control rod was placed centrally in the bundle.
There were about 3.5 kg of Zircaloy for just over 10 kg of UO
2
: this is a somewhat lower Zrly-UO
2
ratio
than in SFD 1-4. Steam was injected at a rate typically around 1.9 g.s
-1
– whence the oxidizing in
conditions with respect to SFD 1-4. The line between the bundle and the first release measurement station
was maintained at around 970 K (i.e., higher than in PBF).
For a representative view of the suspended aerosols relevant to the hot leg of a PWR we need to look at
deposits or samples not too close to the bundle in a zone where vapors have stabilised at near-equilibrium
values. This is characteristic of the upper part of the so-called vertical hot line and downstream of this
location. Data on deposits (predominantly thermophoresis) in the vertical hot line do not provide a
complete coverage of elements (e.g., data for uranium, known to be a major contributor, appears to be
lacking). However, it is clear that the volatile FPs Cs and Te are significant contributors as is Ag. Note that
Cd is predominantly in the vapor phase at the hot-line temperature and so is negligible in deposits until
lower temperatures are reached. More quantitative data are available from aerosol sampling performed
downstream using filters and impactors both in a zone at 700 °C and another at 150 °C. Table 9.2-2
summarises data on aerosol composition where it worth noting that different phases of the bundle transient
have been covered, viz. the bundle oxidation runaway, the stabilization period, the secondarc oxidation
phase, the advanced degradation phase.
Concerning particle size, impactors were used to take samples at both 700 °C and 150 °C. These samples
are, of course, punctual and may only be indicative of a particular phase of the transient. The results
indicate an aerosol population at 150 °C that is fairly lognormal with an AMMD around 3 µm with a
standard deviation of about 2. The population at 700 °C is less clearly lognormal and somewhat smaller in
mean size. However, these results must be treated with some caution as the impactor plates were heavily
overloaded and sampling flow was not steady: the impactors were not always functioning in their range of
calibration. Furthermore, in the opinion of the author, this size information is incompatible with the
absence of enhanced deposition by impaction in bends indicating particles with a rather smaller mean size.
SEM analyses of the impactor plates for FPT0 and FPT1 as well as of filter samples show particles to
comprise agglomerates of particles in the size range 0.1-0.5 µm – see Fig. 9.2-1.

NEA/CSNI/R(2009)5
327
Fig. 9.2-1 SEM images of aerosols from an impactor plate in the circuit of the PHÉBUS FPT0 test
showing an agglomerated structure of particles typically in the range 0.1 - 0.5 µm (Fig. 20
of [8])
Finally, there is some information on aerosol structure pertaining to the sample shown in Table 9.2-2, taken
at the 700 °C location late in the transient. This concerns an XPS
15
sputtering analysis of the deposit on the
filter concerned and so cannot be interpreted as statistically significant. Nevertheless, a depth profile is
seen with an indium-rich surface layer (also carbon- and oxygen-rich, both results to be treated with
caution since the former is very probably contamination while the latter is probably partly the result of
post-test oxidation) from which Cs and Sn are notably absent. Progressing deeper, Cs and Sn appear below
the surface while concentrations of uranium (thought to be probably U
3
O
8
, i.e., UO
2
oxidised post-test
16
)
and rhenium increase monotonically. Ag, Cl, O (once below the surface) and Ni (from the Inconel filter)
concentrations appear relatively uniform as a function of depth. It is also interesting to note that these
results with respect to Cs are corroborated by progressive-dissolution analyses (water, alkali, acid, strong
acid). The most striking results of these analyses concern the very limited water-solubility of Cs and Rb in
two samples widely separated in time taken at 700 °C. It was found necessary to apply strong acid in order
to dissolve the remaining 70 % of these two FPs after only 30 % dissolved in water, alkali and acid washes.
Either they migrated chemically into a protective aerosol substrate after condensing on its surface
(probably non-uniformly) or they were “encased” by another/other species condensing subsequently.
Te and Mo, both elements that may have been chemically associated with Cs and Rb in the vapor phase,
are similarly insoluble with respect to the early sample but mostly soluble in weak acid in the late sample.
W (released from thermocouples), Sn and Cd display similar behaviour in both samples. Low-temperature
samples do not show this behaviour where Cs and Rb both exhibit high solubility in water. A precautionary
note must be raised with respect to these results since not only is post-test oxidation of the sample apparent
(as already said) but the potential migration behaviour of Cs and Rb may not have occurred on the time
scale of their transport to the sampling point but over a much longer period; the relevance of migration to
consideration of the nature of aerosols as they reach the break in the primary circuit is debatable.
15
X-ray photoelectron spectroscopy
16
Note that evidence of post-test oxidation of samples was also seen in FPT0 where indium in aerosol samples was found in the
form In
2
O
3
.

NEA/CSNI/R(2009)5
328
Table 9.2-2 FPT1 aerosol composition (%) in terms of the measured elements (NB: data adjusted by
subtracting Re, W and any other non-prototypical contributions)
17
location position/time
Ag In Cd Sn U Mo Cs others
13 m 700 °C
(17034 s)
29 0 0 14 18 16 9 13
25 m
150 °C
(11051 s)
32 22 9 18 0 4 9 6
150 °C
(13810 s)
30 8 3 8 6 17 24 3
150 °C
(16473 s)
52 3 0 3 27 5 3 6
150 °C
(17034 s)
46 10 4 6 13 8 6 8
To summarise what can be concluded from the above information, and to some extent paraphrase the
experimenters’ (executive summary of Jacquemain et al.), condensed material was transported in the hot
leg and cold leg as mixed aerosols the bulk of which were dominated by control rod (mainly Ag), structural
(mainly Re, Sn) and fuel material (U).
Low-volatility FPs were probably associated with this core of low-volatility materials upon which more
volatile compounds (control rod In, Sn from clad, Cs) condensed. For Cs and Rb, diffusion and chemical
reaction with the low-volatility substrate probably occurred. Aerosol composition depended on the stage of
degradation (i.e., conditioning release) where highest aerosol concentrations occurred during bundle
oxidation when Ag, In, Cd and Sn were dominant. This subsequently became Ag, Re, Cs and Mo then Ag,
Re and U during the final degradation phase with formation of a molten pool. Impactor data show the
composition to be fairly independent of particle size (though, in the opinion of the author, this result must
be treated with caution – see above remarks related to aerosol size).
9.2.1.4 Other sources of information
A piece of information from the European 4
th
Framework project OPSA is worthy of note here. One phase
of this project involved realistic tests investigating the consequences of air ingress for an unirradiated 9-rod
fuel bundle where aerosol measurements were included, [10]. The absence of fission products limits the
value of the results in the present context but one fact is intriguing: the smallest particles measured were
uranium-rich, about 0.1-0.5 µm in size and fairly compact (rectangular). This is entirely consistent with
expertations for uranium dioxide and size distributions measured in former Japanese tests.
Finally, it is noted that there is a significant amount of information on fuel particles produced during the
Chernobyl accident. This source of data can be discounted in the present context since the aerosols differ
significantly from those produced by a LOCA. The vast majority of such aerosols represent whole-fuel
micro-fragments produced by the initial shattering of the fuel resulting from the explosion; subsequent
emissions produced aerosols via the evaporation-condensation-agglomeration route characteristic of
17
Compilation of this table used Figure 5.2-79 of [9] which provides results of ICPMS/OES analyses of filter and impactor
samples. SEM/EDX analyses are also available for three of the five samples showing significant differences, e.g., greater Cd
content, different (either higher or lower) Sn content and some Zr in the sample at 700°C.
NEA/CSNI/R(2009)5
329
LOCAs but the conditions (graphite fire, formation and prolonged ageing in highly oxidizing conditions,
high dilution in the gas phase) mean that these cannot be considered relevant here.
9.2.2 Aerosols in the containment
The identification of typical features for aerosols in the containment is more problematic than for aerosols
in the RCS. Not only does a wide diversity of accident sequences exist with varying pre-conditioning of
the source in the RCS before release to the containment, but also information for (more or less)
prototypical particles is dependent on just one experimental programme, i.e., PHÉBUS PF. In addition, the
timescale of evolution of aerosols in the containment - about one day - leaves room for transformations due
to radiolysis, oxidation, formation of (bi) carbonates, etc. to occur; this area is virtually unstudied beyond
some of the consequences for iodine species.
Further complications arise in the containment from the (potential) occurrence of major secondary sources
of aerosol material, i.e., other than the direct source generated by a degrading core. These are, in particular,
pressurised ejection of molten corium (high-pressure sequences), hydrogen deflagrations and molten-core-
concrete interaction (MCCI). Only the latter of these, MCCI, will be covered here since information on
aerosols from this source is relatively adequate.
9.2.2.1 PHÉBUS FP
Information from the PHÉBUS FP programme is derived mainly from the following two references on the
two open tests of this programme: FPT0 [8] and FPT1 [9]. We recall that FPT1 is the more representative
of the two tests since FPT0 used only trace-irradiated fuel.
Firstly, with respect to aerosol composition, it must be noted that the relative humidity in these tests was
never more than about 60 % in FPT0 and 85 % (at the end of the aerosol production phase) in FPT1 so any
steam condensation on aerosols would have required a hygroscopic effect. Given that analyses do not
predict formation of strongly hygroscopic substances prior to release into the containment, e.g., [11], a
hygroscopic effect is difficult to justify except, possibly, for a short time and to a limited extent in the
FPT1 test in relation to the presence of cesium iodide. Hence, with negligible water contribution, aerosol
composition was identical to the average composition of aerosols leaving the circuit (c.f. Table 9.2-2 for
FPT1 at the 25 m location), viz., in decreasing order: silver, tin, indium, uranium and cadmium for the
structural elements where the tin, indium and uranium contributions are similar. Of the fission products,
molybdenum and cesium were significant contributors (data from FPT1, c.f. Table 9.2-2).
The aerosol size distributions were fairly lognormal with an average size (AMMD) in FPT0 of 2.4 µm at
the end of the 5-hour bundle-degradation phase growing to 3.5 µm before stabilizing at 3.35 µm; aerosol
size in FPT1 was slightly larger at between 3.5 and 4.0 µm. Geometric-mean diameter (d
50
) of particles in
FPT1 was seen to be between 0.5 and 0.65 µm; a SEM image of a deposit is shown in Fig. 9.2-2. In both
tests the geometric standard deviation of the lognormal distribution was fairly constant at a value of around
2.0. There was clear evidence that aerosol composition varied very little as a function of particle size
except for the late settling phase of the FPT1 test: during this period, the smallest particles were found to
be cesium-rich. In terms of chemical speciation, X-ray techniques were used on some deposits and there
also exist many data on the solubilities of the different elements in numerous deposits giving a clue as to
the potential forms of some of the elements. However, post-test oxidation of samples cannot be excluded
since storage times were long (months) and the value of speculating on potential speciation on the basis of
the available information is debatable. Nevertheless, there is clear evidence that some elements reached
higher states of oxidation in the containment when compared to their chemical form in the circuit.

NEA/CSNI/R(2009)5
330
Fig. 9.2-2 SEM images of a filter deposit in the containment of the PHÉBUS FPT1 test showing a
fairly uniform structure of typically submicron particles (Fig. A9-8 of [8])
9.2.2.2 MCCI aerosols
The composition of aerosols arising from interaction of molten corium with concrete is different from that
of aerosols generated by a degrading core. The seven large-scale experiments of the international
Advanced Containment Experiments (ACE) programme on melt behaviour and aerosol release during
MCCI addressed four types of concrete (siliceous, limestone/sand, serpentine and limestone) and a range
of metal oxidations for both boiling-water and pressurised-water reactor core debris, [12]. The released
aerosols contained mainly constituents of the concrete. In the tests with metal and limestone/sand siliceous
concrete, silicon compounds comprised 50 % or more of the aerosol mass. Releases of tellurium and
neutron-absorber materials - silver, indium and boron (from boron carbide) - were high. Releases of
uranium and low-volatility fission-product elements were small in all tests. During ablation of the concrete,
aerosol composition remained fairly stable and particles were compact but varied considerable in size the
majority being typically micron-sized (geometric diameter) but with some considerably larger sizes.
It is worth noting that experiments at a smaller scale that preceded the ACE programme, [13], indicated
smaller aerosols (sub-micron AMMD) and a larger contribution to aerosol composition from uranium
mainly in the larger particles. The large-scale SURC tests at Sandia NL also addressed aerosol release (as
well as thermal-hydraulic phenomena in the cavity) associated with prototypical core-melt materials in
various types of concrete crucible, [14], but for this programme and others few results are readily available.
Nonetheless, in summary, it can be said that MCCI is likely to add a large amount of non-active aerosol
material to the containment atmosphere in the size range of the existing aerosols thus promoting
agglomeration and diversification of the aerosol composition.
9.2.2.3 Other sources of information
As for RCS aerosols, it is worth noting that information from the Chernobyl accident is not relevant here
(see §2.1.4).
NEA/CSNI/R(2009)5
331
9.3 Discussion
9.3.1 Uranium contribution
The Mulpuru et al. experiments [5] are interesting in that they show a progression of the uranium content
which can only be due to the progressive oxidation of the UO
2
; however, its dominant contribution at the
later times is not confirmed by the PHÉBUS results though, here too, a progressive contribution is
observed. While the fractional uranium release is very low its dominance in the total inventory makes this
release a major contributor to total aerosol in later stages of the transient unless conditions remain reducing
(c.f. the contrast with the PBF-SFD 1-4 results).
9.3.2 Tin contribution
The tin contribution (as oxide from Zircaloy oxidation) to aerosol mass is always present. It is not very
significant in PHÉBUS FPT0 (results not shown here) and FPT1 outside the two main oxidation phases in
the bundle, i.e., the relatively short (with respect to the total transient) oxidation runaway and the much
later and gentler secondary oxidation phase. In the reactor case, this variability would be smoothed out
(see ‘Variability’ below). Tin comprises a very significant contribution in the other experiments, probably
too significant in PBF-SFD 1-4 due to the high Zircaloy fraction in the bundle. In summary, tin has a
reliable presence whatever the conditions. It must be noted that this observation applies to Zircaloy 4
whereas newer cladding materials and VVER cladding have a lower or zero tin content.
9.3.3 Silver contribution
The silver contribution to aerosol mass in PHÉBUS FPT0 (results not shown here) and FPT1 is much
higher than in PBF-SFD 1-4 despite there being proportionally less silver in the PHÉBUS bundle. It might
be thought that this can be accounted for by purely an over-pressure effect in PHÉBUS where the lower
system pressure led to mechanical formation of droplets when the control rod burst. However, Ag is found
in all samples spread over time so clearly it is evaporating as degradation progresses. Perhaps it is
important that the control rod in PHÉBUS was centrally placed and experienced the highest bundle
temperatures. Or that the transient in PBF was more than twice as fast as that of FPT1 and more rapid
relocation of the molten Ag-In alloy occurred (Cd being rapidly released). In the end it may not matter
much in the RCS because it seems that either Cd and/or Ag contributes in a major way and both exist
predominantly in the metallic phase in the aerosols; in the containment it is a different matter since silver
and not cadmium has a major impact on the behaviour of iodine, [8].
9.3.4 Cadmium contribution
Cadmium is seen to be a very significant fraction of the PBF-SFD 1-4 aerosols whereas in PHÉBUS its
contribution is minor, sometimes negligible. A major influence in this difference is, of course, the different
temperature of the line between the bundle and the measurement point. Up to the first measurement station
in PHÉBUS, Point C, temperatures have not dropped below about 1000 K and the cadmium is very largely
in the vapor phase as Cd(g). In PBF-SFD 1-4 the temperature of the equivalent line descends very quickly
to 800 K then to around 600 K and the cadmium in this case condenses contributing to the aerosol
population.
9.3.5 Indium contribution
It is seen in PHÉBUS FPT0 (results not shown) and FPT1 that indium contributes significantly to the
overall aerosol composition whereas in PBF-SFD 1-4 its contribution is not mentioned. This contrast is
consistent with thermodynamic calculations indicating that PHÉBUS FPT0 and FPT1 conditions
(predominantly near-pure steam for most of the transient) are close to optimal for the volatilization of

NEA/CSNI/R(2009)5
332
indium via the formation of In
2
O(g) and InOH(g), [15]. In reducing conditions, such as those of PBF-SFD
1-4, the dominant evaporating species is the much less volatile metal, In(g).
9.3.6 Fission product contribution
Total aerosol mass is seen in the tests reviewed to be typically between 10 and 40 % FPs (though, in the
LWR context here, it must be recalled that the AECL tests give too much weight to FPs by not including
structural components other than cladding).
9.3.7 Size, shape and structure
There is some evidence that particles are compact, i.e., somewhat spherical, unlike the branched structures
that one finds for soot, for example. As for size, it is difficult on the basis of the information reviewed to
conclude on a typical size; perhaps a near-lognormal distribution with an AMMD not exceeding 1 µm and
a standard deviation of around 2 would seem reasonable in the hot leg. The aerosols comprise
agglomerates of particles typically in the range 0.1-0.5 µm. This particle size is much too large to represent
true primary particles since these are typically ≤10 nm. It is likely these particles represent clusters of
primary particles upon which different vapors may have condensed. It is worth noting that these clusters
are themselves probably very resistant to break-up and, hence, constitute the smallest possible size of
aerosol fragments post-break-up. Such a phenomenon has been observed for titanium dioxide particles
where agglomerates of 0.1 µm-sized clusters of 3 nm-sized primary particles could be broken apart by
impact at high velocity onto a surface but the clusters themselves proved resistant to break-up at impact
speeds up to 120 m.s
-1
, [15]
18
, see Fig. 9.3-1.
It is worth noting that the information available for containment aerosols does not take into account
potential effects from hot-leg sequences. As has been seen in the PHÉBUS FP tests, many fission-products
species have significant fractions in the vapor-phase at temperatures above 900 K. This means that, for a
hot-leg sequence, such vapors would be released into the containment and either nucleate creating a
population of small particles rich in FPs and/or condense onto existing aerosols (conforming to the
assumptions of current analyses). Small particles are also be expected due to the radiolytic conversion of
gaseous I
2
into IO
X
aerosol. But it is known from probabilistic risk assessments that small breaks are more
likely and in such cases nucleation takes place in the reactor coolant system. As has been noted in the past,
[16], the former situation creates a bimodal source to the containment where, according to models,
agglomeration between the two populations can be weak. It is important to take into account here,
therefore, the potential for a small-sized aerosol rich in volatile fission products (notably I and Cs) to exist
in the containment and be relatively resistant to agglomeration and deposition - its importance with respect
to accident management is also clear.
18
This interesting piece of work measured break-up of primary-particle agglomerates as a function of impact velocity and
attempted to discover a relationship with the primary-particle bonding force (with qualitative success). The technique developed
is ideal for the problem of particle representativity in high-flow-velocity experiments if only representative particles were
available for comparison with those used in such out-of-pile tests: their break-up behaviour upon impact could be used as a
measure of representativity.

NEA/CSNI/R(2009)5
333
Fig. 9.3-1 TEM images of agglomerates of titanium dioxide nanoparticles: before impact (left); after
impact at a velocity of 45 m.s-1 (centre) and 71 m.s-1 (right). The primary clusters resist
fragmentation (Fig. 3(c) of [15])
9.3.8 Variability
Variability of aerosols as a function of time is to a large extent dependent on scale being very evident in
the smallest-scale tests ([5]) where conditions are virtually homogeneous for the whole fuel sample. The
more heterogeneous conditions (extent of oxidation, fuel burn-up, temperature field, etc.) inherent at core
scale would lead to significant smoothing of the different releases as seen in the primary circuit, and,
hence, give rise to a more uniform particle composition over the majority of the release-from-core phase.
What would have more impact is the accident scenario, i.e., a high-pressure sequence relative to a
low-pressure one may well lead to more variation in the aerosol composition than is seen over the duration
of a single, given sequence. It should be taken into account that current emergency action guidelines intend
to transfer high pressure cases into low pressure ones. This may be particularly true of control-rod and
uranium contributions to overall aerosol mass where both of these may be expected to decrease at high
pressure: no bursting behaviour and lower Cd volatility for the former and greater dissolution by Zrly and
less oxidation and volatilization for the latter.
A final consideration is that of the multi-component nature of the aerosols: how uniform a composition do
they have? Does composition vary not only with size, but for a given size are there particles of
significantly different composition? Concerning composition as a function size, results from VERCORS
tests without control-rod materials provide information on aerosols that have formed close to their point of
release: a bimodal population is observed with smaller, sub-micron particles rich in volatile FPs and larger
micron-sized particles rich in less volatile FPs such as Ba, [18]. However, the possibility of agglomeration
was perhaps limited in these tests. PHÉBUS FP implies a significantly homogeneous composition in the
primary circuit and, more especially, in the containment. This is an aspect that probably merits further
investigation with respect to primary circuit aerosols and containment aerosols in the event of a hot let
break (see the discussion of the potential bimodal distribution in §3.8).
9.3.9 Other considerations
There is a potentially significant contribution to the aerosol during an accident arising from the presence of
large quantities of boron. This has not been covered in the experiments reviewed above but useful data will
be forthcoming from the PHÉBUS FPT2 and FPT3 tests. Boron is present as boron carbide in BWRs,
French 1300 and 1450 MWe PWRs and VVER 1000 s; the quantities involved are significant, around
330 kg of B4C in the French PWRs, [19], and around 270 kg in a VVER 1000, [20]. In a BWR, this
amount may exceed one tonne, [21]. As for the borated coolant, it has been estimated that, at the time core
uncovery starts, typically about 46 kg of boron (as boric acid) will be present in the water, [21]. While
NEA/CSNI/R(2009)5
334
these quantities are significantly less than the approximately 3 tonnes of Ag-In-Cd alloy in a typical PWR,
the boron as boric acid (as added to the coolant or as a reaction product of steam and boron carbide) is very
volatile: boron cannot be neglected as a potentially significant contributor to aerosol mass. It is also noted
that borated species such as CsBO
2
have a hygroscopic potential comparable to that of CsI.
9.4 Conclusion
Literature on aerosols produced from overheated urania fuel has been reviewed and discussed.
The typical aerosol composition for PWRs is seen to be a mixture of metals (Ag and/or Cd, 15-40 %) with
a similar metal-oxide content (tin oxide and, potentially, uranium dioxide and zirconium dioxide) and FPs
covering a diversity of compounds (from metal to oxides to salts (e.g., RbI) ) to ternary compounds). It
would appear that a particle composed of one third metal, one third metal oxide and one third a mixture of
mainly FP species (salts, ternaries, oxides, hydroxides) would not be out of place in any of the potential
LWR accident sequences. Secondary sources of aerosol material in the containment can add significant
masses of aerosol to those of the primary source where, in the case of MCCI, significant diversification of
composition occurs due to agglomeration with the largely concrete-derived contribution. It must be noted
that it has not been possible to take account of boron (from boron carbide in BWR control blades and some
French PWRs and VVER 1000 control rods or boric acid in the coolant) in this assessment.
Relative compact particles without branching chain-like structures are observed in PHÉBUS, especially in
the circuit. If steam condensation on particles occurs (in the cold-leg in a cold leg sequence, or in the
containment) then, due to the surface tension effect, compaction will occur to the limit of the particle
becoming a spherical droplet.
On size and structure, information is less reliable but it would seem realistic for aerosols in the hot leg to
comprise a near-lognormal population of particles with AMMD around 1 µm or less and standard
deviation around 2. The larger particles would consist for the most part of agglomerates of compact
clusters as small as 0.1 µm. The evidence from PHÉBUS implies the thesis of an “onion-skin” type of
structure where the kernel of the particle is rich in highly refractory materials. Vapors of more volatile
species containing cesium and rubidium that have condensed on these refractory kernels may migrate into
and interact chemically with the substrate. In the containment, particles are typically larger representing the
particles formed in the primary circuit and agglomerates of these. A smaller population of FP-rich particles
may form at the breach, i.e., creating a bimodal aerosol population in the containment, in the event of a
hot-leg sequence, which have a relatively low probability. The IO
X
formed due to the molecular
iodine-ozone reaction contribute to the part of fine dispersed aerosols.
References
[1] S. Güntay, D. Suckow, A. Dehbi, R. Kapulla ARTIST: introduction and first results Nucl. Eng. Des.
231 Issue 1, 109-121, 2004
[2] O. Brandt, A.M. Rajathurai, P. Roth First observations on break-up of particle agglomerates in shock
waves Experiments in Fluids 5 (2), 86-94, 1987
[3] J.J.F. Strecker, P. Roth Particle breakup in shock waves studied by single particle light scattering
Particle and Particle Systems Characterization 11(3), 222-226, 1994
[4] H.C. Hamacker The London - Van der Waals attraction between spherical particles Physica 4,
1058 - 1072, 1937
[5] S.R. Mulpuru, M.D. Pellow, D.S. Cox et al. Characteristics of radioactive aerosols generated from a
hot nuclear fuel sample J. Aerosol Sci. 23 suppl. 1, S827-S830, 1992
NEA/CSNI/R(2009)5
335
[6] D.A. Petti, Z.R. Martinson, R.R. Hobbins, C.M. Allison, E.R. Carlson, D.L. Hagrman et al. Power Burst
Facility (PBF) severe fuel damage test 1-4 test results report NUREG/CR-5163 (EGG-2542), April 1989
[7] D.A. Petti, R.R. Hobbins, D.L. Hagrman The composition of aerosols generated during a severe
reactor accident: experimental results from the Power Burst Facility severe fuel damage test 1-4
Nuclear Technology 105, 334-345, 1994
[8] B. Clément, N. Hanniet-Girault, G. Repetto, D. Jacquemain, A.V. Jones, M.P. Kissane, P. von der
Hardt (2003). LWR severe accident simulation : synthesis of the results and interpretation of the first
PHÉBUS FP experiment FPT0. Nucl. Eng. Des. 226, 5-82, 2003
[9] D. Jacquemain, S. Bourdon, A. De Bremaecker, M. Barrachin FPT1 final report - IRSN report IPSN
PH-PF IP/00/479, Dec. 2000
[10] Pintér Csordás, L. Matus et al. Investigation of aerosols released at high temperature from nuclear
reactor core models J. Nucl. Mat. 282, 205-215, 2000
[11] M.P. Kissane, I. Drosik Interpretation of fission-product behaviour in the PHÉBUS FPT0 and FPT1
tests Nucl. Eng. Des. 236 (11), 1210-1223, 2006
[12] J.K. Fink, D.H. Thompson, B.W. Spencer, B.R. Sehgal Aerosol and melt chemistry in the ACE molten
core-concrete interaction experiments. High Temperature and Materials Science 33(1), 51-76, 1995
[13] B.W. Spencer, D.H. Thompson, J.K. Fink, W.H. Gunther, B.R. Sehgal Results of fission product
release from intermediate-scale MCCI tests Proc. Int’ Conf. on Thermal Reactor Safety, Avignon,
France, 2-7 Oct. 1988.
[14] S.B. Burson, D. Bradley, J. Brockmann, E. Copus, D. Powers, G. Greene, C. Alexander United
States Nuclear Regulatory Commission Research Program on molten core debris interactions in the
reactor cavity Nucl. Eng. Des. 115(2-3), 305-313
[15] P. Taylor Calculations on the volatility of control-rod elements in various atmospheres at 1200 to
2500 K IPSN Note Technique SEMAR 98/160, 1998
[16] S. Froeschke, S. Kohler, A.P. Weber, G. Kasper Impact fragmentation of nanoparticle agglomerates
J. Aerosol Sci. 34 Issue 3, 275-287, 2003
[17] CSNI, report by a group of experts Physical and chemical characteristics of aerosols in the
containment. OECD/NEA/CSNI/R(93)7, 1993
[18] J.P. Leveque, D. Boulaud Fission product aerosols in the programmes HEVA and VERCORS J.
Aerosol Sci. 25 Suppl. 1, 87-88, 1994
[19] B. Adroguer et al. COLOSS Final Extended Report: Part 2; Synthesis on plant calculations
SAM-COLOSS-P080, IRSN/DRS/SEMAR 03/30, June 2003
[20] L. Belovsky Heat release from B4C oxidation in steam and air Proceedings IAEA-TCM,
Dimitrovgrad, Russia, October 1995
[21] M.P. Kissane, B.R. Bowsher, Y. Drossinos, D.A. Powers Final report of the PHÉBUS-FP boric acid
task force IPSN Note Technique SEMAR 94/1007, 1994
NEA/CSNI/R(2009)5
336

NEA/CSNI/R(2009)5
337
10. APPENDIX 2: Aerosol Shape Factors
10.1 Fundamentals
The equations of aerosol physics are derived traditionally in terms of spherical, fully dense particles. Real
aerosol particles are seldom either fully dense or spherical. The equations of aerosol physics are most
directly applicable to liquid droplets. Some types of aerosol generated in reactor accidents can be, indeed,
liquid droplets (see discussion of Direct Containment Heating, chapter 3.8). Usually vapors produced in
reactor accidents condense to form solid particles. This is because of the supersaturation needed to drive
particle nucleation (even particle nucleation on another aerosol particle) and the speed with which vapor
pass through sharp thermal gradients around degrading core materials. The nucleated particles following
some growth as a result of vapor condensation form what are called “primary particles” and these primary
particles do agglomerate quickly but seldom is the initial agglomeration to form a compact structure.
Today, it widely thought that primary particles agglomerate to form fractal structure where the number of
primary particles, N
pr
, is related to the diameter of the conglomerate by:
f
d
D
kN
)(
primary
pr
=
where:
k = first order lacunarity constant 1
f = fractal dimension
D = some measure of the effective particle diameter
D
primary
= primary particle diameter
Of course, for a close packed structure, the value of “f” would be very close to 3. For aerosol particles, it is
not uncommon to find values of the fractal dimension between 1.4 and 2.5. Consequently, the particles are
far from fully dense.
Experiments by [1] at the Oak Ridge National Laboratory showed that many aerosols pertinent to the
issues of reactor safety (but not all) developed approximately spherical envelops in environments of very
high humidity. Some example results of tests by Adams are shown in Fig. 10.1-1 for U
3
O
8
aerosols. It is
thought that surface forces produced when water vapor condensed in the concave interstices of particle
agglomerates (reverse Kelvin effect) drew elements of these agglomerates into approximately spherical
forms to minimise energy. These ‘spheroidized’ were still far from fully dense.
The spheroidization of particles at high humidity is an issue that affects aerosols in the reactor
containment. It is not evident that such effects will be important for aerosols in the reactor coolant system.
It is, then, likely that aerosols in the reactor coolant system could exhibit very substantial deviations from
the conditions assumed in the derivation of aerosol equation of fully dense spheres.

NEA/CSNI/R(2009)5
338
Fig. 10.1-1 Example of test results obtained by Adams et al. showing spheroidization of uranium oxide
aerosols at high relative humidity
10.2 Dynamic and Collision Shape Factors
To correct the aerosol physics equations for the properties of real aerosols, shape factors are introduced.
Commonly, a shape factor to account for the real drag on aerosol particles, the dynamic shape factor, and a
shape factor to account for the collision cross section of real particles are introduced. These shape factors
are usually referenced to the volume-equivalent spherical particle that would have the diameter D
v
. In
terms of the number of primary particles that make up an agglomerate, the volume-equivalent spherical
particle has a diameter given by:
pr
3/1
prv
dND =
where d
pr
is the diameter of a primary particle that is considered fully dense and spherical. The
dynamic and collision shape factors are defined, then, by:
)D(C
)D(C
D
D
ae
v
2
aeo
2
v
ρ
ρ
=χ
v
c
D
D
=
γ

NEA/CSNI/R(2009)5
339
where:
aerosolupmakingmaterialofdensity=ρ
3
o
cm/g1=ρ
diametersphericalequivalentcaerodynamiD
ae
=
diametersphericalequivalentcollisionD
c
=
diametersphericalequivalentvolumeD
v
=
v,c,aexforDdiameterofsphereaforfactorcorrectionslip)D(C
xx
==
[2] has reviewed information available on dynamic and collision shape factors in reactor
containment atmospheres. He concludes that in humid environments where spheroidization occurs,
dynamic and collision shape factors are equal and can vary between 1 and about 4. [3] provides a useful
account of dynamic shape factors for non-nuclear circumstances. Some efforts were made in the past to
“back calculate” effective shape factors from comparison of measurements of aerosol sedimentation and
calculations. This, of course, is an ill-advised approach and certainly will not yield results transferable to
reactor accidents. [3] proposed a packing fraction model of aerosol shape factors in containments:
3/1
α=γ=χ
ρ
ρ
ε
−
+
ρ
ε
=α
ε
)1(
)
/)3(3
,1(min )(
ff
D
d
v
pr
−
=
ε
where ρ
ε
is the density of gas or liquid that fills the interstices of the particle agglomerate and f is the
fractal dimension of the agglomerate. Shape factors calculated with this expression are shown in Fig.
10.2-1 for particles with interstices filled with water, interstices with only 10 % water and with only gas.
The expression approximates well known shape factors for dimers of primary particles.
Volum e-equivalent Spherical D iam eter (µ m)
0.01 0.1 1 10
Dynamic Shape Factor,
χ
1.0
1.5
2.0
2.5
3.0
3.5
4.0
w a te r-fille d v o id s
voids 10% w ater
dry voids
Fig. 10.2-1 Prediction of the dynamic shape factors for spheroidized particles

NEA/CSNI/R(2009)5
340
Shape factors of aerosol particles in the reactor coolant system pose more of a problem. Dynamic shape
factors can be measured in principle and, consequently, the understanding of the dynamic shape factor is
more advanced. [4, 5] have examined the shape factors of aerosols formed from pertinent materials using
high temperature processes. Kops used exploding wires to produce aerosols of iron oxide and uranium
oxide. Allen
et al. used laser evaporation to form aerosols of mixed oxide reactor fuel. Both studies
showed that primary particles agglomerated initially to form chains. As the chains grew, they developed
branches. Once the agglomerates contained more than 2000 to 20.000 primary particles, they folded into
irregular masses. Sketches of aerosol particles near the transition and having the same aerodynamic
diameter are shown in Fig. 10.2-2.
chain agglomerate
folded agglomerate
d
primary
~ 0.025 µm
Fig. 10.2-2 Sketches of branched chain and folded agglomerates
The investigators observed that the aerodynamic-equivalent diameters of the branched chain agglomerates
varied with the number of primary particles present to the 1/6
th
power:
o
pr
6/1
pr1ae
dNkD
ρ
ρ
=
The dynamic shape factor for the branched chains is then given by:
)D(C
)dN(C
k
N
ae
pr
3/1
pr
2
1
3/1
pr
=χ
That is, the shape factor grows reasonably rapidly with particle size. Indeed, Kops et al. mention dynamic
shape factors as large as 35.
On the other hand, the folded agglomerates had aerodynamic diameters that varied with the 1/3
rd
power of
the number of primary particles present:

NEA/CSNI/R(2009)5
341
o
pr
3/1
pr2ae
dNkD
ρ
ρ
=
The aerosol material density was assumed to be 5 g/cm
3
and the fractal dimension was taken to be 1.78 for
these predictions. Primary particle diameter was taken to be 0.025 µm.
Both particles had the same aerodynamic diameter. The structure of the folded agglomerate collapsed on
deposition so it appears more densely packed than when it was airborne.
Then, the dynamic shape factor is only very weakly dependent on particle size:
)D(C
)dN(C
k
1
ae
pr
3/1
pr
2
2
=χ
Both Allen
et al. and Kops et al. suggest that shape factors for folded agglomerates (sometimes called ‘dust
bunnies’) decrease slowly with increasing size.
Proportionality factors in these expressions for the aerodynamic diameter are very uncertain. The
proportionality factor for chain agglomerates can be chosen so that predicted shape factors agree well with
the known shape factors of rigid chains of 1 to 6 monomers shown in Table 10.2-1.
Table 10.2-1 Dynamic shape factors for rigid chains of monomers
Number of
Monomers
χ Number of
Monomers
χ
1 1.00 5 1.45
2 1.12 6 1.57
3 1.27 7 1.73
4 1.32 8 2.04
The proportionality factor for the aerodynamic diameter of folded agglomerates should depend on the
fractal dimensionality of the agglomerates:
2/1
)(
)D(CN
)D(C
k
ae
f3/)f3(
critical
2
−
=
where N
critical
is the number of primary particles present in an agglomerate when it begins to transform
from a branched chain to fold agglomerate (~5000).
Shape factors predicted for primary particles 0.025 µm in diameter and a fractal dimension of 1.78 are
shown in Fig. 10.2-3. As expected, smaller particles that are chains have shape factors that are strongly
dependent on particle size. Larger particles that are folded agglomerates have shape factors nearly invariant
with particle size but dependent on the fractal dimensionality of the agglomerate.

NEA/CSNI/R(2009)5
342
The fractal dimension, f, of agglomerates has been studied both theoretically and experimentally. Under
conditions of Brownian diffusion of monomers to a stationary agglomerate, there is reasonable consensus
that the fractal dimensionality of the agglomerate is about 1.78 [6]. Fractal dimension decreases when
coagulation of agglomerates as well as monomers is considered. Fractal dimensions on the order of 1.4 are
found for conditions of Brownian diffusion [7].
Volume-equivalent Spherical Particle Size (µm)
0.01 0.1 1 10
Dynamic Shape Factor
1
3
5
7
9
11
13
15
Branched
Chains
Folded
Agglomerates
known values
for rigid chains
Fig. 10.2-3 Shape factors for branched chains and folded agglomerates
(D
primary
= 0.025 µm; Fractal dimension = 1.78)
Fractal dimensions of agglomerates will be affected by the continued heating under reactor accident
conditions. Primary particles are quite reactive since such a large fraction of their constituents are surface
species with unsatisfied bonding. [8] have addressed the issue of sintering in aerosol agglomerates and
have advanced a model based on the proportionality of the shrinkage rate with surface area. Based on this
model, the rate of change of the fractal dimension of a folded agglomerate composed of N
pr
primary
particles is given by:
td
Dd
D
1
td
f
1
d
Nln
)(
pr
=
The rate of change of the particle diameter might be taken from a model of initial stage sintering such as
that of [9]. Such a model is dependent on the grain boundary diffusion coefficients which are not likely to
be known for materials of interest in the analysis of reactor accidents:
31.0
][
4
pr
gb
3
69.0
dTk7
Dab800
t
1
)0(D31.0
td
)t(Dd
π
γ
−=

NEA/CSNI/R(2009)5
343
where:
thicknessboundarygrainb =
energysurface=
γ
volumevacancya
3
=
tcoefficiendiffusionboundarygrainD
gb
=
The theory of collision shape factors is less developed than that of dynamic shape factors. Certainly a
lower bound estimate of the collision shape factor can be obtained by ignoring the chain branching [10]:
3/1
pr
2
pr
N
)]1N)(433(4)N1[(
2
1
−−+π+
π
=γ
For folded agglomerates, the estimated collision shape factor will again depend on the fractal dimension:
f3/)f3(
pr
N
−
=γ
There are few data available to judge the adequacy of these estimates of the collision shape factor.
References
[1] R. Adams “Behaviour of U
3
O
8
, Fe
2
O
3
, and Concrete Aerosols in a Condensing Steam Environment”
Proc. Int’l. Mtg. On LWR Severe Accident Evaluation, Cambridge, MA, August 28 – September 1,
1983
[2] J.E. Brockmann “Range of Possible Dynamic and Collision Shape Factors”, Appendix F, R.J.
Lipinski et al., Uncertainty in Radionuclide Release under Specific LWR Accident Conditions,
Volume II TMLB’ Analyses SAND84-0410 Vol.2, Sandia National Laboratories, Albuquerque,
NM, February 1985
[3] W. Stoeber “Dynamic Shape factors of Nonspherical Aerosol Particles”, Chapter 14, Assessment of
Airborne Particles, T.T. Mercer, P.E. Morrow, and W. Stoeber, editors, Charles C. Thomas
Publisher, 1972
[4] D.A. Powers, K.E. Washington, S.B. Burson, J.L. Sprung A Simplified Model of Aerosol Removal
by Natural Processes in Reactor Containments NUREG/CR-6189, Sandia National Laboratories,
Albuquerque, NM, July 1996
[5] J. Kops, G.Dibbets, L. Hermans, J.F. Van De Vate J. Aerosol Science, 6 (1975) 329
[6] M.D. Allen, O.R. Moss J.K. Braint J. Aerosol Science, 10 (1978) 43
[7] S. Tang, J.M. Preece, C.M. McFarlane, Z. Shang J. Colloid and Interface Science, 221 (2000) 114
[8] P. Meakin Phys. Rev. A, 29 (1984) 997
[9] W. Koch, S.K. Friedlander J. Colloid and Interface Science, 140 (1990) 419
[10] D.L. Johnson, I.B. Cutler J. Amer. Ceramic Soc., 46 (1963) 541
[11] A.D. Maynard, A.T. Zimmer Aerosol Science and Technology, 37 (2003) 804
NEA/CSNI/R(2009)5
344

NEA/CSNI/R(2009)5
345
11. APPENDIX 3: Spray Modelling Developed from Recent Analytical Work
This Appendix presents a thorough description of the mechanistic approach to modelling of sprays and
their effects that has been developed and validated over the last few years for the ASTEC code, [1]. Note
that the nomenclature of the equations is provided at the end rather than in the text.
11.1 Relaxation of Droplets
The mass, velocity and temperature evolution of a droplet during its fall is obtained by solving a set of
equations for mass, momentum and energy balance (the z axis is oriented downwards):
wMwgsgw
w
v/B M c D Sh d
dz
dm
π= , (1)
wgD
2
w
wwww
v C
8
d
v/g m)vm(
dz
d
ρ
π
−= , (2)
s
w
wwgggwww
H
dz
dm
v)/T-(T Nu d )H m(
dz
d
+λπ=
(3)
Equations (1), (2), (3) are solved on a fixed mesh using an implicit numerical scheme. The mesh size
follows a geometrical progression, small meshes being necessary within the first two metres below the
spray nozzles where transfers are very fast. The solution provides the evolution of the droplet size, velocity
and temperature versus height in the containment.
The
physical modelling is contained in the Nusselt number, Nu
g
,, Sherwood number, Sh
g
, and drag
coefficient, C
D
. The Nusselt and Sherwood numbers were deduced by [2] from steady evaporation in dry
air of droplets having diameters in the range 600 to 1100 microns who proposed the following correlations:
3/1
g
2/1
wg
Sc Re 6.0 2Sh +=
, (4)
3/1
g
2/1
wg
Pr Re 6.0 2Nu +=
(5)
The drag coefficient is obtained from the Oseen formulation [3] for hard spheres:
for Re
w
< 3 C
D
= 24 /Re
w
(Stokes flow) , (6)
for 3 < Re
w
< 905 C
D
+=
6
Re
1
Re
24
3/2
w
w
(intermediate flow) , (7)
for Re
w
> 905 C
D
= 0.44 (potential flow) (8)

NEA/CSNI/R(2009)5
346
When using the above correlations, the “one-third” law must be followed, i.e., the relevant physical
parameters (steam-air diffusion coefficient, thermal conductivity, average molar concentration, fluid
density) are calculated at the following temperature:
,
wg
T
3
2
+ T
3
1
= T
(9)
except for the Reynolds number which is calculated at the gas temperature.
(It should be mentioned that alternatives to the correlations based on [2] are available today.)
11.2 Droplet Coalescence
The droplet size distribution produced by the spray nozzle typically used in PWRs is well represented by a
log-normal distribution function, [4]:
)
r/r(ln
exp(
r )ln(
n
)r(f
2
2
0
)(ln 2
)
2
σ
π
σ
g
−=
(m
-4
) (10)
The droplet size distribution just below the injection nozzles changes with the height in the containment
due to heat, momentum and mass transfer with the surrounding gas, and gravitational coagulation. Neither
the complex phenomena linked to the droplet trajectories and collisions at the spray ring outlet nor the
interactions with the vertical walls are considered. The uncertainties due to these phenomena are assumed
to be contained in the mass-median diameter and standard deviation of the distribution. Nevertheless, the
model allows evaluation of the sensitivity to these parameters.
Droplet-droplet interactions are rather important since containments typically have multiple spray heads
aimed in a variety of directions to minimise the unsprayed region.
Regarding the modelling of droplet coalescence, it is more convenient to express the droplet distribution
function in term of volume since the coalescence allows volume conservation. The distribution function
f(x), where x is the volume of the droplets in a given size class, is described on a fixed axial mesh with a
geometrical progression. The size nodes are distributed on a constant logarithmic scale. This allows
limitation of the number of classes taken into account with accurate description in the small size classes
where the peak of the distribution is located.
The variation of the distribution function due to the coalescence is obtained, in each axial mesh, by the
resolution of the system of n equations of the following form:
∫∫
∞
Φ−−−Φ=
∂
∂
0
jj
x
0
jj
j
dy )t,y(f )t,y,x( )t,x(fdy )t,yx(f )t,y(f )t,yx,y(
2
1
t
)t,x(f
j
(11)
where n is the number of nodes of the distribution. The physical model is contained in the expression
of the droplet collision kernel Φ (x
i
, x
j
,t):
Φ (x
i
, x
j
,t) = ε π ( r
i
+ r
j
)
2
( v
j
-v
i
) (m
3
.s
-1
) (12)
where v
j
and r
j
are respectively the velocity and the radius of a droplet in size class j. The collision
efficiency is:

NEA/CSNI/R(2009)5
347
2
2
)rr/(r
iji
+=
ε
with r
i
> r
j
(13)
In Equation (11), the first integral describes the rate of appearance of droplets in the class j due to
coalescence of smaller droplets and the second integral describes their rate of disappearance from this size
class. We assume a linear variation of the distribution function in a given interval between two nodes:
∀ x ∈ [xj, xj+1] ,
j1j
j
1j
j1j
1j
j
xx
xx
)t(F
xx
xx
)t(F)t,x(f
−
−
+
−
−
=
+
+
+
+
(14)
where F
j
(t) is the value of the distribution function at node j. With this assumption, the distribution
function can be expressed from the node values and from an interpolation function g
j
(x) as follows:
∀ x ∈ [x1, xN] ,
)x(g )t(F )t,x(f
j
N
1j
j
∑
=
=
(15)
where g
j
(x) is a triangular type function.
The discrete formulation of the set of equations (11) is then:
∑∑∑
===
−=
N
1i
ijij
N
1i
N
1k
ikjki
j
(t)I )t(F)t(F(t)J )t(F )t(F
2
1
dt
)t(dF
(16)
with (overlapping integrals):
∫
∞
Φ=
0
ijij
dy )y(g )t,y,x( )t(I
(m
6
.s
-1)
(17)
∫
−−Φ=
j
x
0
jkijikj
dy )yx(g )y(g )t,yx,y( )t(J
(m
6
.s
-1
) (18)
The difficulty in the resolution of this system arises from the calculation of the sink integrals I
ij
(t) and
source integrals J
ikj
(t). In order to calculate the first kind of overlapping integral, we assume a linear
variation of the collision kernel between two nodes. The computation of the source integrals (18) is more
difficult and can be avoided in the following way: the most important thing being to ensure conservation of
the mass during the coalescence process, which implies a relation between the sources and sink integrals, a
mathematical formulation of this relation can be found:
J
ikj
(t) = I
ik
(t) Γ
ikj
(19)
where Γ
ikj
is a function of the nodes x
i
, x
k
and x
j
of the distribution.
11.3 Coupling of Droplet Relaxation and Coalescence
The main difficulty in describing the downward evolution of the droplet size distribution is to take into
account at the same time the droplet relaxation and coalescence. Here, the term “relaxation” designates the
heat, mass and momentum transfer with the containment atmosphere until the equilibrium size and
temperature, and terminal velocity of an individual droplet are reached. In the containment, and for a
saturated atmosphere (when the spray is fully established), we can distinguish three zones: a zone just

NEA/CSNI/R(2009)5
348
below the spray nozzles where droplet relaxation is taking place while their coalescence is weak, a lower
zone where droplet coalescence at terminal velocity is dominant (located approximately two meters below
spray nozzles), and an intermediate zone where there is no conservation of the number flux of droplets
(relaxation) and no conservation of the volume flux of droplets (coalescence). This is no longer valid if the
atmosphere is superheated (generally at the start of the spray) or if conditions are not homogeneous. It is
then necessary to solve the problem continuously along the total droplet fall height whatever the gas
conditions. In our model, the equation of conservation of the population of droplets, as expressed at the
node values, is given by an equation of the form:
4342143421
relaxation
R
ecoalescenc
C
j
j
j
j
jjj
x
dt
)t(Fd
x
dt
)t(Fd
)x )z( v)z(F(
dz
d
∆+∆=∆
(m
-3
.s
-1
) (20)
where F
j
(z) is the node value of the distribution function at elevation z at node j and v
j
(z) is the
velocity of the droplet of the class j at elevation z. The rigorous method of resolution would comprise
solving simultaneously the relaxation and coalescence of droplets for each mesh. This would need an
implicit scheme for both relaxation and coalescence mechanisms and would consume too much CPU time.
Moreover, it is well known that numerical stability is better reached by using a moving grid for the size
distribution when one wants to compute the relaxation process. A method was proposed, [5], that allows
conservation of the droplet number flux in the relaxation zone (zone located just below the spray nozzles),
conservation of the mass flux in the coalescence zone (lower part of the containment), and good agreement
in the intermediate zone. The method consists of solving firstly the droplet relaxation for each size node
without considering the interaction between droplets (no coagulation) from the different classes. The
displaced grid obtained in this way at the end of the step is used to compute the coagulation term. Finally,
when recovering the new distribution on the fixed grid, a normalisation factor (always very close to one,
even in the intermediate zone) is applied to ensure volume flux conservation in the coagulation term.
Frontiers between vertically-connected volumes are part of the meshing. This allows droplets moving from
one volume to another to be treated, the numerical scheme being stable enough to advance the solution
with slightly changing atmosphere conditions.
The evolution of the droplet distribution function as a function of fall height in a saturated atmosphere
(log-normal distribution at injection with 500 µm mass-median diameter and 1.5 standard deviation) is
shown in Fig. 11.3-1. We note an increase of the concentration of droplets at 5 m, where terminal velocity
is reached, and later on a decrease of the concentration due to coalescence.

NEA/CSNI/R(2009)5
349
1,00E+02
1,00E+03
1,00E+04
1,00E+05
1,00E+06
1,00E+07
100 1000 10000
DIAMETER ( µm )
dn/d lnd ( m-3 )
H = 0 m
H = 5 m
H = 10 m
H = 20 m
H = 30 m
Fig. 11.3-1 Evolution of the droplet distribution function versus height in the containment in a
saturated atmosphere under the influence of droplet relaxation and coalescence
11.4 Evolution of the Atmosphere Conditions
In the context of a multi-compartment description of the containment as used in ASTEC, the atmosphere
composition and temperature are assumed to be homogeneous inside each compartment. The time
evolution of the thermal-hydraulic conditions in a compartment (pressure, temperature and relative
humidity) due to the spray is obtained from a mass and energy balance. This balance corresponds to the
mass and enthalpy removed by spray droplets during their fall inside the considered compartment. They
are determined from the evolution of the droplet distribution function between the top and the bottom of
the compartment as follows:
∫
∆
∆
dr) (r) v)r(H )r(m f(r)(
z
1
- =
dt
dU
www
, (21)
∫
∆
∆
ρ
dr) (r) v)r(m f(r)(
z
1
- =
dt
d
ww
s
, (22)
0 =
dt
d
a
ρ
, (23)
and the set of equations of state:
P- )T,P(H + )T,P(H = U
totgaaagsss
ρρ
, (24)
)T,P( =
gsss
ρρ
(25)

NEA/CSNI/R(2009)5
350
Equations (21) and (22) express the variation of the energy and steam density depending on the differences
between the outgoing and entering enthalpy and mass fluxes, where f(r) is the size distribution function of
the spray, respectively at the bottom and top of the compartment. The solution of the set of equations (1),
(2), (3), (20), (21), (22) and (23) coupled with the equations (24) and (25) for each size node provides the
evolution of P
s
, P
g
, T
g
versus time. Although the atmosphere conditions are assumed to be stationary during
droplet fall, the transfer rates are quite sensitive to them and an implicit scheme is necessary in order to
avoid numerical instabilities.
Resulting mass and energy sink rates are returned to other ASTEC models handling the overall mass and
energy balances including transfers between compartments and transfers to the walls and sumps. Note that
the gas transfer between compartments depends on pressure/temperature differences and does not takes
into account the force exerted by the spray droplets: this is a limitation linked to the multi-compartment
description.
11.5 Aerosol Removal Modelling
By definition, the collection efficiency of aerosol particles by a droplet is equal to the number of particles
captured by this droplet divided by the number of particles present in the volume swept during its fall. It
results from several mechanisms which are mainly related to the flow motion around the droplet, to the
steam mass transfer (evaporation or condensation) and to the particle concentration gradient near the
droplet surface (diffusion). The collection efficiency has then the following general expression:
) ) v(z,,d , (i,
p
ΦΦε
(26)
in which i refers to the considered compartment (atmosphere conditions and composition), Φ is the droplet
diameter, d
p
is the particle diameter, and v(z,Φ) is the velocity of a droplet of size Φ at the axial location z.
The mass concentration in a given size class in this compartment changes according to the equation:
dC )d )dz ) ) v(z,,d , (i, ) v(z,)F(z,(
4
(
V
S
-
t
d
)C d(d
mp
2
m
ΦΦΦεΦΦ
Φπ
=
∫∫
(27)
This equation allows calculation of the removal rate of aerosol particles having a radius between r
p
and
r
p
+
dr
p
. The removal rate is returned to the overall mass balance equation in ASTEC which describes all
other aerosol transport mechanisms: agglomeration, sedimentation, deposition on walls, convective transfer
between compartments and particle growth due to heterogeneous nucleation.
11.5.1 Inertial capture
Aerosol particles tend to be driven away from a droplet (assumed to have a spherical shape) by the flow
around it. However, if their inertia is large enough, they have trajectories which depart from the
streamlines and, depending on their upstream position with respect to the flow axis, can drive them to
collide with the droplet. This mechanism is called inertial capture. It can significantly enhance collision
efficiency.
In order to calculate the collection efficiency, one must solve equations for a velocity field by a numerical
simulation, and with the conditions that the particle is launched far upstream at a distance y from the
droplet axis and with no velocity relative to the flow. Due to axial symmetry, this problem is two
dimensional. Depending on y, a trajectory may result or not in capture. Starting from a low value, y is
increased until there is no more capture for y = y
c
.

NEA/CSNI/R(2009)5
351
The collection efficiency is defined by:
2
cp
y )K,Re( =ε
(28)
where K is the Stokes number characterizing the non-dimensional stopping distance of the particle
and Re is the droplet Reynolds number. The dependency of ε
p
in equation (28) is contained in the
equations describing the flow field and the particle trajectories. The size of the particles does not appear
since, in the numerical simulations, only point particles are considered.
[6] performed numerical simulations of particle trajectories for various particle sizes and droplet
Reynolds numbers. They used computations of the flow field previously performed by [7]. Their results
were correlated in the following way for values of K greater than the critical Stokes number:
(H)
1-
tan
2
y
C
π
=
(29)
with : H = B
0
+ B
1
Z + B
2
Z
2
+ B
3
Z
3
,
F = Ln(Re), G = A
0
+ A
1
F + A
2
F
2
, K
0
= exp(G), A
0
= - 0.0658,
A
1
= - 0.3254, A
2
= 0.0193, Z = Ln(K/K
0
) , B
0
= 0.1465
B
1
= 1.302 B
2
= -0.607 B
3
= 0.293
y
c
goes to zero at the critical value of K: K
cr
∼ 0.9 K
0
. The values of the coefficients A
0
, A
1
, A
2
have
been modified with respect to those in the paper by Beard and Grover in order to have a better fit with the
numerical simulation results for low values of y
c
, rather than for high values. This choice was made for two
reasons: firstly, in the CARAIDAS experiments, the sizes of the droplets and aerosol particles are such that
y
c
is in most cases much less than 1, and rather close to 0.1. The second reason is linked to reactor accident
simulations: at the beginning of spray activation, approximately during the first ten minutes, the largest
particles, having a collision efficiency close to 1, are removed. The decay rate of the aerosol concentration
is then depending on the collision efficiency of the remaining smaller particles.
11.5.2 Interception
The size of the aerosol particles (interception effect) cannot be taken into account in the numerical
simulations of the inertial deposition mechanism. Owing to the fact that this effect appears to be
non-negligible only for low values of y
c
, many authors, [8, 9, 10], have i.e., for particles which follow the
streamlines. It can then be shown that the collection efficiency is linked to variation of the stream function
near the sphere surface. The non-dimensional particle size a (ratio of the particle diameter to the droplet
diameter) is usually quite small, typically less than 10
-2
, so that there is a large difference between values
for potential and viscous flows. Consequently, an interpolation for any Reynolds number from viscous
flow to potential flow using these two formulas does not make sense.
A new model has been developed with the aim at taking into account the case of particles having a small
but non-zero inertia and a finite size. This model comprises providing an approximate analytical solution
of the velocity-field equations for small values of K. The analytical solution allows inclusion of the
interception effect (boundary condition on the sphere). Owing to the small values of y
c
for such particles,
approximate expressions of the streamline equations and flow velocity field close to the sphere were used:
it was assumed that the particles depart from the streamlines only in the vicinity of the sphere surface. The
following expression is then obtained:

NEA/CSNI/R(2009)5
352
3
K 4
a (1) f
3
4
i
α
+
′
=ε
, (30)
where
) (1) f 4 (1) f
3
2
- 1 (
20
1
2
′
+
′
=α
and
0.312
1.2855
0.40.307
0.7856
0.434
Re Re
2
3
-Re - Re (1)f2 +=
′
One should recall that this expression is valid only for small values of K and y
c
. For values of K larger than
the critical Stokes number and y
c
larger than 0.2, the Beard and Grover formulation (Equation 29) can be
used with confidence. In order to have continuity between these two formulations, a simple transition is
used:
Grover & Beard : , formula : ) - 1 )( - 1 ( - 1
pipi
)30(
εεεεε
=
m
(31)
11.5.3 Brownian diffusion
This collection mechanism is important with respect to particles that are transported by the flow close to
the droplet surface and then can reach it by Brownian motion. A formulation due to [11] is implemented in
ASTEC. According to this, the collection efficiency is:
U
D
8
B
B
Φ
π
=ε
∞
(32)
D
B
is the usual Brownian diffusion coefficient given by the Stokes-Einstein formulation.
Han et al. [11] derived the above formulation by solving the diffusion-convection equation with an
approximate description of the flow field, assumed to be potential, near the sphere. So, to be rigorous, it is
not suitable for low values of the Reynolds number. Anyway, this mechanism is weak, except for very
small particles.
11.5.4 Phoretic capture
This mechanism is due to the phoretic
motion of particles under the action of a strong temperature gradient
between the atmosphere and the droplets (thermophoresis), or to their convective motion due to fast steam
condensation, this convective motion being reduced by an inverse phoretic motion occurring at the same
time (diffusiophoresis). It may be efficient in the upper part of the containment, where droplets have not
reached thermal equilibrium. In terms of a mass transfer coefficient analogous to a velocity, the collection
efficiency is expressed as, [5]:
∞
=ε
U
V 4
Ph
Ph
(33)
since V
Ph
is a deposition velocity averaged over the droplet surface, as in the following correlations:

NEA/CSNI/R(2009)5
353
In the case of thermophoresis, this is given by:
T
K - V
TAPh
η
=
∇ T (34)
K
TA
is a factor depending on the ratio of the atmosphere thermal conductivity to particles thermal
conductivity, and on the ratio of the molecular mean free path to the particles radius, derived by [12]. The
temperature gradient ∇T between the gas and the droplet is derived by using the heat transfer coefficient.
In the case of steam condensation, this is given by the [13] theory:
s
2
s
asss
ss
Ph
m
M )X-(1 M X
M X
V
ρΦπ
+
=
&
(35)
The second term on the right hand side of the equation is the Stefan flow velocity, [14]. The condensation
rate is derived from the mass transfer coefficient. The first term in the right hand side of the equation
reveals the drift velocity with respect to the Stefan flow (diffusiophoresis).
The removal rate in a compartment and for a particular aerosol size class, which is returned to the aerosol
mass balance equation in ASTEC, is calculated as shown by formula (27), which requires knowledge of
the elementary collision efficiency. The latter is expressed as:
BPhm
) - 1 )( - 1 ( - 1 ε+εε=ε
(36)
11.6 Gaseous Iodine Removal by Sprays
It is well known that gaseous iodine, particularly its molecular form I
2
, may be present in the containment
atmosphere during a severe accident. The suppression of this form of iodine by spray water is an important
issue because about 10 % of it would not be trapped by sand filters in the case of emergency containment
depressurization. Moreover, in the long term, it can be transformed into methyl iodide by interaction with
the painted surfaces, and the latter would be trapped neither by the sand filters nor in the extraction line.
The interaction of gaseous iodine with a droplet involves mass transfer in the gas phase, interfacial
transfer, mass transfer in the liquid phase and chemical reactions and speciation within the droplet. These
mechanisms depend mainly on the flow around the droplet, on the convective flow inside the droplet, on its
temperature, and on the droplet pH. Moreover, the capture efficiency is very dependent on the iodine
concentration in the gas phase. It is not possible to describe rigorously all these mechanisms unless one
uses an internal meshing of the droplet, which is not compatible for a severe-accident code application.
Therefore, a simple model has been proposed for the molecular iodine removal (CH
3
I is not considered)
which is, however, able to give predictions in satisfactory agreement with the experimental data, namely
those of the CSE programme, [15].
In this scheme, the capture process involves the following steps:
gas phase transfer: J = k
g
(C
g
–C
ig
) (37)
interfacial equilibrium : C
iw
= p(T)C
ig
(38)
liquid phase transfer: J = k
w
(C
iw
–C
w
) , (39)

NEA/CSNI/R(2009)5
354
and chemical reactions in the bulk liquid:
I
2
+ H
2
O ↔ HOI + I
-
+ H
+
(40)
HOI ↔ OI
-
+ H
+
(41)
3HOI ↔ IO3
-
+ 2I
-
+ 3H
+
(42)
2I- +1/2 O
2
+2H
+
↔ I
2
+ H
2
O (43)
The underlying assumption (and main simplification) in this scheme is that the mass transfer in the liquid
phase takes place in a very narrow area near the droplet surface and that everywhere else the
concentrations of different species are rapidly homogenised. Other assumptions are that thermodynamic
interfacial equilibrium is reached instantaneously, the water pH is maintained constant and the transfer is
quasi-stationary. Furthermore radiolytical reactions are not taken into consideration. In the case of
condensation on or evaporation from the droplet, an additional term in the mass transfer coefficient is
considered in a form due to the Stefan flow.
Nomenclature
NEA/CSNI/R(2009)5
355
References
[1] W. Plumecocq, V.D. Layly, A. Bentaib Modelling of the containment mitigation measures in the
ASTEC code, focusing on spray and hydrogen recombiners International Topical Meeting on
Nuclear Thermal-Hydraulics (NURETH-11), 3-6 October 2005, Avignon, France, 2005
[2] W.E. Ranz, W.R. Marshall Evaporation from drops J. Chemical Engineering Progress, 48
, n°3
141-146, n°4 173-180, 1952
[3] W.C. Hinds Aerosol Technology Wiley Interscience Publication, 1982
[4] D.A. Powers, S.B. Burson A Simplified Model of Aerosol Removal by Containment Spray
NUREG/CR 5966, 1993
[5] W. Plumecocq Etude de l’interaction d’un système d’aspersion liquide avec l’atmosphère
environnante PhD thesis, Université de Provence, Marseille, France, 1997
[6] K. Beard, S. Grover Numerical collision efficiencies for small raindrops colliding with micron size
particles Journal of the Atmospheric Sciences, 31, 1974
[7] B.P. Le Clair et al. A numerical study of the drag on a sphere at low and intermediate Reynolds
numbers Journal of the Atmospheric Sciences, 27, 1970
[8] N.A. Fuchs The Mechanics of Aerosols Dover Publications New York (1989 edition), 1964
[9] C.N. Davies Aerosol Science, Academic Press, 1966
[10] G.M. Hidy, J.R. Brock The dynamics of aerocolloidal systems 1, Pergamon Press, New York, 1970
[11] R.J. Han, O.R. Moss, B.A. Wong Derivation and application of an analytical solution to the mass
transfer equation to the case of forced convective flow around a cylindrical and a spherical particle
with fluid surface properties Journal of Aerosol Science, 27 n° 2, 1996
[12] L. Talbot et al. Thermophoresis of particles in a heated boundary layer Journal of Fluid Mechanics,
101 (4), 1980
[13] L. Waldmann, K.H. Schmitt Thermophoresis and Diffusiophoresis of Aerosols, Chap. 6 of Aerosol
Science, Edited by C.N. Davies, Academic Press, New York, 1966
[14] J.G. Collier, J.R. Thome Convective boiling and condensation 3
rd
edn. Oxford Clarendon Press,
1994
[15] A.K. Postma, L.F. Coleman Effect of continuous spray operation on the removal of aerosols and
gases in the Containment Systems Experiment, BNWL 1485, 1970
NEA/CSNI/R(2009)5
356
NEA/CSNI/R(2009)5
357
12. APPENDIX 4: Overview of Filtration Devices
Ref. [1] provides a detailed account of history of aerosol filtration and gas adsorption development. This
section briefly summarises the historical development.
12.1 Nuclear Aerosol Filtration
Filtration of airborne aerosol particles is relatively new and goes back to the Second World War. In the
early days of World War II, the British troops realised that the German mask canisters were equipped with
better filter papers and delivered them to the U.S. Army Chemical Warfare Service Laboratories (CWS) in
Edgewood, Maryland [2]. The German filter paper was made of fine asbestos dispersed in esparto grass
and had unusually high particle retention characteristics, acceptable resistance to airflow, good dust
storage, and resistance to plugging from oil-type screening smokes (a deficiency of the resin-wool filters
then used by the British forces).
After some more research and development Americans could generate filter papers made up of northern
spruce sulphite and sulphate pulp (approximately 76 %), cotton waste (approximately 15 %), and Bolivian
Blue crocidolite asbestos (approximately 14 %) with an penetration efficiency of 0.025-0.04 % based on a
methylene blue stain-intensity test procedure [3].
Desire to have more efficient filters solicited the assistance of a number of university and industrial
scientists in the USA in search for better smoke filters. This effort resulted in important U.S. advances in
the theory and technology of aerosol filtration. Up to this time, aerosol filtration theory had developed
almost exclusively as an offshoot of water filtration knowledge. To meet then-current military
requirements, however, researchers such as Irving Langmuir [4] examined the physical basis for particle
retention on fibres or small granules. Langmuir concluded that the principal mechanisms involved were:
(1) interception, which affected suspended particles of sizes substantially greater than 1.0 µm in diameter
when moving through a devious flow path in a bed of porous material; and (2) diffusion, which affected
suspended particles with diameters substantially smaller than 1.0 µm
4
. His analysis, later modified by
Ramskill and Anderson [5] to include inertia, indicated that the combined effects of these forces on a
particle would be minimal when the particle was 0.3 µm in diameter. Langmuir advised testing gas mask
filters with smoke of this particle size to determine their minimum retention efficiency and indicated that,
when particles with diameters greater or smaller than 0.3 µm were present during field use of the gas mask,
they would be removed at higher efficiencies than the test particles.
After the war, Victor LaMer [6] of Columbia University performed many experiments to further examine
Langmuir's theory of a minimum filterable particle size, concluding that efficiency declined as particle size
decreased below 0.3 µm. Subsequent studies showed that other forces should also be taken into account
(particle inertia, flow rate, naturally occurring electrostatic charges on particles and filter media) to
determine particle size dependent collection efficiency. Methods to generate test aerosols and standardised
testing procedures were developed for rating ultra-high-efficiency (i.e., absolute) filters [7].
12.1.1 Development of the high-efficiency particulate air (HEPA) filter
The need for high efficiency particulate air (HEPA) filter stamp from requirements for protection of
operational headquarters against chemical warfare agents and where wearing of an individual gas mask

NEA/CSNI/R(2009)5
358
was impractical. A mechanical blower and air purifier known as a “collective protector” filter unit
containing the same filter paper used for the gas mask canister smoke filter but refabricated into a filter
constructed of deep pleats separated by a spacer panel and sealed into a rigid rectangular frame using
rubber cement. The spaces between the teeth of the comb-shaped separators provided air passages to the
depths of the pleats and were inserted front and back in alternate folds to direct contaminated air in and
clean air out (Fig. 12.1-1 adapted from Ref. 1).
These units were called collective protector filters and were used also in the Manhattan Project and later by
the U.S. Atomic Energy Commission (AEC) after some adaptation to confine airborne radioactive particles
in the exhaust ventilation systems of experimental reactors, as well as for most other areas of nuclear
research. In this application, they were known as AEC filters or simply nuclear filters.
Fig. 12.1-1 A typical HEPA filter design
In recognition of their unusually high retention efficiency for very small particles, these collective
protector filters were also known as absolute, super-interception, and super-efficiency filters. The most
widely used name, however, was HEPA filters, an acronym coined by Humphrey Gilbert, a former
Manhattan Project safety engineer, from the title of a 1961 AEC report called High-Efficiency Particulate
Air Filter Units, Inspection, Handling, Installation [8]. A HEPA filter was defined as a throwaway,
extended-medium, dry-type filter with: (1) a minimum particle removal efficiency of 99.95 % (later raised
to 99.97 %) for a 0.3-µm monodisperse particle cloud; (2) a maximum resistance (when clean) of 1 inches
water gauge (in.wg) when operated at rated airflow capacity; and (3) a rigid frame [now called “casing” in
American Society of Mechanical Engineers (ASME) AG-1, Code [9] on Nuclear Air and Gas Treatment]
extending the full depth of the medium
. HEPA filters have proven to be extraordinarily effective, reliable,
and economical devices for removing radioactive and nonradioactive submicrometer-sized particles at a
high rate of collection efficiency.
The first nuclear reactor fitted with effluent high-efficiency air filters is believed to have been the
graphite-moderated, air-cooled unit at Oak Ridge National Laboratory (ORNL) in Oak Ridge, Tennessee.
The initiating event was the discovery in 1948 of radioactive particles up to 600 µm in size on the ground
around the reactor stack. A reinforced concrete filter house was constructed to prevent further emissions
[10].
Along the years the filter materials have been further developed to address fire issues, higher loading and
retention, the HEPA filters were further improved in the USA and Europe for higher flow rates, resistance
NEA/CSNI/R(2009)5
359
to wetting and radiation. Further design improvements have been made to facilitate easy inspection and to
address emerging stringent new standards and quality control for filters especially in nuclear service use.
12.1.2 Challenges for test procedures
The wide diversity of aerosols generated in the nuclear industry raises an important question regarding the
relevance of the qualification test procedures utilised. For example, the aerosols predicted to be present
inside the confinement vessel of a power reactor following a loss-of-coolant accident (LOCA) are certain
to be very different from the test aerosols. The filter efficiencies observed during the standardised
qualification tests performed may not necessarily produce the same results that will be obtained during an
accident. Filtration efficiencies during an accident may be better or worse, depending on the characteristics
of the aerosol challenge. However, passing a standardised qualification test gives reasonable assurance that
the filters have been produced from high-quality components and carefully assembled to exacting
standards. Therefore, the standard qualification test results should be viewed as an index of merit (an
indication of quality) rather than a quantitative description of filter efficiency under unknown or ill-defined
operating conditions.
12.1.3 Demonstrated safety by the use of HEPA filters
The value and effectiveness of correctly designed and installed nuclear-grade aerosol filtration systems are
illustrated by the very different events that took place at the Three Mile Island-2 (TMI-2) and Chernobyl
reactors. During the March 1979 accident at TMI-2 involving substantial core damage causing release of
fission products and aerosols, it was determined after the accident that two filter systems in the auxiliary
building prevented essentially the release of all of the particulate material and the bulk of the radioiodine to
the environment [11]. Consequently, release of radioactive particles to the environment was negligible.
The outcome was very different, however, during the April 1986 accident involving core disruption and
subsequent fire at Chernobyl Unit 4, where engineered safeguards did not include complete confinement
with air filtration systems. The widespread apprehension caused by that accident is likely to produce a
demand for still higher collection efficiency and greater filter resistance to internal disruptive events (fires,
explosions) and to external natural disasters (earthquakes, tornadoes).
12.1.4 Deep-bed sand and glass fibre filters
Although HEPA filters came to dominate aerosol confinement for most nuclear applications from the
beginning there were other filter innovations of note. When a high-activity level due to radioactive
particles emitted from the chemical processing ventilation stacks was detected at the Hanford, Washington,
site in 1948 a filter based on the chemical engineering practice on deep beds of graded granular was used
for the first time for the nuclear application. The sand filter construction closely followed the deep-bed,
graded-granule techniques. These filters had collection efficiencies for particles greater than 0.5 µm that
compared favourably with the best fibrous filters then available.
Rapidly emerging glass fibre technology during the 1940s and 1950s shifted attention to the use of very
deep beds (23 cm or more) of curly glass fibres in combination with HEPA-quality final filters as a
satisfactory substitute for sand filters when treating gaseous effluents from chemical operations [12].
There has been interest in sand filters for emergency confinement venting for light water reactors. An
installed Swedish confinement venting system known as FILTRA features large concrete silos filled with
crushed rock. These silos were designed to condense and filter steam blown from the confinement and to
retain at least 99.9 % of the core inventory [13]. Later designs for confinement venting utilised wet systems
to remove gaseous radioiodine.
NEA/CSNI/R(2009)5
360
12.1.5 Brief history of gas adsorption
In a nuclear accident, especially involving core damage substantial amounts gaseous fission products may
be released directly from the degrading core and may additionally be produced, in the case of iodine, as a
result of chemical reactions.
Wet scrubbing and adsorption are the main filtration mechanisms adopted for the nuclear applications
since the late 1940s using the practices developed for the chemical and process industry as well as the
technologies developed for the military applications for removing a wide range of toxic substances from
breathing air. Along the years not only the filtration aspects of gaseous fission products were emphasised
but also utilization of chemical means for long term retention have been given importance.
Adsorbents of various types, both impregnated and unimpregnated, have become widely used since the
First Word War (WWI). Activated carbon derived from nutshells was used in the early days. Later, the
activated carbon used in the service gas mask was derived from coal and impregnated with metals that
catalyse reactions with gas warfare agents. The theoretical basis for adsorption processes was greatly
advanced by the need to develop gas mask applications during WWI, and Langmuir [1] made an early
theoretical analysis of physical adsorption. Thus, there was a considerable body of knowledge available on
the application of adsorbents, especially for activated carbon, when the nuclear industry developed a need
for this technology.
Iodine releases to the atmosphere in the event of a reactor accident became a major concern as the nuclear
industry began its rapid expansion during the early 1960s, and attention focused on iodine removal during
normal and abnormal conditions at ambient and elevated temperatures. At ORNL, studies [1] were
conducted on activated carbon beds for the hold-up of radioactive fission gases generated during the
operation of nuclear reactors and during nuclear fuel reprocessing. The principal area of interest was
delaying release until short-half-life isotopes decayed to levels that were acceptable for release. This
approach utilised conventional theoretical plate equations.
Iodine in its many chemical forms is probably among the most extensively studied fission products
produced in the nuclear industry. The generation, release mechanism, properties, forms, trapping and
retention behaviour, and health effects of iodine-131 have been the subject of numerous studies, but a
comprehensive understanding of the significance of its release to the environment and integration of the
chemical technology into protection technology may remain incomplete in some aspects. The technology
associated with the removal and retention of all iodine isotopes is similar to that for iodine-131, but interest
in removal efficiency has shifted somewhat toward the importance of long-term retention with the
increasing half-life of the iodine isotope.
Control of iodine emissions from chemical processing of spent nuclear fuel was initially done by liquid
scrubbing using caustic solutions, and sometimes with the addition of sulphate salts, but retention
efficiency by scrubbing seldom exceeded 90 %. To improve iodine retention efficiency for dissolver offgas
cleaning, activated carbon beds were added to the caustic scrubber at DOE’s Idaho Chemical Plant in 1958
[1]. The use of Silver-plated Fiberfrax fibres and silver-plated copper filaments were also investigated [1]
to reach higher removal efficiency of iodine for use as a combined particulate filter and iodine retention
device.
The application of adsorbents for noble gas retention was developed at ORNL [1]. The concept involves
self regeneration of the adsorbent due to decay of the noble gases to solid daughter products as they pass
through very deep adsorbent beds that require a long time for passage and results in the successive
extinction of noble gas radioisotopes (i.e., those with the shortest half-lives disappear first). This
technology is generally used to decontaminate all noble gas isotopes (except krypton-85 because of its
NEA/CSNI/R(2009)5
361
relatively long half-life - nearly 11 years). The process is particularly well suited to treat BWR offgas
streams and was applied first at the nuclear power plant Gundremmingen (KRB) site in Germany [1]. The
first BWR installation in the United States was the Interim Offgas System at the Vermont Yankee Plant
[1]. It was succeeded by the Advanced Offgas System at the same site. Earlier technology involved
ambient temperature systems. Cooled or refrigerated systems were later designed by the General Electric
Company.
Volatile metal compounds such as ruthenium and technetium can be removed from gas streams by
adsorption, but a solid-surface-supported chemical reaction is often necessary for good retention. Removal
technologies for carbon-14 and tritium also involve the use of adsorbents, either as collecting agents or as
catalysts for conversion to other, more easily removed compounds.
12.2 Type of Filters in Use
The requirements for the design of a filter system in removing the fission products depend on the thermal
hydraulic conditions (temperature, pressure, humidity level or steam condensation, flow rate through the
filter system) and concentration of the fission products in gaseous and aerosol form. The severity of the
conditions imposed by the normal operational conditions or accidents (design basis or severe accidents
involving core damage) produce the challenge for the design of the systems.
12.3 Normal Operation and Design Basis Accidents
During operational conditions many containments are kept subatmospheric in order to avoid any accidental
release of even small activity into the environment. Ventilations systems, depending on the design and
regulatory requirements, may contain parallel trains of filtration systems. A typical train contains the
following sequential components: (1) a moisture separator to remove entrained water droplets, (2) a heater
to control relative humidity (RH) when the RH of the air entering the carbon adsorber exceeds nominally
70 %, (3) prefilters, (4) HEPA filters, (5) a charcoal adsorber, (6) HEPA filters downstream of the
adsorbers, and (7) a fan. Fig. 12.3-1, adopted from Ref. 1, displays a typical filtration unit. Ducts, valves,
and dampers are also included for system isolation and flow control, as well as related instrumentation.
When the moisture and dust loads are low for all credible operating modes, the prefilter and moisture
separator may not be required. The carbon or charcoal adsorbers may be impregnated or unimpregnated.

NEA/CSNI/R(2009)5
362
Fig. 12.3-1 A typical air cleaning system
The source of activity in the containment is due to release of dissolved activity (e.g., iodine) in the primary
coolant water with a leak from the circuit. The source of the activity in the circuit could be due to leaking
fuel elements or due to iodine spiking. The maximum permissible activity level in the circuit and in the
containment is defined by regulations. Most currently operating reactors keep coolant concentrations of
radionuclides orders of magnitude below the technical specifications or regulatory limits.
By definition design basis accidents (DBA) involving loss of coolant foresee failure of certain number of
fuel cladding, which then causes the release of noble gases and volatile fission products (iodine, cesium),
into the primary coolant water. The release of the primary coolant water into the containment causes the
activity release into the containment. If the accident is a containment by-pass accident then the activity is
released directly either into the auxiliary/reactor building (V-sequence) or through the broken steam
generator tube(s) (SGTR) into the steam generator secondary side and after some scrubbing in the
secondary water, eventually directly into the environment. Loss of coolant accidents due to SGTR with few
tube failure normally do not cause any fuel cladding failure but a certain fraction of the dissolved activity
in the primary circuit at the time of the accident may be released into the environment in form of gas,
and/or through droplet or water flow depending on the location of the broken tube(s).
Containment or auxiliary (reactor) building filtration systems are designed to avoid any substantial release
of activity transported by aerosol particles and gaseous iodine. Of course the main assumption at the
background of this statement is that the containments are isolated and there are no uncontrolled leak paths.
NEA/CSNI/R(2009)5
363
12.4 Brief Review on Mechanisms of Filtration
Particle removal from a gas depends upon it making contact with, and adhering to, either a liquid or solid
surface. These surfaces can consist of such elements as fibres, sand grains, pieces of gravel, or water
droplets, to mention a few. It is the nature of these surfaces that characterises the collection device. As a
result of the filter test program in the ACE international project a review report was prepared [16] to
provide the main mechanisms and the formulation of each mechanism based on the available literature
information. The following sections briefly summaries the work published in [16]. Since the limited
release of this report in 1992 there has been no further progress made in the theoretical area for
modelling or understanding the mechanisms.
The mechanisms, which will bring an aerosol particle into contact with a collection surface and which will
remove them from a gas bubble are in detail introduced in the previous chapters of the SOAR. The ones,
especially important for the filtration, are repeated very briefly below:
I Interception
Deposition by interception occurs when a particle follows a streamline that comes within one
particle radius of the collection body. This capture, which is illustrated in Fig. 12.4-1, occurs
because of the finite size of the aerosol particle.
II Inertial impaction
Deposition by inertial impaction occurs when a particle, due to its inertia, is unable to follow a
curving streamline. It will then cross other streamlines and impact on the collecting body as
illustrated in Fig. 12.4-2.
III Brownian diffusion
Deposition by Brownian diffusion occurs when a particle, due to collisions with gas molecules,
deviates from the path of a streamline, which would not normally result in deposition, and impacts
on the collection surface as illustrated in Fig. 12.4-3.
IV Sedimentation
Deposition by sedimentation occurs when gravity acting on the aerosol particle causes it to impact
on the collection surface.
V Thermophoresis
Deposition by thermophoresis occurs when the collection surface is at a substantially lower
temperature than the aerosol carrier gas. The particle moves in a direction down the temperature
gradient in the gas because it is being hit by more energetic molecules on the hot than the cold side.
VI Condensation
Deposition by condensation on a collection surface results from two independent mechanisms,
diffusiophoresis and Stefan flow. Diffusiophoresis refers to the motion of an aerosol particle in a
concentration gradient in a direction from the heavier towards the lighter molecules. Stefan flow
refers to the convective flow of condensing gas towards the cold surface. This flow carries the
aerosol particles along by Stokes drag. For example, if there is a mixture of two gases, which have
the same molecular weight, and one of them is condensing on a surface, there would be no
diffusiophoresis. The aerosol particles would, however, be carried to the surface by Stefan flow
alone.
VII Pool scrubbing
The mechanisms, except the interception, listed above occur within the bubble boundary and under
the effect of gas circulation or no circulation conditions in the bubble.

NEA/CSNI/R(2009)5
364
The relative importance of these mechanisms depends upon the aerosol characteristics, conditions of the
aerosol transport, and the system boundary conditions. For each mechanism it is possible to define single
collection body efficiency, η
o
, as the ratio of the cross section area bounded by the limiting streamlines far
upstream of the collection body, to the projected area of the collection body normal to the flow far upstream. In
Fig. 12.4-4, this is defined as y/r for an infinite cylinder, and (y/r)
2
for a sphere. Clearly, the overall efficiency
for an assemblage of bodies is a function of the single body efficiency.
Fig. 12.4-1 Single body collection by impaction [10]
Fig. 12.4-2 Single body collection by impaction [10]

NEA/CSNI/R(2009)5
365
Fig. 12.4-3 Single body collection by diffusion [23]
Fig. 12.4-4 Illustration of the collision efficiency
12.5 Characterisation of Filter Performance
There are several parameters currently in use to describe the effectiveness of a filtration device. These are,
however, all based on the mass of material injected to a device, m
in,
and the mass of material exhausted,
m
out
In the nuclear industry the most commonly used parameter is the Decontamination Factor, DF, which
is defined as the ratio of the injected to exhausted mass:
Intimately related to the DF is the penetration, Pt
,
which is defined as the ratio:

NEA/CSNI/R(2009)5
366
This is just the inverse of the DF. The collection efficiency, η, is defined the ratio of the collected to the
injected mass. This can be written in terms of the injected and exhausted masses as:
For most filtration devices, the efficiency of collection depends strongly on the particle size. Hence it is useful
to introduce the concept of a "fractional efficiency" where the definitions above apply for particular particle
size ranges. This definition introduces a difficulty for processes where the particles change size within the
filtration device. For example, hygroscopic particles can grow substantially [17] in wet scrubbers. In this
situation, the amount of exhausted mass in a particular size range must be based on the inlet size
distribution. Unfortunately, this is impossible to do experimentally, where only inlet and outlet size
distributions are measured, but the inlet and outlet particle concentrations in each size range cannot be
related. The only ways to determine this information are to either use aerosols, which do not grow, or less
ambiguously, inject only monodisperse aerosols.
The penetration can be quantified on the basis of a one dimensional filtration model as illustrated in Fig.
12.5-1.
Fig. 12.5-1 Scheme of a one-dimensional filtration model
If the flow of aerosols through a control volume of length dz is considered and additionally a deposition
velocity v
dep
and a deposition area of P
dep
dz are postulated, a mass conservation equation for aerosols can
be written as:
and after the integration as:

NEA/CSNI/R(2009)5
367
These expressions for overall penetration or efficiency apply to all the filters considered subsequently.
12.6 Cut Diameter Method
Lapple and Kamack [18], and Semrau et al. [19-21] have suggested that there is a unique power law
relationship between efficiency and pressure drop across any scrubber. According to Semrau et al
, venturi
scrubber energy consumption determines collection efficiency. Calvert [22] found that the aerosol capture
efficiencies of various designs of commercial wet scrubbers depend on the energy dissipation per unit
volume of gas in each system. Jepson [24] has suggested that the success of the energy dissipation
correlation is due to the fact that the area of the gas-liquid interface is proportional to the two-phase
frictional pressure loss. Calvert established that the "50 % cut diameter", d50, of a given scrubber for a
given lognormal particle size distribution could be correlated to the gas-phase pressure drop or power
input to the scrubber. As can be seen from Fig. 12.6-1, the higher the energy dissipation per unit volume of
gas, the smaller the 50 % cut diameter for any given class of filter.
Fig. 12.6-1 Representative cut diameters as a function of pressure drop for several scrubbers
Calvert developed an approximate graphical method [25] to compare various designs of wet scrubbers on
the basis of d50 vs. gas pressure drop. Calvert's correlation assumes that impaction is the main mechanisms
of aerosol capture and that the aerosol size distribution is lognormal. Most scrubbers that collect particles
by inertial impaction obey [25]

NEA/CSNI/R(2009)5
368
where B usually has the value, two. Integration of this expression over several lognormal particle size
distributions yields the graphical relationships shown in Fig. 12.6-2. The overall penetration, Pt, for the
entire size distribution is plotted against the ratio of the 50 % cut diameter, d50, to the mass median
diameter d
pg,
with σ, the geometric standard deviation, as a parameter. Fig. 12.6-2 can be used in
conjunction with Figure 15 to select a scrubber with a required efficiency.
Hilliard et al. [26] used Calvert's method to correlate the 50 % cut diameter with the gas pressure drop
(Pool depth) of a submerged gravel scrubber. Morewitz [27] showed that both suppression pools and the
submerged gravel scrubber appear to have cut diameter vs. pressure drop characteristics for insoluble
aerosols similar to either a gas atomised scrubber [22] or a washed, high void fraction bed of 100 µm
diameter packed fibres. He noted that the 50 % cut diameters decrease with increasing pool depth and that
soluble particles at a given depth have smaller cut diameters than insoluble ones. This latter effect is
probably due to increase in size of soluble particles as they pick up water vapor.
Fig. 12.6-2 Overall penetration as a function of cut diameter and particle parameters
12.7 Fibrous Filter
Filter media for gas filtration consist of an assemblage of fibres, which are woven or loosely packed. The
major performance criteria are collection efficiency, pressure loss, and lifetime. For filtered vented
containment application the most important is collection efficiency, since the driving pressure is from the
containment pressurization, and most probably there will be only one nonrepetitive use.
The particle collection efficiency is usually calculated by considering the particle removal by one fibre, and
then summing over all fibres [23, 28, 29]. Applying Equation for overall penetration or efficiency
(introduced in the previous section) to this geometry, the efficiency of a filter at the beginning of use, i.e.
before a layer of particles has formed is given by:

NEA/CSNI/R(2009)5
369
where η
0
is the single fibre collection efficiency modified for the effects of neighbouring fibres. This
equation is not controversial, however, the entire crux in determining the overall filter efficiency boils
down to the determination of the single fibres collection efficiency. The differences between most authors
boil down to how to account for the effects of neighbouring fibres, and how to account for the coupled
deposition mechanisms for the polydisperse particles.
Kirsch and Stechkina [28] suggest that convective diffusion, η
D
, and interception, η
L
be accounted for
additively and that deviations from superposition be accommodated through the use of an interaction term
η
DI
as follows:
where
from theoretical arguments it is possible to write
and
where the hydrodynamic factor for cylindrical arrays is given by
Kirsch and Stechkina [28] recommend the following relationships to determine the effects of the filter
inhomogeneity:
where
is the dimensionless drag force on the filter for Kn = 0. It should be pointed out that these
relationships apply to clean filters only, and that the actual efficiency of the filter improves as the
particulates clog the filter.
Another theoretical approach for the prediction of filter behaviour is to calculate particle trajectories
through regular cylindrical arrays representing filter fibres [30]. These methods have the advantage of being
able to directly couple the various deposition mechanisms, however they cannot handle mats of randomly
distributed fibres. Thus these models are at best qualitative tools to understand the mechanisms of
filtration, however, for application to real systems it is necessary to obtain actual measurements of filter
performance.

NEA/CSNI/R(2009)5
370
12.8 Granular Beds
Dry granular beds have been used for filtration of particulates for over a century [31], but only in 80’s have
mechanistic models for their filtration efficiency been developed. These are based on the single grain
capture efficiency, extended to a bed of particular size. The particle collection efficiency is usually calculated
by considering the particle removal by one grain, and then summing over all grains. The penetration of a
granular bed filter obtained from Equation for overall penetration or efficiency is given by:
where η
g
is the single grain-capture efficiency, which is analogous to the single fibre-capture
efficiency used for fibrous filters. The problem of a granular bed filter reduces to finding appropriate
expressions for η
g
.
Goren and co-workers [32,33] have performed experiments and developed correlations, which permit the
calculation of aerosol, capture efficiencies in granular beds. These correlations cover a wide range of
aerosol size, grain size, gas velocity, and depth of filter bed. Goren [32, 33] mentions the following
expressions for the individual deposition efficiencies.
Brownian diffusion,
Sedimentation,
Interception,
Impaction,
Since the flow around the grains are not well approximated by Stokes flow it is necessary to introduce a
hydrodynamic factor into the collection efficiencies to accommodate this shortcoming. Michaels and
Goren [33] modified Happel's [34] expression, which was derived by using a cell model in low Reynolds
number flow, for high Reynolds number to get
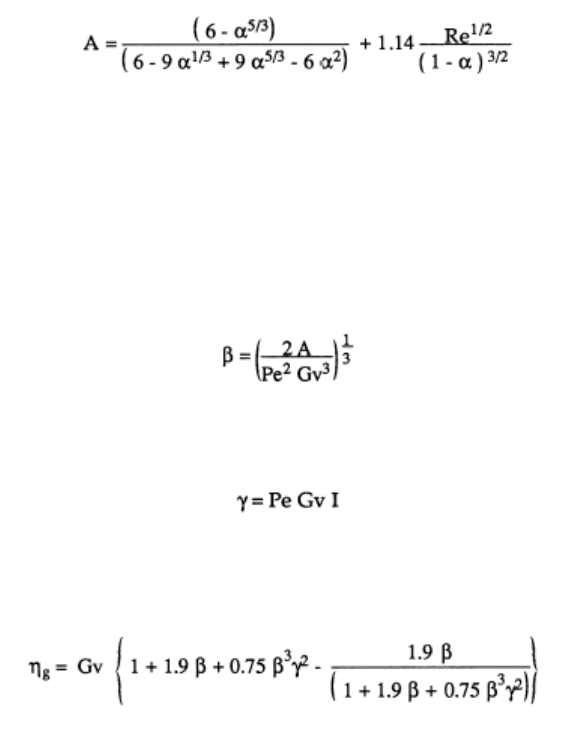
NEA/CSNI/R(2009)5
371
which should be applicable to the entire range of Reynolds numbers. For the ranges of parameters tested, if
the superficial gas velocity is greater than approximately 10 cm/s, the flow is in the impaction-dominated
regime and only that efficiency needs to be used. For superficial gas velocities ranging from 0.1 to 8 cm/s,
both sedimentation and Brownian diffusion dominate. To handle the coupled mechanisms, rather than just
adding them, the following approach is suggested based on the results of numerical analyses.
If
and
are defined then the capture efficiency for combined sedimentation, diffusion and interception can be
written as
Results of this expression as applied to experiments performed on glass spheres are shown in Fig. 12.8-1 and
Fig. 12.8-2 for two different sphere sizes. The agreement is satisfactory however, looking at data points
for particular particle sizes indicate that there are systematic deviations between correlation and
experiments.
For the case when impaction dominates, the comparison between calculation and experiments is shown in
Fig. 12.8-3 for two different aerosol materials. The DOP aerosols are liquid, whereas the KHP (potassium
biphthalate) was solid. The levelling off of the efficiency for the KHP aerosols at high effective Stokes
numbers was attributed to rebounding.

NEA/CSNI/R(2009)5
372
Fig. 12.8-1 Single grain efficiencies for beds of 2.13 mm glass beads
Fig. 12.8-2 Single grain efficiencies for beds of 15.6 mm glass beads

NEA/CSNI/R(2009)5
373
Fig. 12.8-3 Single grain efficiencies in the impaction dominated regime
12.9 Sand Beds
The experiments on which Goren's expressions are based where performed with grains (spherical glass
beads) that were 2 mm in diameter or larger. Sher [35]
applied the expression for efficiency in the
impaction dominated regime to French sand bed filtration experiments reported by Guieu et al. [36]. The
results are shown in Fig. 12.9-1. The effective Stokes numbers of these experiments fall into the
lower range of Goren's experiments where the single grain efficiency levels off and becomes
independent of the effective Stokes number. To match this data, Sher added an arbitrary factor
of 0.0017 to the Goren impaction correlation to get:
This curve is shown in Figure as the "Modified Goren Correlation". Since at these low Stokes numbers the
efficiency is constant it appears that another deposition mechanism besides impaction must dominate.

NEA/CSNI/R(2009)5
374
Fig. 12.9-1 Application of impaction correlation to sand bed data
12.10 Gravel Beds
Ström et al. [37] performed experiments on particle retention in a bed of crushed rock with a stone size
ranging from 25 to 30 mm. These are bigger than the gravel tested by Goren, which did not exceed
19 mm in equivalent spherical diameter. The velocities that these experiments were performed at
were 5, 10, and 20 cm/s, while Goren's tests were performed at 0.2 to 8 cm/s. For the analysis of their
data, Ström et al. used the following single grain efficiencies:
Impaction:
Diffusion:
Sedimentation:

NEA/CSNI/R(2009)5
375
The overall single grain efficiency was then assumed to be simply the sum of the separate effects,
When this expression was applied to the experimental data for dry gravel, the results were very good as
can be seen in Fig. 12.10-1. The deviation between the experiments and calculations was usually less than
a factor of two in the range of 0.3 to 3 µm, mass equivalent diameter. No theory was presented for the
cases involving condensing steam.
Fig. 12.10-1 Observed (-), and calculated (- - - ) penetration for a dry 6 m gravel bed [37]
Goren also analysed the results of his gravel bed experiments [32] with the equations which are
applicable to the sedimentation and diffusion dominated regimes. The main question in such an analysis is
what "effective" grain or packing size should be used. For calculating pressure drop, common practice is to
use the combination d'
G
φ
s
where φ
s
is called the sphericity, and is defined as the ratio of the surface area of
a volume equivalent sphere to the actual surface area of the grain. The Sauter mean diameter d'
G
is
calculated from:
The parameter, d'
G
Φ
s
is usually obtained by fitting measured pressure drops to the Ergun equation [38]
given by:

NEA/CSNI/R(2009)5
376
Pressure drops for beds of spherical glass beads are in excellent agreement with this equation with the
sphericity equal to one. The overall penetration through a gravel bed with depth, H, is
where Φ
F
is defined as the ratio of the projected surface area of a volume equivalent sphere, to
the actual projected surface area of the grain. Mann and Goren [32]
propose that in the absence of other
information, the relationship:
be used. The single grain collection efficiency is obtained from the Ergun equation. Fig. 12.10-2 shows the
agreement between these expressions and the experiments for a gravel bed of size 10 mm. Since the
equivalent sphericities in these expressions were chosen to fit this data, the agreement is not surprising.
Fig. 12.10-2 Single grain collection efficiencies for crushed rock [39]
12.11 Venturi Scrubbers
Venturi scrubbers differ from the previously described devices in that the deposition bodies are composed
of liquid droplets and are not rigidly fixed in place. The key issue of particulate scrubbing is that the
aerosols must be brought into contact with the liquid droplets. In fibrous filters and sand beds, since the
collected particles remain in place, they are susceptible to plugging. When the scrubbing takes place by
water droplets, the material, which is collected, can usually flow away, or be collected in large water tanks.

NEA/CSNI/R(2009)5
377
After the aerosol particles have been collected by water droplets it is necessary to collect these in turn. In
submerged venturi scrubbers this is accomplished by submerging the whole unit in water, and taking
advantage of pool scrubbing to capture the large water droplets. A further advantage of the venturi
scrubber is that the droplets are also useful for gas absorption.
To achieve efficient separation of aerosols from gases, it is helpful to have a high relative velocity between
collectors and aerosols, and to have a high collection area. In venturi scrubbers this is achieved by injecting
water into a high velocity gas stream. This provides a high relative velocity, which is useful for increasing
the impaction efficiency, but more important it causes a break-up of the liquid droplets resulting in very
large surface areas.
There are several reasons why venturis are well suited for venting containments during severe accidents.
In particular, they are very efficient at removing submicron particles, and because water droplets are used
for collection bodies, they are useful for cooling and absorbing hot gases.
A typical schematic geometry for a venturi scrubber is shown in Fig. 2.1-1. The gas has its maximum
velocity in the throat, where the cross sectional area is the smallest. This is the best location to inject
water since it has the highest relative velocity, which would break the water into the smallest droplets.
The gas decelerates in the expansion region since the cross sectional area increases.
Fig. 12.11-1 Schematic diagram of a venturi scrubber
The general expression for penetration in any filtration device is from the expression for the penetration:
For a venturi scrubber, this can be written as [39]
where V
*
refers to the gas volume swept clean of aerosol particles. This is obtained by integrating
over the residence time in the venturi

NEA/CSNI/R(2009)5
378
where u
d
is the droplet capture efficiency. An expression proposed by Calvert [40],
which is often used is
where K is defined as
and τ
P
is the particle relaxation time [41]:
It is at this point necessary to evaluate the relative velocity between the gas and the water droplets. This
can be done by solving the one dimensional momentum equation, where the droplet acceleration is caused
by the interfacial drag. The gas flow is obtained from the steady continuity equation. The droplet
momentum equation is
where the drag coefficient, C
d
, is given by an expression such as [39]
Once a droplet size has been determined, either from a critical Weber number criterion, or a correlation
such as [25] for the Sauter mean drop diameter
it is possible to integrate the momentum equation numerically. In this empirical correlation the units of the
variables are: velocity (cm/s), surface tension (dyn/cm), density (gm/cm
3
), viscosity (poise), and the
calculated diameter (µm).
Typical results for such an analysis are given in Fig. 12.11-2. For this [39] sample calculation the droplet
size was 50 µm, and the particle aerodynamic diameter was 1 µm.

NEA/CSNI/R(2009)5
379
Fig. 12.11-2 Predicted venturi scrubber behaviour
The horizontal axis is the distance from the throat entrance, where the water was injected at zero axial velocity.
The droplets accelerate quickly due to the drag, whereas the gas is decelerating because of the area variation.
After a distance of approximately 0.2 m downstream of the throat, the water droplets are moving faster than the
gas. The particle collection only occurs when there is a net relative velocity between the droplets and the gas,
hence the gas volume that is swept clean of particles levels off at the point where the droplet and gas velocities
are equal. It is interesting to note for this case that each droplet cleans out a gas volume equal to about 1200
times its own volume.
A comparison of a similar calculation with experiment is shown in Fig. 12.11-3, obtained from [42]. It can
be seen that the results are quite encouraging.
Fig. 12.11-3 Comparison of calculated collection efficiency predictions with data of Calvert et al. [43]
12.12 Water Pools
The chapter on pool scrubbing provides the mechanism of aerosol retention and no further specifics
associated with the filters are provided here.
NEA/CSNI/R(2009)5
380
References
[1] DOE handbook, nuclear air cleaning handbook, DOE Technical Standards, DOE-HDBK-1169-2003,
November 2003
[2] H. Gilbert "The High-Efficiency Filter in Nuclear Air Cleaning” 19
th
US Department of Energy / US
Nuclear Regulatory Commission Nuclear Air Cleaning Conference, Seattle, WA, CONF-860820,
National Technical Information Service, Springfield, VA, pp. 933-946, August 1986
[3] G.D. Knight Development of Type 6 Filter Material” Massachusetts Institute of Technology
Memorandum Report No. 142, Project Dlg-4, Chemical Warfare Service Development Laboratory,
Massachusetts Institute of Technology, Cambridge, MA, 1942
[4] I. Langmuir Report on Smokes and Filters, OSRD 865, Office of Scientific Research and
Development, Office of Technical Services, Washington, DC, 1942
[5] E.A. Ramskill, W.L. Anderson “The Inertial Mechanism in the Mechanical Filtration of Aerosols”
Journal of Coloid. Science, Vol. 6, p. 416, 1951
[6] V.K. LaMer “Atomic Energy Commission Report NYO-512” Technical Information Service, Oak
Ridge, TN, 1951
[7] V.K. LaMer, D. Sinclair Portable Optical Instrument for the Measurement of the Particle Size in
Smokes, the ‘OWL’, an Improved Homogeneous Aerosol Generator, OSRD 1668, Office of
Technical Services, Springfield, VA, August 1943
[8] H. Gilbert High-Efficiency Particulate Air Filter Units, Inspection, Handling, Installation AEC
Report TID-7023, National Technical Information Service, Springfield, VA, 1961
[9] ASME (American Society of Mechanical Engineers), Code on Nuclear Air and Gas Treatment,
ASME AG-1, New York, NY, 2003
[10] W.G. Stockdale, J.C. Suddath, W.K. Eister “Control of Radioactive Air Contamination at Oak
Ridge National Laboratory” Paper 11, 3
rd
Atomic Energy Commission Air Cleaning Conference, pp.
55-57, Los Alamos, NM, 1950
[11] R.R. Bellamy “Investigations into the Air Cleaning Aspects of the Three Mile Island Incident” 16
th
DOE Nuclear Air Cleaning Conference, San Diego, CA, National Technical Information Service,
Springfield, VA, pp. 1427-1441, October 1980
[12] A.S. Blasewitz “Dissolver Offgas Filtration,” Second Atomic Energy Commission Air Cleaning
Seminar AEC Report WASH-149, National Technical Information Service, Springfield, VA, 1954
[13] L. Lindau, K. Ellison “Filtered Containment Venting in Sweden” 20
th
Department of
Energy/Nuclear Regulatory Commission Nuclear Air Cleaning Conference, Boston, MA, National
Technical Information Service, Springfield, VA, pp. 695-708, August 1988
[14] M. Merilo, I.B. Wall “Containment Filtration Systems Tests, Summary Report” Electric Power
Research Institute, ACE Phase A, TR-A22, February 1992
[15] S. Güntay, D. Suckow, H. Leute, H. Knuchel, H. Schütt, P. Winkler “SULZER Containment
Venting Filter Verification Experiments” PSI-Report No: 96-04/380, 1996
NEA/CSNI/R(2009)5
381
[16] M. Merilo, H.A. Morewitz Engineering Models for Filtration Systems, ACE-TR-A6, May 1991
[17] M.S. Hoseyni, A.T. Wassel "Growth of Aerosol Particles in a Steam Environment and its Effect on
Removal" Nuclear Eng, & Des., Vol. 97, 103 - 109, (1986)
[18] C.E. Lapple, H.J. Kamack "Performance of Wet Dust Scrubbers" Chem. Engng. Prog. Vol. 51,
110-121, (1955)
[19] K.T. Semrau "Correlation of Dust Scrubber Efficiency" J. Air Pollut. Control Ass. 10, 200-207
(1960)
[20] K.T. Semrau "Practical Process Design of Particulate Scrubbers" Chem. Engng 84, 87-91 (1977)
[21] K.T. Semrau, C.L. Witham, W.W. Kerlin "Energy Utilization by Wet Scrubbers", NTIS, Springfield,
VA, Report EPA-600/2-77-234 (1977)
[22] S. Calvert "How to Choose a Particulate Scrubber" Chem. Eng., Aug. 29, 54 - 68, (1977)
[23] W.C. Hinds "Aerosol Technology: Properties, Behaviour, and Measurement of Airborne Particles"
John Wiley & Sons (1982)
[24] J.C. Jepson "Mass Transfer in Two-Phase Flow in Horizontal Pipelines" AICHE J. Vol. 16, 705,
(1970)
[25] S. Calvert "Scrubbing", Air P o ll u t i on, Ed. A. C. Stern, 257 - 291, Academic Press, (1977)
[26] R.K. Hilliard, J.D. McCormack, A.K. Postma "Submerged Gravel Scrubber Demonstration as a
Passive Air Cleaner for Containment Venting and Purging with Sodium Aerosols -- CSTF Tests
AC7 - AC10" Hanford Engr. Development Lab. Report: HEDL-TME 81-30 (1981)
[27] H.A. Morewitz "The Attenuation of Aerosols Bubbling Through Water Pools" H. M, Associates Ltd.
Report: HMA-2-83 (1983)
[28] A.A. Hirsch, I.B. Stechkina "The Theory of Aerosol Filtration With Fibrous Filters" in
Fundamentals of Aerosol Science, D. T. Shaw, ed., Wiley, New York, 165 - 256, (1978)
[29] G.M. Hidy "Aerosols, An Industrial and Environmental Science" Academic Press, Orlando, (1984)
[30] N. Rao, M. Faghri "Computer Modeling of Aerosol Filtration by Fibrous Filters" Aerosol Sci.
Technol. Vol. 8, 133 - 156, (1988)
[31] R.A. Juvinall, R.W. Kessie, M.J. Steindler "Sand-Bed Filtration of Aerosols: A Review of Published
Information on their Use in Industrial and Atomic Energy Facilities" Argonne National Lab. Report:
ANL-7683 (1970)
[32] L. Mann, S. Goren "Aerosol Capture in Granular Beds in the Sedimentation and Diffusion
Dominated Regimes" Aerosol Sci. Technol. Vol. 3, 195 - 213, (1984)
[33] C. Michaels, S.L. Goren "Aerosol Capture in Particle Laden Granular Beds in the Impaction
Dominated Regime" Aerosol Sci. and Technol.
7
31-46 (1987)
[34] J. Happel, A.I.Ch.E. J. Vol. 4, 197 -201, (1958)
48
NEA/CSNI/R(2009)5
382
[35] R. Sher An unpublished work, conducted for the ACE International Project, 1990
[36] B.S. Guieu, A. Couvrat-Desvergnes, M. Berlin, J. Dufresne "Filtered Venting System for Reactor
Containment Building Operating Conditions and Research and Development Work" IAEA
International Symposium on Severe Accidents in Nuclear Power Plants, Sorrento, Italy, March
21-25 (1988)
[37] L. Ström, J. Chyssler, G. Gebert "Particle Retention in a Bed of Crushed Rock, Under Conditions of
condensing Steam" J. Aeros. Science, Vol. 14, No. 3, p. 225, (1983) and Studsvik Report No.
NW-82/313, (1982)
[38] S. Ergun "Fluid Flow through Packed Columns" Chem. Eng. Prog. 48, 89-94 (1952)
[39] D.W. Cooper, D. Leith "Venturi Scrubber Optimization Revisited" Aerosol Sci. and Technol., 63-70
(1984)
[40] S. Calvert "Venturi and Other Atomizing Scrubbers Efficiency and Pressure Drop" AIChE J., 16,
No. 3, 392-396 (1970).
[41] N.A. Fuchs "The Mechanics of Aerosols" The MacMillan Co., New York, NY (1964)
[42] K.C. Goel, K.G.T. Hollands "A General Method for Predicting Particulate Collection Efficiency of
Venturi Scrubbers" Ind. Engr. Chem. Fund., 16, No. 2, 186-193 (1977)
[43] S. Calvert, D. Lundgren, D.S. Mehta "Venturi Scrubber Performance" J. Air Pollut. Control Assoc.,
22, 529-532 (1972)
Nomenclature
Latin Symbols
A Constant
A
h
Hydrodynamic factor which depends on the Reynolds number
A
c
Cross sectional flow area Adep Deposition area
A
d
Cross-sectional area of droplet
B Particle mobility
C
P
Cunningham slip correction factor
C
d
Drag coefficient
D
F
Decontamination factor
D
*
0
Dimensionless drag force, D / v
f
µ
g
D Drag force
d
d
Droplet diameter
d
f
Fiber diameter
d
g
Grain diameter
d’
G
Sauter mean diameter of grain
d
p
Physical diameter of aerosol particle
d
pa
Aerodynamic mass mean diameter
d
p
50 50 % cut diameter, aerodynamic
DOP Test aerosol, dioctyl phthalate
g Acceleration of gravity
H Filter thickness
I Interception parameter, d
p
/d
f
49
NEA/CSNI/R(2009)5
383
K
H
Hydrodynamic factor
K
n
Knudsen Number
M
in
Mass injected to filtration system
M
out
Mass exhausted from filtration system
m
p
Particle mass
n Aerosol concentration
P
t
Penetration
Pe Peclet Number
Q
g
Volumetric flow rate of gas
Q
L
Volumetric flow rate of liquid
Re Reynolds number
Sh Sherwood number St Stokes number
U
o
Superficial gas velocity
U
d
Droplet velocity
u
g
Gas velocity
v
f
Face velocity
v
dep
Deposition velocity
V
g
Gas volume in filter
V
i
Single grain volume
z Axial distance along venturi from the water injection point
Greek Symbols
α Volumetric solids fraction
∆P Pressure drop
ε Volumetric void fraction of fibrous or granular bed
η Overall collection efficiency
η
0
Single fibre collection efficiency including influence of neighbouring fibres
η
D
Single fibre collection efficiency for convective diffusion
η
d
Individual droplet collection efficiency
η
DI
Single fibre collection efficiency for interaction between diffusion and interception
η
f
Single fibre collection efficiency
η
g
Single grain collection efficiency
η
I
Single fibre collection efficiency for interception
µ Gas viscosity
ρ
d
Droplet density
ρg Gas density
ρ
p
Particle density
ρ Surface tension
τ Residence time
τ
p
Particle relaxation time
ψ Filter inhomogeneity factor
NEA/CSNI/R(2009)5
384
NEA/CSNI/R(2009)5
385
13. APPENDIX 5: Point-by-Point Review of Issues Identified at the 1998 Aerosol Workshop
In the proceedings of the OECD Workshop “Nuclear Aerosols in Reactor Safety” in Cologne, June 1998,
remaining issues identified during the discussions and general recommendations are summarised on pages
4 and 5 [1]. These issues and recommendations are repeated and discussed here from the current point of
view in order to increase the pertinence of the present SOAR rendering the understanding of the progress
described in this SOAR easier.
Circuit behaviour
Ci 1
Circuit thermal-hydraulics are important for vapor and aerosol transport in the circuit. As an
example, three independent calculations for a station blackout sequence differed considerably in
the predict fission product retentions because of difference in predicted recirculation patterns and
local temperatures. It is necessary to improve confidence in predictions for flow paths, velocities
and temperatures in the circuit under severe accident conditions.
Response to Ci 1
This is an observation with general importance for severe accident calculations and in no way limited to
aerosol analyses. Code comparisons in the EC project EVITA [2,3] and continuing in the EC network
SARNET [4] have led to a significant increase in understanding differences between calculations even
when performed with the same code but by different users.
For understanding differences resulting from the use of different codes (and moreover different users) one
needs a thorough understanding of the modelling and numerical approaches inside the code. Such
evaluations are time consuming but are, nevertheless, necessary and should be continued in future with
greater involvement of utilities and vendors (see Cologne recommendation R 1). Chapters 6 and 7 of this
report intend to reinforce the international discussions on this topic.
Ci 2 There is still a need to investigate aerosol deposition in singularities such as valves and beds.
Ci 3 An important removal mechanism in sequences with steam generator tube rupture is flow across
tube bundles. It is planned to perform scale experiments to investigate this and other potential
removal mechanisms.
Response to Ci 3
The international ARTIST programme performed at PSI in Switzerland has addressed this issue. After
termination of interpretation of ARTIST results this issue will have progressed and might be closed.
Ci 4 The ISP-40 exercise results indicate that resuspension is not sufficiently understood for plant
applications. PHEBUS data indicate that reactor aerosols are rather easily resuspended. Measurements
of parameters such as surface roughness, bed porosity, chemistry on the surface and stickiness of the
particles are needed to support the modelling development. There is a need for specific experiments
related to clearly defined accident sequences, if it is required to quantify circuit retention.
NEA/CSNI/R(2009)5
386
Response to Ci 2 and Ci 4
Since 1998 there has been little significant progress made with respect to deposition and resuspension.
Even if some efforts to increase the capabilities of SOPHAEROS (see chapter 4.1.2) have been made, the
fundamental lack of experiments mentioned at the Cologne workshop 1998 is still a problem; furthermore,
it now seems that the experiments performed in the frame of EVAN (see chapter 5.10.2) provide
incomplete information and just for straight pipes.
Ci 5 Experimental work on revaporisation is scarce; theoretical and experimental development are
both necessary to understand the revaporisation process.
Response to Ci 5
Studies on revaporisation with Phébus FP and simulant samples were undertaken in the EC 4th Framework
Programme projects RVP and REVAP-ASSESS. Based on these studies and the evaluation of PHEBUS FP
results themselves the knowledge of revaporization has significantly increased. It has been shown to
significantly influence transport of volatile fission products compounds in the RCS to the containment
during core degradation. In addition, plant calculations indicate that revaporisation can be a potential
long-term source of fission products to the containment. Currently further studies of revaporisation with
samples from PHEBUS FP experiments are on-going. In addition, release of volatile fission product
compounds due reactions on the primary circuit surfaces is carried out in EXSI project within the
SAFIR2010 programme. Lastly, in the frame of SARNET programme, one technical circle is dedicated to
sharing information on revaporisation. Only after terminations of these evaluations can it be decided what
additional work might be necessary.
Experimental work on revaporization remains scarce; further theoretical and experimental developments
are necessary to understand the revaporization process. In addition, the safety relevance ought to be further
demonstrated by assessing, conceivably, the impact of a weak source of fission products from the reactor
coolant system for some hours after the main release-from-core phase.
Containment behaviour
Co 1
Both detailed and integral tests are necessary to support the modelling of the removal of aerosols
by sprays. Particle size and density, as well as spray droplet size, are important parameters.
Removal by interacting droplets may be significant and is being investigated
.
Response to Co 1
This issue has been extensively investigated by the French organisations CEA and IRSN using specific
apparatuses and the CARAIDAS, MISTRA and TOSQAN test facilities. The data should be made
accessible to the nuclear community, at least the OECD partners. Validated modelling based on these
experimental investigations has been implemented in the codes ASTEC and TONUS. In the context of
containment sprays, further work is no longer a priority.
Co 2 There are indications from PHEBUS that further mechanisms may play a role in aerosol removal
in plants. These include turbulent impaction and charge effects and should be further investigated
to scope their potential impact.
Response to Co 2
From the substantial examinations performed for the aerosol deposition in the PHEBUS FP
'quasi'-containment, especially for test FPT1, it cannot be concluded that turbulent impaction has a major
NEA/CSNI/R(2009)5
387
influence compared to other deposition mechanisms. The mechanism is in any case included in current
containment codes. Concerning charge effects, small deposits of aerosols on the outer walls of the 10 m
3
containment vessel in the PHÉBUS test FPT0 could not be explained by electrophoretic effects as shown
in an IRSN study (and while this study was made available to the PHÉBUS partners it did not lead to
further studies). However, even if charge effects on aerosol deposition are not seen to be significant in test
facilities (with or without a radiation field) there is no firm evidence that this effect would be negligible in
an accident. At present there is no consensus among experts on whether further investigations of charging
effects are necessary or not.
Co 3 The possible impact of hydrogen recombiners on aerosol depletion rates due to affecting local
thermal-hydraulic conditions and to chemical effects have to be investigated
.
Response to Co 3
With respect to this issue experimental work has been carried out in France (RECI) and Germany (ThAI).
The direct impact of recombiners on thermal-hydraulics may have a limited influence on the overall
aerosol depletion, whereas the chemical effect might be significant. The decomposition of metal-iodide
aerosol inside a recombiner forming molecular iodine may have an important impact on the source term.
This process has to be examined further in order to generate an adequate amount of reliable data and allow
complete understanding for modelling. The quantitative impact on the source term remains uncertain.
Co 4 Pool scrubbing modelling is uneven in its level of detail (i.e., hydrodynamic models). The
resulting uncertainties require review in terms of performance requirements and tolerance for
uncertainty in plant applications. Coupling to containment codes is recommended.
Response to Co 4
Since 1998 some progress has been made on this issue in the context of the ARTIST programme but it is
still largely open.
Co 5 Modelling of re-entrainment from boiling pools (a weak, but persistent late-phase source of
fission products) performs well for ideal systems, but currently lacks consideration of non-ideal
effects arising from suspended materials, solutes and surfactants. It has to be examined, if
re-entrainment from boiling pools may have a significant effect of offsite releases.
Response to Co 5
Investigations with respect to the aerosol re-entrainment from a boiling water pool are ongoing in the
German ThAI facility; in parallel analytical work is performed. It is part of this activity to examine
whether re-entrainment may have a significant effect on offsite release (as recommended in 1998).
Co 6 Heat release by hydrogen burns may have a strong effect on aerosol characteristics, as a result of
the thermal-hydraulic transient and can possibly liberate volatile forms of iodine. Experimental
evidence and thermodynamic analysis are inconclusive as to the magnitude of the effect.
Response to Co 6
Experiments in the ThAI facility demonstrate that there is a clear effect of hydrogen-combustion-induced
flows on resuspension of already deposited CsI aerosol. Initial source-term calculations for plant
conditions show an increase of airborne aerosol of up to one order of magnitude. Assuming a small leak in
the containment of 0.01 m
2
the released aerosol mass increases by a factor of 4, in the case of a global
containment failure by a factor of 10. These findings have to be expanded to other types of relevant aerosol
NEA/CSNI/R(2009)5
388
species and other plant applications. However, chemical effects on iodine-containing aerosols have not
been studied; information from the ongoing investigation of the impact of recombiners on aerosols may be
relevant.
Recommendations
R 1
A meeting in the use of severe accident codes in plant calculations for source term estimation,
including codes used by utilities, is recommended within the next two years.
Response to R 1
Ten years after formulation of this recommendation it has still not put into practice. As already stated
above (see the response to Ci 1), there is a need to harmonise user practices with respect to plant analyses
in order to reduce divergence in results. The objective would ideally be to produce an online “best
practice” guide for the major codes.
R 2 Important experimental and analytical work is in progress on aerosol behaviour in the primary
circuit; a SOAR could be productively undertaken in this area, within two years.
R 3
In light of substantial recent work completed on aerosol behaviour in the containment, the writing
of a SOAR on containment aspects of severe accident aerosols behaviour is recommended.
Response to R 2 and R 3
These recommendations are fulfilled with this report.
References
[1] H.-J. Allelein Third OECD specialist meeting on nuclear aerosols in reactor safety GRS-166,
NEA/CSNI/R(98)4, ISBN 3-931995-31-3, June 1998
[2] H.-J. Allelein et al. EVITA - European validation of the integral code ASTEC Final report of the
project FIKS-CT-1999-00010, EC 5th Framework Programme (1999)
[3] H.-J. Allelein, K. Neu, J.P. Van Dorsselaere European validation of the integral code ASTEC
(EVITA) - First experience in validation and plant sequence calculations, Nuclear Engineering and
Design 235(2-4), 285-308 (2005).
[4] J.P. Van Dorsselaere, H.-J. Allelein, K. Neu Progress and perspectives of ASTEC application for
severe accidents in the network SARNET, EUROSAFE, 2006.
