

Page i Table of Contents
TABLE OF CONTENTS
EXECUTIVE SUMMARY ............................................................................................................................... 1
INTRODUCTION ........................................................................................................................................... 3
Methodology ........................................................................................................................................ 3
About the Sample ................................................................................................................................. 3
RESULTS ..................................................................................................................................................... 4
Qualifications and Experience .............................................................................................................. 4
Experience .................................................................................................................................. 6
Certifications ............................................................................................................................... 9
Career Type ....................................................................................................................................... 11
Applied Employment .......................................................................................................................... 13
Industry ..................................................................................................................................... 13
Job Title .................................................................................................................................... 14
Academic Employment ....................................................................................................................... 16
Geographic Location .......................................................................................................................... 19
Bonuses ............................................................................................................................................. 21
Raises ................................................................................................................................................ 23
Benefits .............................................................................................................................................. 25
Retirement Benefits ................................................................................................................... 25
Leave, Health, and Disability Insurance Benefits ....................................................................... 26
Professional Development and Education Benefits .................................................................... 31
Other Benefits ........................................................................................................................... 32
Supplemental Income ......................................................................................................................... 35
The Impact of COVID-19 .................................................................................................................... 36
COVID-19 Impact on Remote Work Arrangements .................................................................... 36
COVID-19 Impact on Employment ............................................................................................. 39
COVID-19 Impact on Work Hours .............................................................................................. 45
COVID-19 Impact on Benefits ................................................................................................... 45
Caregiving .......................................................................................................................................... 47
Demographics .................................................................................................................................... 50
Age ........................................................................................................................................... 50
Disability.................................................................................................................................... 50
Gender ...................................................................................................................................... 51
Race and Ethnicity .................................................................................................................... 55
Race by Gender ........................................................................................................................ 56
Degree Type ............................................................................................................................. 57

Page ii Table of Contents
CONCLUSION ............................................................................................................................................ 59
APPENDIX .................................................................................................................................................. 60
Historical Comparisons....................................................................................................................... 60
INDEX ......................................................................................................................................................... 63
List of Tables ...................................................................................................................................... 63
List of Figures..................................................................................................................................... 64
ABOUT SIOP .............................................................................................................................................. 65
ABOUT HUMRRO ...................................................................................................................................... 65
ACKNOWLEDGEMENTS ........................................................................................................................... 66

Executive Summary
Page 1
EXECUTIVE SUMMARY
2022 Income and
Employment Report
The Society for Industrial and Organizational Psychology (SIOP) publishes the Income
and Employment Report to track salary and employment trends for industrial and organizational
psychologists (I-Os). Below are key points from the 2021 SIOP Salary Survey.
Salary increases since 2018
11%
16.2%
Average Wage Index
Increase since 2018
Consumer Price Index
Increase since 2018
Doctorate Income
9.6%
Master’s Income
12.4%
62% of doctorate-level respondents are
practitioners and
38% work in academia.
97.8% of master’s-
level respondents
work as practitioners.
Practitioners’ median
income is
19.5% higher
than that of academics.
Among doctorate-level
practitioners, independent
consultants earned the highest
median salary
(
$350,000
)
.
I-O psychologist salaries increased less than
the average wage index since 2018. Master’s-
level salaries increased more than the ination
rate, but doctorate-level salaries did not.
19.5% 38%62%
Among master’s-level practitioners,
those working in the technology
industry earned the highest
median salary
(
$121,729*
)
.
(*for industries with n > 10)
Academics in business
schools had a higher median
income
(
$143,559
)
than those
in psychology departments
(
$92,000
)
.
97.8%
EDUCATIONJOB SECTOR

Executive Summary
Page 2
2022 Income and
Employment Report
Most I-Os experienced no change in employment
or income due to COVID-19 in 2020
(
73.2%
)
or in 2021
(
88.5%
)
. Salary, benet, and bonus
reductions were the most common impacts in
2020
(
8.4%, 8.9%, and 7%, respectively
)
. Those
impacts dropped by about two-thirds in 2021.
The gender wage gap has narrowed since the
2019 report.
The median income for women increased in 2021
to
94% of men’s median income, and the pay
difference was not statistically signican
t.
Before the pandemic,
17% of I-Os worked fully remotely. In 2021, 42% of I-Os reported working fully remotely.
Remote work status did not impact pay.
9%
The largest
concentration of
respondents work in
the D.C. metro area.
$133,891
Master’s-level I-Os working in the
Chicago metro area earned the highest
median income (Adjusted for cost of living).
$239,425
Doctorate-level I-Os
working in the Houston
metro area earned the
highest median income
(Adjusted for cost of living).
The most common COVID-related benets offered
by employers in 2020 and 2021 were exible work
arrangements
(
45% and 37%, respectively
)
,
additional time off
(
32% and 26%
)
, and access to
Personal Protective Equipment
(
27% and 26%
)
.
LOCATIONCOVID-19GENDER

Page 3 Introduction
INTRODUCTION
Methodology
The 2021 SIOP Income and Employment Survey
asked members about their income and work
arrangements in 2020 and 2021. The survey was
developed and administered by SIOP’s Institutional
Research Committee (IRC) Salary Survey
Subcommittee in partnership with Mercer|Sirota.
Email invitations to complete the survey were sent to
5,146 SIOP members. We received 1,213 responses;
a 21% percent response rate. Human Resources
Research Organization (HumRRO) analyzed the
survey results and developed this report. To protect
respondent anonymity, we report results for groups
and subgroups with no fewer than 10 respondents. In
some cases, this limited the level of depth and detail
of subgroup analyses but we are confident that these
findings are sufficiently representative of the state of
income and employment for SIOP members.
About the Sample
After data cleaning procedures, the 2021 SIOP Salary Survey received 1,074 responses from members
(Student members are not included in the sample). Because 96% (n = 1,027) of respondents were employed
full-time and only 4% (n = 47) were employed part-time or did not specify the number of hours they worked,
we only included responses in our analyses from members who worked full-time in 2021. Full-time
employees worked 44.5 hours per week on average (median = 42), a continuing decrease from 2019 (mean
= 45.5, median = 45) and 2015 (mean = 47.8, median = 48).
As in previous reports, the sample consists of more practitioners than academics. Of those who reported
career type, 72% (n = 739) were practitioners and 28% (n = 288) worked in academia. Practitioners worked
in a wide variety of industries, with the largest percentage working in consulting firms (38% of doctorate
practitioners and 35% of master’s-level practitioners) or in the tech industry (25% of doctorate practitioners
and 19% of master’s-level practitioners). As in previous years, a majority of the sample reported their
highest degree was a doctorate, with 72% (n = 740) holding doctorate degrees and 27% (n = 276) holding
master’s degrees, while 1% (n = 11) of respondents held bachelor’s degrees or did not report degree status.
Another continuing trend is the larger representation of women than men in the sample, with women making
up 53% (n = 543) of respondents and men accounting for 46% (n = 465). Demographic characteristics of the
current sample compared to previous survey administrations can be found in the Appendix.
As in past years, this report provides findings and insights about how and where I-Os work and current
income and benefit trends in the field. The 2021 survey was unique from past surveys in several respects.
The most profound of these differences was the inclusion of questions about the impact of COVID-19. The
pandemic affected nearly every area of life in 2020 and 2021, and the current survey included questions
about remote work, caregiving, and changes in employment, income, and benefits due to COVID-19.
Responses to this additional survey content showed that on the whole, I-O careers fared well during the
pandemic and companies where I-Os worked responded to employees’ changing needs by offering
additional benefits. These findings are discussed in later sections of this report.

Page 4 Results
RESULTS
Qualifications and Experience
Because an overwhelming majority of
respondents reported having earned a doctorate
degree or a master’s degree, this report focuses
on metrics for those two groups. Median income
for master’s-level respondents increased more
than the median income for doctorate-level
respondents from 2018 to 2021. Salaries for
doctorate-level respondents in the sample rose by
9.6% since 2018, while master’s-level salaries
rose by 12.4%. The U.S. Consumer Price Index
(CPI) inflation rate increased 11%
1
between 2018
and 2021, meaning master’s-level incomes kept
abreast of inflation while doctorate-level salaries
did not. However, income gains for both master’s-
level and doctorate-level respondents fell far short
of the U.S. Average Wage Index increase of
16.2%
2
over the same period.
Figure 1 shows median salaries by degree for each report year. For 2021, the median salary was $137,000
for doctorate-level respondents and $100,000 for master’s-level respondents. The difference between
median salaries for doctorate holders and for master’s degree holders decreased from 41% in 2018 to 37%
in 2021. The trend over time (Figure 2) shows doctorate-level salaries have ranged between 34% (in 2000)
and 47% (in 2011) higher than master’s-level salaries since 1997. However, since 2014 the pay differential
has been narrowing (Figure 2).
“For 2021, the median salary was
$137,000 for doctorate-level respondents
and $100,000 for master’s-level respondents.”
1
The CPI inflation rate between 2018 and 2021 was calculated using data from the U.S. Bureau of Labor Statistics at
https://www.bls/gov/timeseries/CUUR0000SA0. The increase was calculated by comparing the December 2021 CPI with the
December 2018 CPI.
2
Average Wage Index (AWI) data was retrieved from the U.S. Social Security Administration (S.S.A.) AWI tables at
https://www.ssa.gov/OACT/COLA/AWI.html. Note: AWI data from the S.S.A. are average per worker, so industries with larger
numbers of workers have more weight.

Page 5 Results
Figure 1. Median Income Over Time by Degree Level
Figure 2. Percent Difference Between Doctorate-level and Master's-level Median Salaries
Over Time
$43K
$60K
$71K
$80K
$83K
$90K
$84K
$88K
$92K
$99K
$102K
$105K
$110K
$113K
$112K
$118K
$125K
$137K
$43K
$52K
$60K
$55K
$58K
$67K
$60K
$65K
$68K
$72K $72K
$75K
$75K
$81K
$77K
$85K
$89K
$100K
1982 1988 1994 1997 1999 2000 2002 2003 2005 2006 2008 2009 2011 2012 2014 2015 2018 2021
Doctorate Master's
0%
17%
19%
46%
43%
34%
40%
35%
35%
37%
42%
41%
47%
40%
46%
41%
41%
37%
1982 1988 1994 1997 1999 2000 2002 2003 2005 2006 2008 2009 2011 2012 2014 2015 2018 2021

Page 6 Results
Experience
Overall, doctorate-level income was 37% higher than that of master’s level respondents (t = 8.0, df = 953.1,
p < .001)
3
. Beyond educational attainment, work experience has a substantial impact on I-Os’ income. Time
since degree represents work experience and skill acquisition, both of which are associated with higher
earning potential. Tables 1 and 2 show median and mean salary along with percentile distributions for
doctorate-level and master’s-level members by years since highest degree earned.
Unlike in past reports, the income trajectory for doctorate-level I-Os did not consistently increase with years
since degree. Notably, salary percentiles for the 20-to-24-years group are slightly inflated compared to their
adjacent cohorts, suggesting that this cohort contains some extremely high incomes. Salaries for the 15-to-19-
years cohort at or below the 50
th
percentile are slightly deflated compared to the 10-to-14-years cohort. To
better understand the trends in median income, we examined additional characteristics of doctorate holders for
those at 15-to-19 years since degree and those at 25-or-more years since degree. In the 15-to19-years cohort,
the median salary for men ($150,559) and women ($146,694) were both close to the overall median. Within
the 25-or-more-years cohort, the median salary was $196,500 for men and $153,562 for women (although this
difference was not statistically significant), with women making up about 41% of this cohort. In the remaining
cohorts, median salaries for men and for women were similar, with median salaries for women being higher
than for men in the 5-to-9-years, 10-to-14-years, and 20-to-24-years cohorts. The gender effect for the 25-or-
more years cohort may contribute to the relatively lower salaries in the 25-or-more-years since degree group.
Gender differences in pay are discussed in more detail in a later section of the report.
Table 1. Base Salary by Years Since Doctorate Degree
Years Since Degree
< 2 2-4 5-9 10-14 15-19 20-24 25+
n 25 107 157 87 71 57 99
Median $100,000 $110,000 $130,000 $150,000 $149,000 $190,000 $160,000
Mean $109,214 $119,192 $142,950 $168,021 $172,158 $278,667 $217,747
Percentile
90th $142,400 $170,200 $212,000 $225,000 $245,000 $320,938 $300,000
75th $124,000 $137,500 $165,000 $184,500 $198,000 $240,000 $232,000
50th $100,000 $110,000 $130,000 $150,000 $149,000 $190,000 $160,000
25th $87,500 $95,000 $104,000 $121,500 $118,500 $133,484 $110,250
10th $80,372 $72,900 $85,000 $83,471 $83,300 $91,872 $90,914
3
Welch t-tests were used in cases where group sizes and/or group variances were unequal. The Welch t-test estimates
degrees of freedom using a formula that includes group variance divided by group size, leading to the potential for estimated
degrees of freedom to include decimal places.

Page 7 Results
Table 2. Base Salary by Years Since Master’s Degree
Years Since Degree
< 2
2-4
5-9
10-14
15-19
20-24
n
17
72
79
31
20
12
Median
$65,000
$87,500
$99,174
$120,750
$153,636
$155,000
Mean
$65,668
$88,273
$107,313
$123,899
$167,336
$172,250
Percentile
90th
$90,055
$119,000
$151,000
$165,000
$209,650
$232,600
75th
$72,500
$102,025
$121,114
$143,500
$178,000
$205,000
50th
$65,000
$87,500
$99,174
$120,750
$153,636
$155,000
25th
$50,000
$72,875
$87,000
$102,000
$130,000
$129,500
10th
$37,017
$52,800
$72,400
$80,000
$109,500
$116,300
We also examined whether this unusual pattern in doctorate salary by years since degree was found when
separating practitioners and academics. As shown in Table 3, median income for those in academia at 15-
to-19 years out from their degree was slightly lower than for academics 10-to-14 years from their degree,
while for practitioners this cohort exhibited the expected increase in income from the 10-to-14-years
practitioner cohort. The median salary at the doctorate level for academics 25 or more years out from their
degree was $118,400 while the median salary for practitioner doctorate holders in this cohort was $206,138.
However, even accounting for career field, the median salary for doctorate-level I-Os did not continue to
increase after around 20-to-24 years of experience. For doctorate-holding I-Os in academia, median salary
at 25-or-more years is much lower than for those at 20-to-24 years since degree. Salaries for those in
academia are explored further in a subsequent section of the report.
Table 3. Base Salary by Years Since Doctorate Degree for Practice and Academia
Years Since Degree for Practitioners
< 2 2-4 5-9 10-14 15-19 20-24 25+
n 20 86 107 53 39 32 50
Median
$100,520 $120,000 $149,800 $155,000 $171,858 $207,149 $206,138
Mean $107,068 $127,099 $159,371 $192,010 $202,008 $374,472 $220,796
Years Since Degree for Academics
< 2
2-4
5-9
10-14
15-19
20-24
25+
n
5 21 50 34 32 25 49
Median N/A $89,319 $101,666 $124,500 $121,294 $133,484 $118,400
Mean
N/A $86,808 $107,809 $130,626 $135,779 $156,037 $214,636

Page 8 Results
Salaries for master’s degree holders increase with years of experience (Table 4). The group size was
not sufficient to report salary information for master’s degree holders at 25 or more years since earning
their degree.
Table 4. Base Salary by Years Since Master’s Degree for Practitioners
Years Since Degree
< 2 2-4 5-9 10-14 15-19 20-24
n 17 71 76 31 20 11
Median $65,000 $88,000 $102,000 $120,750 $153,636 $160,000
Mean $65,668 $88,432 $109,488 $123,899 $167,336 $176,091
Across years since degree, median doctorate-level I-O salaries were higher than those of master’s-level I-
Os at all time points except for respondents who earned their degree 15-to-19 years ago (Figure 3). The
number of master’s-level I-Os at 25-or-more years since earning their degree was not sufficient to report
salary information. For each cohort up to and including 10-to-14 years since degree, median doctorate and
master’s level income rose at similar rates. The difference between doctorate and master’s degree holders
in median salaries when starting their careers may reflect differences in skill level or entry-level job
responsibilities for those graduating with a doctorate versus a master’s degree. Likewise, the ongoing
difference in pay over years since degree may be partly explained by greater skill and expertise
requirements in job roles for doctorate holders.
Figure 3. Median Income by Years Since Degree
$100,000
$110,000
$130,000
$150,000
$149,000
$190,000
$160,000
$65,000
$87,500
$99,174
$120,750
$153,636
$155,000
< 2 2-4 5-9 10-14 15-19 20-24 25+
Doctorate Master's

Page 9 Results
Certifications
Holding a license or professional credential may also impact income for I-Os. Many respondents reported
holding some type of certification or credential (n = 151). A greater percentage of master’s degree holders
held certifications (23%) than did doctorate-level respondents (18%), although for both master’s level and
doctoral level respondents, this is a percentage increase from the 2019 report (21% and 12%, respectively).
Table 5. Base Salary by Type of Certification
Doctorate
HR related
Certification
Coaching
Certification
Other
Certification
No Professional
Certification
n 39 12 49 554
Median $160,000 $136,638 $165,000 $135,000
Mean $184,825 $157,754 $250,242 $159,155
Master’s
HR related
Certification
Coaching
Certification
Other
Certification
No Professional
Certification
n 19 7 25 180
Median $116,400 N/A $96,000 $96,950
Mean $128,528 N/A $94,786 $105,663
Note. The number of master’s-level respondents with a coaching certification was insufficient for reporting
salary information.
For respondents with a master’s degree, the median income for those with some type of certification was
$106,694 (n = 51) and for those without any certification (n = 181) was $96,950 (n.s.). For doctorate holders,
those with at least one certification (n = 125) earned a median salary of $156,000 while the median salary
for those with no certification (n = 560) was $135,000 (n.s.). Figure 4 shows the median salary by type of
certification for both doctorate-level and master’s-level I-Os.

Page 10 Results
Figure 4. Median Salary by Certification Type by Degree Level
Note. Median salary for master’s degree holders with a coaching certification is not reported due to insufficient
group size.
There were too few master’s-level respondents with a coaching certification to include in the results. For
doctorate-level I-Os, having a certification other than HR-related or coaching was associated with a higher
salary than having no certification (F (3, 651) = 3.94, p < .05). Except for this comparison, salaries within
degree levels for those with a certification were not significantly higher than for those without.
“Professional certifications were associated
with increased income for I-Os. Depending on
the type of certification, doctorate-level salaries
were up to 15.5% higher and master’s-level
salaries were up to 10% higher.”
$160,000
$136,638
$165,000
$135,000
$116,400
$96,000
$96,950
HR related certification Coaching certification Other certification No professional certification
Doctorate Master's
Page 11 Results
Career Type
The skills and expertise of I-O psychologists are of
value to organizations in many employment sectors.
For this report, we grouped employment sectors into
five categories: university or college, private for-profit,
nonprofit, government, and self-employed consulting.
The majority of survey respondents reported working
in private for-profit organizations (56%), with the next
largest percentage working in academia (28%). Most
academics hold a doctorate degree, with only 2.2% of
master’s-level I-Os employed in academia. Figures 5
and 6 show the percentage of doctorate holders and
master’s degree holders in each employment sector.
Income can vary greatly by employment sector.
Among practitioners, self-employed consultants
reported substantially higher salaries than those in
other sectors, although this difference did not meet
statistical significance. Doctorate-level practitioner income is significantly greater than income for doctorate-
level academics (t(593.2) = 2.87, p > .05). More specifically, as Table 6 shows, doctorate-level private-sector
for-profit income was significantly higher than income for academics (t(548.4) = 2.74, p < .01). For those
with a master’s degree (Table 7), although the median salary for I-Os working in nonprofit organizations
was lower than for those working in government or for-profit organizations, the difference was not
statistically significant.
Figure 5. Doctorate-Level I-Os in Each Employment Sector
38%
48.5%
5.5%
5.5%
2.2%
University or College
Private Sector- For-Profit Organization
Not for Profit Organization
Government
Self-employed, consulting

Page 12 Results
Figure 6. Master's-Level I-Os in Each Employment Sector
Table 6. Base Salary by Employment Sector for Doctorate-level I-Os
Doctorate-Level Base Salary
For-Profit Non-Profit Government
Self-employed
Consulting
Academia
n
356
41
41
16
274
Median
$150,000 $147,000 $127,000 $250,000 $111,438
Mean
$181,025 $157,308 $174,473 $265,689 $141,916
Table 7. Base Salary by Employment Sector for Master’s-level I-Os
Master’s-Level Base Salary
For-Profit
Non-Profit
Government
n
217
19
28
Median
$101,700
$80,000
$113,500
Mean
$110,182
$92,844
$116,226
2.2%
79.7%
6.9%
9.8%
1.1%
University or College
Private Sector- For-Profit Organization
Not for Profit Organization
Government
Self-employed, consulting

Page 13 Results
Applied Employment
Industry
Salary varies by industry for both doctorate-level I-Os and master’s-level I-Os. The highest median base
salary for those with a doctorate degree was in the healthcare industry (Figure 7), although I-O salaries
between industries did not significantly differ. This is likely in part due to small group sizes and substantial
I-O salary variance within industries.
Figure 7. Doctorate - Median Base Salary by Industry
Note. Numbers in parentheses in Y-axis labels indicate respondent N for each listed industry.
For master’s degree holders (Figure 8), I-Os in the technology industry earned the highest median base
salary (F(3, 147) = 4.1, p < .01). Technology salaries were significantly higher than consulting organization
salaries (p < .05) or healthcare salaries (p < .05) for I-Os with a master’s degree.
Figure 8. Master's - Median Base Salary by Industry
Note. Numbers in parentheses in Y-axis labels indicate respondent N for each listed industry.
$132,000
$137,000
$141,000
$147,163
$148,604
$167,250
$175,000
$180,000
Retail (13)
Consumer Products (13)
Banking, Finance, or Insurance (17)
Consulting Org (136)
Manufacturing (28)
Technology (88)
Information Technology/Computers (10)
Healthcare (20)
$88,000
$95,500
$103,459
$105,819
$121,729
Healthcare (15)
Consulting Org (76)
Banking, Finance, or Insurance (19)
Manufacturing (16)
Technology (41)

Page 14 Results
Job Title
In addition to degree level, years of experience, and job sector or industry, I-O salaries vary by job title. Of
course, job title is often related to years of experience. As I-Os gain experience, they may move into
positions with greater responsibility at a higher salary. Table 8 gives median, mean, and salary percentiles
across job titles for doctorate-level practitioners. Compared to the 2019 report, median salaries were higher
for every job title. This may be partly due to members in the same position receiving pay raises, although the
increase from 2019 for those at the entry-level likely indicates a general upward shift in salaries for
practitioner I-Os.
While median salaries incremented upward for increasing levels of responsibility, the mean doctoral-level
salary for vice president was higher than for senior vice president (n.s.). Also, the range of salaries for vice
presidents was greater than for senior vice presidents. As found in previous reports, the comparatively lower
mean salary for senior vice presidents is possibly due to the smaller size of organizations in which they tend
to work compared with vice presidents. About half of senior vice presidents work in companies with fewer
than 300 employees and 25% work in companies with fewer than 100 employees, while nearly 78% of vice
presidents work in companies with more than 300 employees (and more than a third work in companies with
more than 3,000 employees).
Table 8. Practitioner Base Salary by Job Title for Doctorate Degree Holders
Entry-
level
Consultant
Senior
Consultant
Direct
Supervisor
HR
Mgr.
Non-HR
Mgr.
Vice
President
Senior
Vice
President
n 14 78 140 49 91 29 27 12
Median $88,050 $116,500 $144,500 $151,928 $173,000 $160,000 $220,000 $239,000
Mean $86,431 $123,986 $158,566 $154,043 $192,685 $164,874 $318,200 $243,333
Percentile
90th $103,861 $150,637 $221,800 $191,400 $235,000 $231,200 $433,000 $297,300
75th $92,875 $139,250 $170,090 $170,000 $212,500 $197,000 $257,500 $255,750
50th $88,050 $116,500 $144,500 $151,928 $173,000 $160,000 $220,000 $239,000
25th $73,370 $100,150 $120,750 $131,000 $139,000 $140,544 $190,000 $215,750
10th $67,100 $90,140 $104,000 $111,016 $120,000 $90,000 $179,000 $186,500
Note. HR Mgr. = manager/director of human resources. Non-HR Mgr. = manager/director of other than human
resources unit.

Page 15 Results
Master’s-level practitioner salaries also rose with increased job responsibility (Table 9), although median and
mean salaries for master’s-level I-Os were lower than their doctorate-level counterparts for all job titles. For
master’s-level respondents, we combined the roles of vice president and senior vice president to increase
group size for reporting purposes. We examined the organization size for master’s-level vice presidents and
senior vice presidents compared with doctorate holders. Organization size for master’s degree holders in
these roles was similar to that of doctorate-level senior vice presidents, with 55% of master’s degree holders
at this job level working in organizations with fewer than 300 employees.
Table 9. Practitioner Base Salary by Job Title for Master’s Degree Holders
Entry-level Consultant
Senior
Consultant
Direct
Supervisor
HR
Mgr.
VP or
Senior VP
n 25 99 61 14 46 11
Median $61,800 $90,000 $113,000 $118,364 $127,000 $200,000
Mean $61,535 $93,006 $119,442 $118,156 $134,038 $200,818
Percentile
90th $89,250 $117,960 $160,000 $143,205 $206,750 $230,000
75th $79,000 $102,500 $142,000 $130,000 $168,750 $220,000
50th $61,800 $90,000 $113,000 $118,364 $127,000 $200,000
25th $43,500 $75,000 $97,500 $100,650 $99,380 $159,500
10th $28,100 $65,244 $79,799 $95,625 $67,500 $105,000
Note. VP or SVP = vice president or senior vice president. HR Mgr. = manager/director of human resources.
“The highest median base salary for
those with a doctorate degree was in the
healthcare industry, and the highest median
base salary for those with a master’s
degree was in the technology industry.”

Page 16 Results
Academic Employment
As with I-O practitioner workplaces, several
institutional characteristics contribute to academic
salaries. Private and public institutions have
different primary funding sources, with public
colleges and universities largely relying on state
government funding and private institutions relying
more on tuition and private endowments for their
funding. These funding differences can impact
academic salaries. Table 10 shows that academic
respondents reported higher median and mean
salaries working in public institutions than in private.
Table 10. Doctorate-Level Base Salary by Institution Type
Public Private
n 199 69
Median $115,000 $96,000
Mean $132,744 $114,485
Another institutional characteristic affecting academic salary is the degree-granting level of the college or
university. Figure 9 shows median salary by degree-granting level for public and private institutions. Salaries
for doctorate-granting institutions were highest for both public and private universities. For public institutions,
differences between degree-granting levels were not statistically significant; however, academics at private
doctorate-granting universities earned significantly more than their counterparts at master’s-granting schools
(t(63.9) = -3.69, p < .01).
“Academics in business schools or
departments earned significantly more
than those in psychology departments.”

Page 17 Results
Figure 9. Median Salary by Degree-granting Level by Institution Type
Note. Median salary for academics working at a private baccalaureate institution is not reported due to insufficient
group size.
A third factor affecting academics’ income is the department in which they work. We asked academic
respondents what department they worked in at their college or university. Although some respondents
worked in industrial relations (n = 5) and education departments (n = 2), these group sizes were too small to
include as stand-alone categories, so we grouped them into a category labeled ‘other’ with academics who
reported working in a wide variety of departments, such as communication, medicine, professional studies,
and leadership, among others. Table 11 shows median and mean salary by academic department. As in
previous reports, academics in business schools or departments earned significantly more than those in
psychology departments (t(101.5) = -2.89, p < .01). Although, business school academics also earned more
than those in administrative roles or in departments other than psychology, the differences were not
statistically significant.
Table 11. Doctorate-Level Base Salary by Academic Department
Psychology Business Administrative Other
n 136 99 11 26
Median $92,000 $144,000 $114,000 $122,794
Mean $106,184 $192,783 $127,282 $144,572
Next, we compared salaries for different levels of professorship in academia. Given the difference in income
between academics in psychology departments and those in business schools or departments, we
examined salary by job title for professors in business schools and in psychology departments separately
(Figure 10). The number of distinguished or chaired professors in business schools in the sample (n = 6)
was not sufficient for reporting or analysis. Mean business school salary for associate professors was
significantly higher than for assistant professors (F(2, 74) = 5.97, p < .01), but salary differences between full
$83,750
$104,167
$90,568
$103,511
$128,248
Baccalaureate Institution Master's Institution Doctoral Institution
Private Public

Page 18 Results
professors and either associate or assistant professors were not statistically significant. There were
significant differences in salary for academics teaching in psychology departments (F(3, 115) = 41.6, p <
.001). Distinguished or chaired professors in psychology earned significantly more than all other types of
professor (p < .001), and full professors earned significantly more than either associate (p < .05) or assistant
professors (p < .01). However, even though median and mean salary for associate professors was higher
than for assistant professors, this difference did not reach the threshold of statistical significance.
Figure 10. Doctorate-Level Median Base Salary by Professor Type and Department
Note. Median salary for Distinguished/Chaired Professor in Business Departments is not reported due to
insufficient group size.
$129,000
$175,930
$143,118
$82,620
$87,179
$107,016
$191,500
Assistant Professor Associate Professor Full Professor Distinguished/Chaired
Professor
Business Department Psychology Department

Page 19 Results
Geographic Location
We asked members to provide the first three digits
of their workplace zip code, and then matched
these to U.S. cities and states. We then grouped
city/state data by metro area
4
. For those working in
Canada, we asked for the first three characters of
their postal code. Due to sample size restrictions,
we were not able to group Canadian I-Os by their
city or province. Both doctorate-level and master’s-
level I-Os working in the San Francisco Bay Area
had the highest median base salary (Tables 12 and
13), although when adjusted for cost of living
5
,
base salaries were highest for doctorate-level I-Os
in the Houston metro and for master’s-level I-Os in
the Chicago metro area. This is a change from the
2019 report, where adjusted median salary was
highest for doctorate holders in the Dallas metro
area and highest for master’s degree holders in the
Charlotte metro area. The percent of academic I-Os in a metro area was negatively correlated with the
median doctorate-level income for that area (r = -.44, p < .01). However, sample sizes are insufficient to
report salary by geographic location for practitioners and academics separately.
“Doctorate-level and master’s-level I-Os
working in the San Francisco Bay Area
had the highest median base salary.”
4
We used the Office and Management and Budget’s Metropolitan Statistical Areas 2015 bulletin to group cities by metro area.
5
To facilitate comparisons across reports, we used the same cost of living indices as were used in the 2019-20 report; the
Cost of Living Calculator from PayScale, Inc., at https://www.bestplaces.net/cost-of-living/, using the Washington D.C. metro
area as the referent.

Page 20 Results
Table 12. Doctorate-Level Base Salary by Metro Area
n Median Mean
Percent
Academic
Adjusted
Median
San Francisco metro
15
$196,000
$217,029
0%
$121,520
Manhattan metro
17
$185,000
$280,336
12%
$125,800
Los Angeles metro
11
$180,000
$191,665
27%
$154,800
Houston metro
18 $152,500 $172,770 33% $239,425
Minneapolis metro
17 $150,000 $157,283 18% $215,100
DC metro
68
$149,500
$175,587
6%
$149,500
Atlanta metro 17 $137,000 $185,709 29% $188,649
Chicago metro
27
$126,500
$154,547
44%
$177,353
Detroit metro
10 $122,288 $142,235 30% $207,644
Dallas - Fort Worth metro
17 $120,000 $141,892 0% $178,920
Portland metro
13
$120,000
$275,365
31%
$136,440
Tulsa metro
10
$113,500
$118,805
55%
$207,478
Other metro
64
$141,000
$145,318
42%
Not metro
16 $137,554 $145,594 50%
Canada
18 $106,121 $114,577 78%
Other countries
22
$122,250
$146,151
74%
Table 13. Master’s-Level Base Salary by Metro Area
n Median Mean Adjusted Median
San Francisco metro
10
$143,500
$131,390
$88,970
Manhattan metro
10
$106,500
$114,500
$72,420
DC metro
26
$99,000
$112,308
$99,000
Chicago metro
22
$95,500
$95,316
$133,891
Other metro
29
$97,000
$92,852

Page 21 Results
Bonuses
As in many professions, bonus pay is an important
part of the complete compensation package for I-O
psychologists. We asked members to provide the
types of bonuses they received in 2021 as well as
the total amount of their bonuses for the year.
Table 14 shows mean and median bonus amounts
as well as percentiles for those with a doctorate
degree and those with a master’s degree. Many
members reported receiving more than one type of
bonus, so the amounts presented in this table may
represent a combination of bonuses rather than
single bonuses.
Table 15 shows types of bonuses received as well
as the percentage of master’s-level and doctorate-
level I-Os that received them. Members reported
additional bonus types, but group sizes were too small to allow reporting. Not all organizations offer some
types of bonuses. For example, government employers and nonprofit companies do not offer stock options.
Types of bonuses I-Os receive are partly a function of the type of employer for whom they work. Individual
performance and organizational performance were by far the most common types of bonuses received by I-
Os at both the doctorate level and the master’s level.
Table 14. Bonuses for Doctorate and Master’s Degree Holders in 2021
Doctorate Master’s
n
370
169
Mean
$49,142 $22,768
Median $19,325 $10,000
Percentile
90th $105,335 $42,600
75th
$40,375 $20,000
50th $19,325 $10,000
25th
$7,575
$4,500
10th
$2,500
$1,948

Page 22 Results
Table 15. Types of Bonuses Received by Doctorate and Master’s Degree Holders in 2021
Bonus Type
Doctorate
Master’s
n
%
n
%
Individual performance 304 41% 140 51%
Organizational Performance 226 31% 118 43%
Group, department, or unit performance 91 12% 43 16%
Sign-on or recruiting bonus 28 4% 11 4%
Retention bonus 28 4% *
Exercising stock options 15 2% *
Special project 14 2% 10 4%
Other (please specify): 17 2% *
*N is too small to report.
For those who listed only one type of bonus, we report mean and median amounts by type of bonus (Table
16). The types of bonus with sufficient group size to report were individual performance bonuses,
organizational performance bonuses, and sign-on bonuses. Individual performance bonuses were slightly
larger than organizational performance bonuses, although the difference was not statistically significant.
Individual bonuses were significantly higher for doctorate-level I-Os than for master’s-level I-Os (t = 2.58,
df(119), p < .05). The difference between doctorate-level organizational performance bonuses and those for
master’s degree holders was not statistically significant. Sign-on bonuses for doctorates were double or
nearly double that of performance bonuses.
Table 16. Amount of bonus by type of bonus in 2021
Doctorate Master's
n Median Mean n Median Mean
Individual performance 95 $10,000 $27,703 31 $7,000 $10,363
Organizational performance 45 $8,000 $20,511 21 $6,000 $12,677
Sign-on or recruiting bonus 15 $18,000 $68,167 *
*N is too small to report.

Page 23 Results
Raises
Historically, I-O salaries have risen over the years.
This is, in part, due to organizations’ efforts to keep
up with the cost of living. However, I-Os can
increase their pay in many ways, including taking
on more responsibilities or receiving a promotion,
moving to a different organization, or receiving a
merit raise. We asked members whether they
received a raise in 2021 and if so, to report the
reason for the raise as well as the size of the raise
as a percentage of their base salary (Tables 17 and
18). In addition to the types of raises listed in the
tables, I-Os reported receiving raises from union
negotiations, changing employers, or lateral job
changes within the same organization; however, the
number of I-Os reporting these types of raises was
too small to report. The most common type of raise
for both doctorate-level and master’s-level I-Os was
given when working for the same employer at the
same job with the same responsibilities. This was
distinguished from a cost-of-living raise, which only 4% (n = 42) of I-Os reported receiving in 2021. It may be
that many employers factor in cost of living increases with merit raises.
Raises were highest (as a percent of salary) for both doctorate-level and master’s-level I-Os who received
a promotion from their current employer. Master’s-level raises were, across the board, slightly higher than
were doctorate-level raises, although given the differential in pay between master’s-level I-Os and
doctorate-level I-Os, the dollar increase for those with a master’s degree may not be as large as for those
with a doctorate.
Table 17. Doctorate-Level Raises as Percent of Salary
Cost of Living
Same Employer
with Promotion
Same Employer,
Same Job, More
Responsibilities
Same Employer,
Same Job, Same
Responsibilities
n
31 62 12 290
Median 2.5% 10.0% 9.0% 3.0%
Mean 2.8% 15.6% 9.3% 4.8%
Percentile
90th
7.4% 32.3% 17.4% 10.0%
75th 3.0% 19.0% 13.8% 5.0%
50th 2.5% 10.0% 9.0% 3.0%
25th
1.0% 7.5% 4.6% 2.5%
10th 1.0% 5.0% 3.6% 2.0%

Page 24 Results
Table 18. Master’s-Level Raises as Percent of Salary
Cost of Living
Same Employer
with Promotion
Same Employer,
Same Job, More
Responsibilities
Same Employer,
Same Job, Same
Responsibilities
n 11 32 12 90
Median 3.0% 13.0% 10.0% 4.0%
Mean 3.4% 17.0% 10.5% 5.8%
Percentile
90th 6.6% 36.3% 19.8% 10.5%
75th 5.0% 22.5% 12.0% 7.2%
50th 3.0% 13.0% 10.0% 4.0%
25th 2.8% 10.0% 8.0% 3.0%
10th 1.5% 6.2% 4.7% 2.5%

Page 25 Results
Benefits
Benefits are an important component of a full
compensation package, and a large majority of I-
Os reported receiving a broad range of
employer-sponsored benefits in 2021. Because
of the differing market demands, constraints, and
types of employment arrangements among
employment sectors, we examined benefits by
job sector. As in the 2019 report, we compared
benefits for doctorate holders with those offered
by employers of master’s degree holders.
However, because similar percentages of
doctorate-level I-Os and master’s-level I-Os work
in similar industries, with the exception of
academia, benefits were generally comparable
across degree level. We did not include those
with master’s degrees working in academia due
to small sample size. In the following sections,
we look at types of benefits available to I-Os through their employers and note differences among sectors
and among degree levels. Overall, the type of benefits offered to I-Os through their employers and the
percentage of employers offering such benefits is similar to results in the 2019 report. The benefits most
commonly offered by employers of I-O psychologists are in these four categories: retirement, health,
disability, and paid time off.
Retirement Benefits
Across sectors, a majority of I-Os were able to participate in defined contribution retirement plans, although
most government employees were also offered a separate pension plan (Figure 11). Retirement benefits
were nearly equally available to doctorate-level and master’s-level employees. As in past reports, a defined
contribution retirement plan and a defined benefit or pension plan were described as follows:
In a defined contribution retirement plan, the organization and the employee pay a set
amount of money or percentage of salary annually into a retirement account while the
employee works at the organization. However, the amount of money the employee will
actually receive upon retirement is not a fixed amount, is not known till the employee
retires, and fluctuates based on the performance of the investments held in the account.
A few examples of defined contribution plans are 401(k) for businesses, 403(b) for tax-
exempt organizations, and SEP IRA for self-employed individuals, small business owners,
and partnerships.
In a defined benefit retirement plan, an organization typically agrees to pay an employee
a set amount of their final salary after the employee retires. For example, a company may
pay retired employees 60% of the average of their last three years of salary. The amount
of retirement benefit is defined, rather than dependent on how money in an individual’s
retirement account, such as a 401k, increases or decreases.

Page 26 Results
Figure 11. Retirement Benefits by Job Sector
Defined Contribution Retirement Plan (e.g., 401k, 403b)
Defined Benefit or Pension Plan
Leave, Health, and Disability Insurance Benefits
Paid time off (PTO) is a common employer benefit across sectors, with the exception of academia. As
shown in Figure 12, only 35% of academic respondents reported being offered PTO. This may be due to the
more flexible work schedules of those who teach at the college or university level. When examining roles
within academia, 90% of administrative staff and 27% of professors reported receiving PTO. Parental leave
was most common in private sector organizations, and much less common in academia. For those working
in the non-profit sector, a larger percentage of doctoral-level employees (51%) than master’s-level
employees (37%) reported being offered this benefit.
88%
71%
76%
84%
95%
64%
87%
Private Sector
Academia
Government
Non-Profit
Doctorate
Master's
N/A
16%
71%
13%
17%
71%
23%
14%
Private Sector
Academia
Government
Non-Profit
Doctorate
Master's
N/A

Page 27 Results
Figure 12. Leave Benefits by Job Sector
Paid Time Off
Parental Leave
Health insurance was the most common benefit offered by employers across all sectors, with 89% of
respondents reporting receiving employer-sponsored health insurance. Figure 13 shows the percentage of
respondents in each sector who are offered health insurance, health savings or flexible spending accounts,
wellness benefits, dental insurance, and vision insurance. Overall, wellness benefits are less common than
other types of health insurance, and least common for those in academia. Health savings accounts/flexible
spending accounts, vision insurance, and dental insurance are quite common across employment sectors,
although again, somewhat less common for academics. Short- and long-term disability insurance are less
common across sectors than are most types of health insurance (Figure 14).
95%
98%
35%
94%
Private Sector
Academia
Government
Non-Profit
Doctorate
Master's
95%
100%
94%
N/A
37%
57%
57%
51%
54%
15%
63%
Private Sector
Academia
Government
Non-Profit
Doctorate
Master's
N/A

Page 28 Results
Figure 13. Health Insurance Benefits by Job Sector
Health Insurance
HSA / FSA
Wellness Benefits
Private Sector
Academia
Government
Non-Profit
Doctorate
Master's
88%
93%
87%
92%
95%
100%
92%
N/A
N/A
61%
63%
52%
75%
Doctorate
Master's
89%
79%
75%
Private Sector
Academia
Government
Non-Profit
Doctorate
Master's
53%
26%
45%
N/A
32%
32%
16%
45%
Private Sector
Academia
Government
Non-Profit

Page 29 Results
Vision Insurance
Wellness Benefits
Dental Insurance
Private Sector
Academia
Government
Non-Profit
Doctorate
Master's
80%
76%
62%
85%
89%
82%
86%
N/A
Doctorate
Master's
88%
83%
78%
88%
95%
96%
89%
N/A
Private Sector
Academia
Government
Non-Profit

Page 30 Results
Figure 14. Disability Benefits by Job Sector
Short-term Disability
Long-term Disability
Life Insurance / AD&D
Doctorate
Master's
76%
39%
42%
75%
Private Sector
Academia
Government
Non-Profit
79%
43%
77%
N/A
Doctorate
Master's
76%
46%
51%
72%
Private Sector
Academia
Government
Non-Profit
89%
57%
78%
N/A
Doctorate
Master's
73%
83%
69%
85%
84%
93%
86%
Private Sector
Academia
Government
Non-Profit
N/A

Page 31 Results
Professional Development and Education Benefits
Additional benefits beyond retirement, health, and leave are of value to employees and organizations offer
them to attract and retain talent. As shown in Figure 15, overall, about half of I-Os reported their employers
offer professional development funds and conference travel funding, although this varied by sector. Tuition
assistance was less common. While relatively rare, research funding was more common in academia (35%)
than in other sectors.
Figure 15. Professional Development and Education Benefits by Job Sector
Professional Development Funds
Tuition Assistance
Doctorate
Master's
63%
41%
43%
45%
Private Sector
Academia
Government
Non-Profit
63%
54%
44%
N/A
Doctorate
Master's
46%
34%
27%
26%
Private Sector
Academia
Government
Non-Profit
47%
43%
33%
N/A

Page 32 Results
Conference Travel Funding
Research Funding / Start-up Budget
Other Benefits
STOCK OPTIONS, PROFIT SHARING, AND BONUS PAY
As expected, stock options and profit sharing are rare in all but the private sector, with about half of private
sector employers offering these benefits to their I-O employees (Figure 16). While more common in private
for-profit companies than in other sectors, bonus pay was fairly common in government and non-profit
organizations and very rare in academia.
Doctorate
Master's
73%
66%
62%
62%
Private Sector
Academia
Government
Non-Profit
42%
61%
44%
N/A
Doctorate
Master's
15%
5%
35%
2%
11%
4%
1%
Private Sector
Academia
Government
Non-Profit
N/A

Page 33 Results
ADDITIONAL BENEFITS
Commuter benefits or technology stipends are offered by less than half of employers and are quite rare in
academia (Figure 17). These types of benefits may become more common if the current remote work trend
continues. Other types of benefits offered by employers included pet insurance, 529 plans, legal insurance,
employee discounts, employee assistance programs, fertility benefits, and others; however, these were
extremely rare. We grouped these under ‘Other Benefits’ in Figure 21.
Figure 16. Stock Options, Profit Sharing, and Bonus Pay by Job Sector
Stock Options or Profit Sharing
Bonus Pay
Doctorate
Master's
5%
0%
1%
58%
Private Sector
Academia
Government
Non-Profit
5%
0%
41%
N/A
Doctorate
Master's
44%
34%
10%
79%
Private Sector
Academia
Government
Non-Profit
47%
37%
68%
N/A

Page 34 Results
Figure 17. Other Benefits by Job Sector
Commuter Benefits
Technology Stipend
Other Benefits
Doctorate
Master's
39%
46%
4%
25%
Private Sector
Academia
Government
Non-Profit
26%
36%
23%
N/A
Doctorate
Master's
17%
10%
14%
43%
Private Sector
Academia
Government
Non-Profit
32%
14%
39%
N/A
Doctorate
Master's
10%
0%
4%
8%
Private Sector
Academia
Government
Non-Profit
0%
0%
6%
N/A

Page 35 Results
Supplemental Income
Many opportunities exist to supplement salaries for those working in academia or as practitioners. Academic
I-Os more often engage in activities to earn supplemental income, and engage in a wider variety of such
activities, than do practitioner I-Os. Tables 19 and 20 show sources of supplemental income and amounts
earned from each source for academics and practitioners. Academics more often engage in additional
teaching than other types of work to supplement their income, with 37% of academics reporting this as a
source of additional income. A second common source of income for academics is through consulting
(30%). Engaging in external research is a less common source of additional income in academia, although
the median income earned from it is higher than from other types of additional work. Practitioners engage in
fewer activities to generate supplemental income and at a lower rate than do academics. The two most
common sources of supplemental income for practitioners were writing (9.5%) or speaking engagements
(6%). Of these, speaking engagements bring in the highest median supplemental income.
Table 19. Academic Supplemental Income by Source
Additional
Teaching
Consulting
Speaking
Writing
Textbook
Review
Internal
Research
Grants
External
Research
Grants
Other:
Administration
n
107
87
30
34
14
52
34
11
Median
$9,669
$8,000
$1,000
$1,000
$325
$8,000
$15,500
$7,500
Mean
$13,242
$31,770
$3,711
$2,415
$450
$15,520
$20,855
$8,109
Percentile
90th
$28,400
$68,400
$9,500
$8,000
$1,000
$48,500
$48,500
$16,597
75th
$16,000
$29,000
$3,000
$2,125
$850
$20,000
$20,500
$14,000
50th
$9,669
$8,000
$1,000
$1,000
$325
$8,000
$15,500
$7,500
25th
$5,000
$3,000
$338
$500
$188
$4,500
$5,863
$3,000
10th
$3,000
$1,740
$200
$90
$100
$1,685
$2,400
$1,000
Note. ‘Other: Administration’ includes administrative work, additional advising role, program director, department
head supplement, associate chair stipend, or associate dean stipend.
Table 20. Practitioner Supplemental Income by Source
Speaking
Writing
Textbook Review
n
46
70
14
Median
$8,000
$5,500
$450
Mean
$9,902
$19,150
$7,298
Percentile
90th
$21,196
$50,000
$42,500
75th
$15,250
$20,000
$3,750
50th
$8,000
$5,500
$450
25th
$3,500
$2,000
$238
10th
$2,350
$1,000
$110

Page 36 Results
The Impact of COVID-19
Unlike previous periods of time between SIOP income and employment surveys, the last two years saw
major disruptions in the workforce worldwide. The COVID-19 pandemic did not impact income for the
majority of I-Os, but its effects were felt to varying degrees across job sectors, in practice and academia,
and across demographic categories. The brunt of COVID-19’s impact on income for I-Os was felt in 2020,
with 2021 seeing a lessening of those effects.
COVID-19 Impact on Remote Work Arrangements
Due to the pandemic, work arrangements changed dramatically in 2020 for both practitioner and academic I-
Os. As in past surveys, we asked members about the amount of time they worked remotely or in person at
an office or place of business. However, in the current survey, we asked members to report their work
arrangements for three timepoints: in 2020 before COVID-19, in 2020 during COVID-19, and in 2021. Figure
18 shows overall percentages of I-Os with remote, hybrid, and in-person work arrangements at these three
timepoints. “Remote” are those working 100% of the time somewhere other than at the office; “Hybrid” are
those working at least some percentage of time at the office and some percentage of time not at the office;
and “In Person” are those working 100% of time in the office. At the beginning of 2020 before the pandemic,
a majority of I-Os had hybrid arrangements (59%) – working part of the time at home and part of the time in
the office – while 17% worked fully remotely. During the height of COVID-19 in 2020, the percentage of I-Os
working fully remotely dramatically increased to 74%. In 2021, the percentage of I-Os working fully remotely
dropped to 42%; still much higher than the 17% of I-Os working fully remotely before the pandemic.
However, the percentage of those working in-person in 2021 remained at the 2% as was seen during the
latter part of 2020. These changes reflected trends in work arrangement throughout the U.S. workforce in
2020 and into 2021
6
.
Figure 18. Work Arrangements in 2020 and 2021
Due to the differences in work schedules and job demands between I-O practitioners and academics, we
examined work arrangements for these two groups separately. Figure 19 shows work arrangements at the
three timepoints for practitioners. Because practitioners made up the majority of the sample, these trends
are similar to those found in the overall sample.
6
Pew Research Center reported 71% of workers who could perform their jobs from home worked remotely all or most of the
time by October 2020. By January 2021, this had decreased to 59%. Retrieved from https://www.pewresearch.org/social-
trends/2022/02/16/covid-19-pandemic-continues-to-reshape-work-in-america/.
17%
74%
42%
59%
23%
56%
25%
2%
2%
2020 Before COVID 2020 During COVID In 2021
Remote Hybrid In Person

Page 37 Results
Figure 19. Practitioner Work Arrangements in 2020 and 2021
Comparing I-Os in academia to those working as practitioners, a greater percentage of academics had
hybrid work arrangements before the pandemic, during the pandemic, and in 2021 than did their practitioner
counterparts. Figure 20 shows work arrangements for academics across the three time points. Traditionally,
academic work schedules have a great amount of scheduling flexibility, allowing professors and instructors
to do much of their work away from campus except when teaching or advising – to the extent these activities
are not done online. However, during the pandemic in 2020, only 56% of academics switched to fully remote
work compared to 81% of practitioners. This may have been due to the ongoing need for some academics
to teach in-person classes in the 2020 fall term. In 2021, the percentage of academic I-Os working fully
remotely dropped nearly two-thirds from mid-pandemic 2020 levels. In keeping with the 2021 trend for
practitioners, academic I-Os remained either fully remote or in hybrid working arrangements and did not
return to the same level of in-person work arrangements as seen before the pandemic.
Figure 20. Academic Work Arrangements in 2020 and 2021
22%
81%
69%
51%
16%
29%
27%
3%
2%
2020 Before COVID 2020 During COVID In 2021
Remote Hybrid In Person
2%
56%
20%
78%
43%
78%
20%
1%
2%
2020 Before COVID 2020 During COVID In 2021
Remote Hybrid In Person

Page 38 Results
When comparing salaries across the three different work arrangements, we examined doctorate-level and
master’s-level salaries separately. While the median salary for doctorate-level I-Os working remotely was
higher than for those with hybrid work arrangements or working in person across all time points, these
differences were not statistically significant. For master’s-level I-O’s, before the pandemic those with hybrid
work arrangements earned significantly more than those working in person (F(2, 270) = 4.99, p < .01).
As discussed in a previous section of this report, salaries vary by geographic location. These location-based
pay differences are most often influenced by the location of the company or its offices rather than the
location of an employee. However, some companies adjust pay for remote employees to align with the
location in which the employee lives. For the majority of I-Os, 2021 salaries were not impacted by changes
in work location due to remote work arrangements (Figure 21). If employees who shifted from hybrid to fully
remote work arrangements during the pandemic remain fully remote or choose to move to a different area
from where their workplace is located, companies may change their pay policies. It may be too soon to tell
what policies companies will adopt in the long term for remote work or location-based pay adjustments in the
years after the pandemic.
Figure 21. Remote Work Location During COVID-19 Impact on Pay
“For the majority of I-Os, 2021 salaries were
not impacted by changes in work location
due to remote work arrangements.”
88%
2% 1%
5%
2%
90%
1% 2%
4%
2%
Did not impact
my pay
Reduced
my pay
Increased
my pay
Don't know Not remote
in 2020
2020 2021

Page 39 Results
COVID-19 Impact on Employment
IMPACT ON EMPLOYMENT BY JOB SECTOR
The effects of the pandemic on income were felt more severely by I-Os in some job sectors than in others.
Figures 22 and 23 show the impact of the pandemic on job loss or income changes in 2020 and in 2021. I-
Os working in government reported the least disruption to work hours or income in both 2020 and 2021.
More than a quarter of self-employed I-Os experienced involuntary job loss in 2020, with nearly a third
reporting other income changes (e.g., salary, bonus, or benefit reduction) that year. These effects for self-
employed I-Os were lessened in 2021, although self-employed I-Os were still impacted to a greater degree
than were I-Os working in other sectors. As a comparison, a survey of U.S. households in August 2020
reported that 15% of adults had lost their jobs or been laid off due to COVID-19
7
, with the hardest hit
industries being retail, entertainment, and service
8
. Workers who could work from home may have been
more likely to continue working during the pandemic. As discussed in an earlier section of this report, I-Os
were generally able to make the shift from in-person or hybrid work arrangements to fully remote
arrangements when needed.
Figure 22. COVID-19 Impact on Income in 2020 by Job Sector
Figure 23. COVID-19 Impact on Income in 2021 by Job Sector
7
As reported by Pew Research Center. Retrieved from https://www.pewresearch.org/social-trends/2020/09/24/economic-
fallout-from-covid-19-continues-to-hit-lower-income-americans-the-hardest/.
8
As reported by Business Insider on May 12, 2020. Retrieved from https://www.businessinsider.com/jobs-industries-careers-
hit-hardest-by-coronavirus-unemployment-data-2020-5.
7%
1%
24%
70%
2% 1%
22%
76%
3% 0% 4%
94%
3% 2%
25%
72%
26%
0%
32%
53%
Involuntary job loss/
reduced hours
Voluntary job loss/
reduced hours
Other income changes No impact
Private Sector Academia Government Non-Profit Self-Employed
1% 0%
10%
89%
1% 0%
12%
87%
0% 0% 1%
99%
0% 0%
13%
87%
16%
0%
21%
63%
Involuntary job loss/
reduced hours
Voluntary job loss/
reduced hours
Other income changes No impact
Private Sector Academia Government Non-Profit Self-Employed

Page 40 Results
IMPACT ON EMPLOYMENT FOR PRACTICE AND ACADEMIA
Figures 24 and 25 show how COVID-19 impacted employment and income for academics and for
practitioners. In 2020, a greater percentage of practitioners than academics experienced involuntary job
loss, although both groups reported similar incidence of voluntarily quitting/ reducing work hours or other
income changes. In 2021, incidence of job loss or income changes had decreased by about half for both
practitioners and academics. Most respondents who reported losing their jobs in 2020 were able to find
employment again in 2021.
Figure 24. COVID-19 Impact on Income in 2020 for Practice and Academia
Figure 25. COVID-19 Impact on Income in 2021 for Practice and Academia
7%
1%
22%
72%
2% 1%
22%
76%
Involuntary job loss/
reduced hours
Voluntary job loss/
reduced hours
Other income changes No impact
Practitioner Academic
1% 0%
10%
89%
1% 0% 12%
87%
Involuntary job loss/
reduced hours
Voluntary job loss/
reduced hours
Other income changes No impact
Practitioner Academic

Page 41 Results
IMPACT ON EMPLOYMENT BY GENDER
Men and women experienced similar levels of job loss and reduced work hours due to COVID-19 (Table 21).
However, in 2020 women experienced a significantly greater percentage of other types of income changes
due to the pandemic than did men (χ
2
(1, N =1,010) = 7.9, p < .01).
Table 21. Impact of COVID-19 on Income by Gender
Impact
2020
2021
Men
Women
Men
Women
Involuntary job loss/reduced hours
5%
6%
1%
2%
Voluntary job loss/reduced hours
1% 1% 0% 0%
Other income changes
18%
26%
10%
10%
No impact
76%
70%
88%
89%
IMPACT ON EMPLOYMENT BY RACE/ETHNICITY
In the sample, race and ethnicity groups other than white were too small to examine by type of income
change, so we compared COVID-related employment changes for those who identified as white and for
those who identified as other than white (including multi- or bi-racial). A slightly higher percentage of I-Os
identifying as other than white experienced other income changes due to the pandemic in both 2020 and
2021 (Table 22).
Table 22. Impact of COVID-19 on Income by Race/Ethnicity
Impact
2020
2021
White
Non-white
White
Non-white
Involuntary job loss/reduced hours
5% 6% 1% 1%
Voluntary job loss/reduced hours
1%
1%
0%
1%
Other income changes
21% 25% 10% 13%
No impact
74%
70%
89%
86%
Note. Race/ethnicity subgroup N’s were too small to analyze by category.

Page 42 Results
OTHER INCOME CHANGES DUE TO COVID-19
Looking closer at COVID-19’s impact on I-O income, we asked members to report the type of income
changes (other than job loss or reduction of hours) they experienced due to the pandemic (Figure 26). In
2020, the largest percentages reported a reduction in the amount of their bonus (8.9%) or a reduction in
salary (8.4%). The third largest income change during 2020 was a reduction in benefits (7%). In 2021, these
percentages decreased by about a third or more. Interestingly, a little more than 2% of I-Os experienced an
income increase due to the pandemic in 2020 and in 2021. It is unclear whether this is due to increased
work hours, incentive pay, or gaining new employment.
Figure 26. Other Income Changes Due to COVID-19
“In 2020, the most notable effects of the pandemic
on I-O income were a reduction in bonus amount
(8.9%) or a reduction in salary (8.4%).”
8.4%
8.9%
7.0%
0.4%
2.4%
0.1%
1.8%
3.2%
2.6%
0.3%
2.2%
0.0%
Salary reduction Bonus reduction Benefit reduction Location pay
reduction
Income increase Other
2020 2021

Page 43 Results
OTHER INCOME CHANGES BY JOB SECTOR
Comparing COVID-related income changes (other than job loss or reduction of hours) by job sector in 2020
(Table 23), salary reduction affected the private sector and non-profit organizations about equally. The group
size for self-employed I-Os was too small to report types of income changes. A greater percentage of I-Os in
the private sector experienced bonus reductions. Academics and those working in the non-profit sector
experienced greater incidence of benefit reduction. In 2021, income-related effects of COVID for I-Os had
eased substantially.
Table 23. Other Income Changes Due to COVID-19 by Job Sector
2020
Type of Change Private Sector Academia Government Non-Profit
Salary reduction 10% 7% 1% 10%
Bonus reduction 11% 6% 1% 8%
Benefit reduction 7% 9% 1% 8%
Location pay reduction 0% 0% 0% 0%
Income increase 3% 1% 0% 2%
2021
Type of Change Private Sector Academia Government Non-Profit
Salary reduction 1% 3% 1% 3%
Bonus reduction 3% 4% 0% 3%
Benefit reduction 2% 5% 0% 7%
Location pay reduction 0% 0% 0% 0%
Income increase 3% 1% 0% 3%

Page 44 Results
OTHER INCOME CHANGES BY GENDER AND RACE/ETHNICITY
Among I-Os in 2020, a greater percentage of women than men experienced salary reduction or bonus
reduction as a result of the pandemic, although these differences were not statistically significant (Table 24).
This is not likely a function of where women work compared to where men work. Men and women are
roughly proportionally represented among industries and sectors in the sample. Both white and non-white I-
Os reported similar percentages of income changes due to COVID-19 (Table 25).
Table 24. Other Income Changes Due to COVID-19 by Gender
2020 2021
Type of Change Men Women Men Women
Salary reduction 8.4% 10.0% 2.0% 1.0%
Bonus reduction 8.9% 11.0% 3.0% 3.0%
Benefit reduction 7.0% 7.0% 2.0% 3.0%
Location pay reduction 0.4% 0.4% 0.0% 0.0%
Income increase 2.4% 2.4% 3.0% 2.0%
Table 25. Other Income Changes Due to COVID-19 by Race/Ethnicity
2020 2021
Type of Change White Non-white White Non-white
Salary reduction 8.4% 8.0% 1.6% 2.3%
Bonus reduction 8.9% 9.2% 3.0% 4.6%
Benefit reduction 7.0% 6.9% 2.4% 2.9%
Location pay reduction 0.0% 1.1% 0.0% 1.1%
Income increase 2.5% 1.7% 2.2% 2.9%
Note. Race/ethnicity subgroup N’s were too small to analyze by category.

Page 45 Results
COVID-19 Impact on Work Hours
A small percentage of I-Os lost their jobs due to COVID-19. The largest percentage of those who lost work
in 2020 were furloughed or laid off without pay (1.6%), and the second largest percentage involuntarily had
their work hours reduced (1.4%). Of those who lost their job in 2020 due to COVID-19, most experienced
some delay before finding another job. When comparing the pandemic’s impact in 2020 on work hours
across job sectors, those in academia experienced the least disruption (1.6%), followed by non-profit
employees (1.7%), government employees (2.8%), and private sector employees (6.5%). Conversely, in
2021, academics experienced a larger percentage of reduced work hours or being furloughed without pay
(1.3%, compared with 1.2% in the private sector, and 0% in non-profits and in government). However, it is
important to remember the numbers of individuals who experienced these effects are very small and these
differences in 2021 are within one percentage point of one another.
COVID-19 Impact on Benefits
In response to the pandemic, many organizations offered their employees additional benefits. I-Os reported
receiving a wide range of COVID-related benefits starting in 2020. Many of these benefits were still in place
in 2021, although they were not as widespread. Comparing COVID-related benefits across job sector
(Table 26), those in academia and in government were less likely to be offered many of the benefits with
the exceptions of access to PPE and access to COVID tests. This same pattern held for 2021.
Table 26. COVID-19-related Benefits by Job Sector
2020
Benefit
Private
Sector
Academia Government Non-Profit
Flexible work arrangements 51% 33% 44% 53%
COVID-designated time off 36% 17% 46% 47%
Mental health benefits/resources 33% 8% 10% 27%
Home office equipment allowance/stipend 30% 10% 7% 25%
Access to PPE 23% 32% 23% 42%
Changes to vacation or PTO policies 23% 7% 16% 23%
Access to COVID tests 21% 33% 16% 30%
Telemedicine options
19% 7% 10% 17%
Enhanced childcare credits 10% 1% 1% 10%

Page 46 Results
Table 26. COVID-19-related Benefits by Job Sector (continued)
2021
Benefit
Private
Sector
Academia Government Non-Profit
Flexible work arrangements 40% 30% 39% 52%
COVID-designated time off 29% 15% 36% 42%
Mental health benefits/resources 29% 11% 10% 30%
Home office equipment allowance/stipend 24% 6% 7% 23%
Access to COVID tests 22% 34% 19% 38%
Access to PPE 21% 33% 26% 43%
Changes to vacation or PTO policies 20% 5% 16% 15%
Telemedicine options 17% 8% 7% 13%
Enhanced childcare credits 7% 1% 3% 8%

Page 47 Results
Caregiving
In addition to the information provided in past reports,
this year we asked members about their caregiving
responsibilities at home. Many I-Os are care
providers for children, relatives with a disability, or
older relatives. It is an ongoing struggle for many to
find a balance between responsibilities at work and
those outside of work. This balance may have been
even more challenging to attain during the COVID-19
pandemic. In the U.S., as schools and care centers
closed in 2020 and remained closed into 2021, 58%
of employees with children and about half of
employees caring for adults experienced an increase
in their at-home caregiving commitments
9
. Employee
caregiving responsibilities outside of work is an
important consideration for employees and
employers in any year, but the past two years have
seen unprecedented challenges for those in
caregiving roles as families faced uncertainty and
employers tried to meet the changing needs of their employees
10
.
In this sample, 39% of respondents reported having caregiving responsibilities. Of those, 82% reported
caring for children, 13% reported caring for older adults, and 4% reported caring for disabled adults. We also
asked members about how they share their caregiving responsibilities with others in or outside of the
household. Table 27 shows the percentage of respondents who shared or did not share caregiving with
others, and what type of caregiving assistance they had.
Table 27. Caregiving Responsibilities for Those Who Reported Being a Caregiver
Responsibility % of Caregivers
Other than self or partner 30%
Self and partner equally 18%
Partner/Spouse 17%
Self, partner, and outside care 17%
Self 8%
Self and outside care 6%
Other 3%
Partner and outside care 2%
9
As reported by S&P Global and AARP. Retrieved from https://www.spglobal.com/en/research-insights/featured/companies-
expand-family-friendly-policies-but-focus-favors-parents-over-caregivers.
10
As reported by S&P Global and AARP. Retrieved from https://www.spglobal.com/en/research-insights/featured/companies-
expand-family-friendly-policies-but-focus-favors-parents-over-caregivers
Page 48 Results
Although caregiving responsibilities present additional challenges to employee work schedules, I-Os in
caregiving roles earned more than their non-caregiving counterparts (Table 28). However, the mean
difference in salaries was not statistically significant. To check whether this difference was due to years of
experience or job roles, we compared caregivers and non-caregivers by years since degree. While there
were more non-caregivers who were less than 10 years out from their degree, the salary ranges for
caregivers versus non-caregivers at each cohort were comparable. Mean salaries were higher for caregivers
at the 5-to-9 years, 10-to-14 years, and the 15-to-19 years cohorts, while mean salaries were higher for non-
caregivers at the 2-to-4 years, 20-to-24 years, and 25-and-over years cohorts. Comparing job titles across
caregivers and non-caregivers, 4.3% of non-caregivers were in vice-president or higher positions while 7.3%
of caregivers were in these job roles. This may account for the higher median and mean salary for
caregivers compared to non-caregivers. We also looked at the percent of caregivers versus non-caregivers
who had doctorate or master’s degrees, and found caregivers included a greater percentage of doctorate
degree holders than did non-caregivers. Doctorate-level caregivers (n = 318) earned a median salary of
$165,022 while the median salary for doctorate-level non-caregivers (n = 388) was $169,737, although this
difference was not statistically significant.
Because caregiving can conflict with work schedules, we compared the number of hours worked per week
for caregivers and non-caregivers. Somewhat surprisingly, caregivers reported working an average of 44.7
hours per week (median = 45) while non-caregivers worked an average of 44.3 hours per week (median =
40). However, there was quite a bit of variance in the number of hours worked for full-time I-Os, so we
looked at whether pay differences between caregivers and non-caregivers held when accounting for the
number of hours worked (Table 29). For those working 30 to 39 hours per week, the median caregiver salary
was higher than that of non-caregivers in 2020 and lower than that of non-caregivers in 2021. However,
mean differences for these comparisons were not statistically significant. For I-Os working 40 or more hours
per week, caregivers earned more than non-caregivers in 2020 and in 2021, although, again, these
differences did not reach statistical significance.
Table 28. Base Salary for Caregivers and Non-Caregivers
Caregiver Non-Caregiver
n 396 582
Median $135,500 $118,450
Mean $157,973 $147,460
Note. Caregiver = caregiver in 2020 or in 2021; Non-Caregiver = not a caregiver in 2020 nor in 2021.
“In this sample, 39% of respondents
reported having caregiving responsibilities.”

Page 49 Results
Table 29. Caregiving Responsibilities Impact on Salary
Working 40 Hours Per Week
2020 Caregiving 2021 Caregiving
Caregiver Non-Caregiver Caregiver Non-Caregiver
n 327 571 331 585
Median $142,000 $120,000 $160,492 $120,000
Mean $161,718 $148,424 $140,000 $148,532
Working 30 to 39 Hours Per Week
2020 Caregiving 2021 Caregiving
Caregiver Non-Caregiver Caregiver Non-Caregiver
n 23 29 26 29
Median $116,400 $105,000 $118,200 $105,000
Mean $144,848 $118,609 $117,508 $140,999
Note. Caregiver = caregiver in 2020 or in 2021; Non-Caregiver = not a caregiver in 2020 nor in 2021.
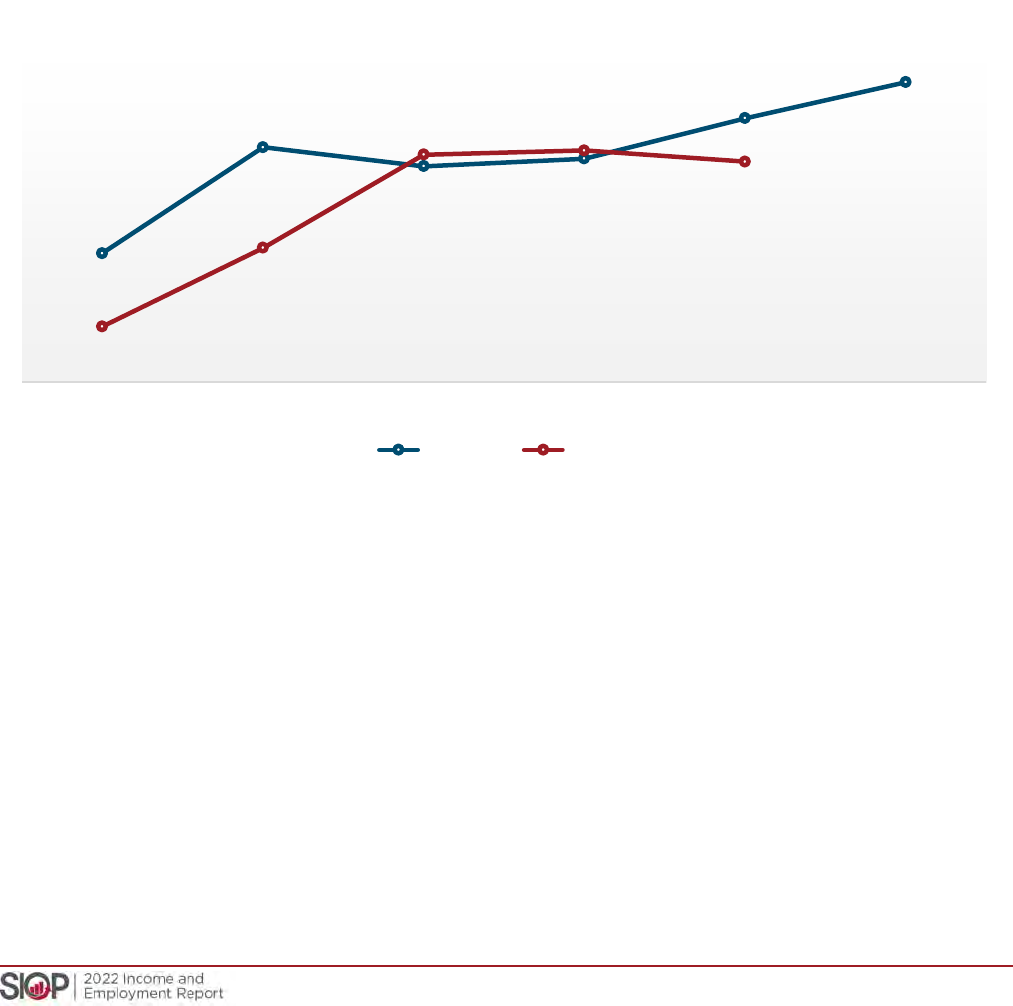
Page 50 Results
Demographics
In this section, we report salary information by demographic group. I-Os represent a wide range of ages,
races, ethnicities, gender identities, ability statuses, and educational backgrounds. We examined the extent
to which I-O incomes differ based on these characteristics.
Age
I-O salaries generally increase with age; this may be because age correlates strongly with work experience,
and work experience is positively correlated with increasing responsibilities and job title. Both master’s-level
and doctorate-level salaries increased with age (Figure 27), although from age 45 to age 54, master’s-level
salaries did not increase. However, it is important to note that group sizes in these age ranges are small (n =
13 for 45-to-49, and n = 10 for 50-to-54) for master’s degree holders.
Figure 27. Median Base Salary by Age Group
Note. Median salary for master’s degree holders 55 and older is not reported due to insufficient group size.
Disability
Although the median base salary for those who reported having a disability was less than for those who
reported no disability, the difference was not statistically significant. The median salary for I-Os with a
disability was 90% that of their counterparts without a disability (Table 30). We looked at whether degree
level was an influencing factor in the salary difference. Of those with a disability, 66% were doctorate
degree holders and 33% held master’s degrees, whereas for those without a disability, 73% had
doctorate degrees and 26% had master’s degrees. To see if this difference in degree level contributed
to the difference in median income, we compared salaries for those with doctorate degrees. Median
income for doctorate-level I-Os with a disability was $129,000 (mean = $175,811), and median income
for those without a disability was $139,840 (mean = $165,237). The mean difference in doctorate-level
salaries was also not statistically significant.
$112,972
$148,277
$142,000
$144,500
$158,000
$170,000
$88,500
$114,750
$145,861
$147,272
$143,500
< 35 35-39 40-44 45-49 50-54 55+
Doctorate Master's

Page 51 Results
Table 30. Base Salary for Those With and Without a Disability
With Disability Without Disability
Income With Disability as
Percentage of Income
Without Disability
n 164 819
Median $116,700 $130,000 90%
Mean $150,119 $151,296 99%
Gender
The gender pay gap for I-Os decreased in 2021. In 2018 women I-Os earned 87% as much as their male
counterparts (Figures 28 and 29). In 2021, women earned 94% as much as men in I-O jobs. This is by far
the largest gain for women’s salaries as a percentage of men’s since SIOP began publishing its income
report. It should be noted, however, that samples vary across survey administrations and results for 2021 do
not necessarily reflect the same respondents as in previous years.
Women working as practitioners had the largest gain in salary as a percentage of men’s salary in 2021.
Women earned 99% of what men earned in practitioner roles. In academia, women’s salaries were 89%
of men’s salaries. However, the differences between men’s and women’s salaries were not statistically
significant. A table giving sample sizes and group sizes by gender for each survey cohort is provided in
the Appendix.
Figure 28. Gender Wage Gap Over Report Years
$130,195
$121,900
1982 1988 1994 1997 1999 2000 2002 2003 2005 2006 2008 2009 2011 2012 2014 2015 2018 2021
Men Women

Page 52 Results
Figure 29. Women's Income as a Percent of Men's Income Over Time
Women’s overall gains in salary parity with men have not affected all cohorts equally. When comparing
men’s and women’s doctorate-level salaries by years since earning degree, women who earned their
doctorate degrees 25 or more years ago earn only 78% of what men with comparable years of experience
earn (Table 31). Women in this group also earn less than their counterparts with 20 to 24 years of
experience. However, these differences were not statistically significant, in part due to small subgroup sizes.
The drop-off in women’s salaries for the 25+ cohort likely contributes to the overall decrease in doctorate
salaries discussed in the Qualifications section of this report for those at 25 or more years since earning
their degree. One possible explanation for the gender effect for this cohort could be that women starting their
careers 25 or more years ago may have been less likely to move into or be promoted into higher paying
positions over time than were men with equivalent experience. Another explanation is that a disparity in
starting salary compounds over time, with percentage increases in income (i.e., raises as a percent of
salary) resulting in greater income gains for those with higher starting salaries. The subgroup sizes for
comparing doctorate-level men’s and women’s salaries within the same job title were too small to test this.
Tables 31 through 34 show salary comparisons for doctorate-level men and women practitioners and
academics, and for master’s-level men and women. Subgroup sizes were quite small in some cases, and for
men at fewer than 2 years since their degree, often too small for reporting salary information.
“In 2021, women earned 94% as much as
men in I-O Psychology jobs, and this pay
difference was not statistically significant.”
81.4%
80.6%
78.0%
78.3%
82.4%
82.8%
83.5%
82.6%
82.1%
85.0%
83.3%
83.6%
84.8%
87.9%
88.2%
89.7%
86.9%
94.0%
1982 1988 1994 1997 1999 2000 2002 2003 2005 2006 2008 2009 2011 2012 2014 2015 2018 2021

Page 53 Results
Table 31. Doctorate-level Median Income by Gender and Years Since Earning Degree
Men Women
Women's Salary as a
Percent of Men's
Years with
Doctorate
n Salary n Salary
< 2 * * 17 $100,000 *
2 to 4 47 $110,500 59 $110,000 100%
5 to 9 65 $132,000 90 $135,000 102%
10 to 14 41 $142,000 44 $151,500 107%
15 to 19 30 $150,559 41 $146,694 97%
20 to 24 33 $180,000 22 $189,000 105%
25+ 58 $196,500 40 $153,562 78%
*N is too small to report.
Table 32. Doctorate-level Median Income by Gender for Practitioners
Men Women
Women's Salary as a
Percent of Men's
Years with
Doctorate
n Salary n Salary
< 2 * * 15 $100,000 *
2 to 4 38 $126,000 47 $117,000 93%
5 to 9 44 $138,500 61 $151,928 110%
10 to 14 19 $152,000 33 $160,000 105%
15 to 19 15 $190,000 24 $166,000 87%
20 to 24 21 $200,000 11 $210,000 105%
25+ 24 $224,500 25 $164,000 73%
*N is too small to report.

Page 54 Results
Table 33. Doctorate-level Median Income by Gender for Academics
Men Women
Women's Salary as a
Percent of Men's
Years with
Doctorate
n Salary n Salary
2 to 4 * * 12 $92,690 *
5 to 9 21 $99,100 29 $103,333 104%
10 to 14 22 $129,500 11 $98,456 76%
15 to 19 15 $122,806 17 $117,000 95%
20 to 24 12 $100,500 11 $144,000 143%
25+ 34 $120,150 15 $110,876 92%
*N is too small to report.
Table 34. Master’s-level Median Income by Gender and Years Since Earning Degree
Men Women
Women's Salary as a
Percent of Men's
Years with
Master’s Degree
n Salary n Salary
< 2 * * 10 $67,500 *
2 to 4 23 $90,000 49 $83,000 92%
5 to 9 31 $99,174 45 $98,000 99%
10 to 14 16 $124,500 15 $116,400 93%
15 to 19 * * 11 $162,000 *
*N is too small to report.

Page 55 Results
Race and Ethnicity
For doctorate degree holders, those identifying as white earned significantly more than those identifying as a
race other than white (t(479) = -2.55, p < .05). Salary did not significantly differ by race for master’s degree
holders (Table 35). Group sizes were too small to compare incomes between each race/ethnicity category.
However, Figure 30 shows median salary comparisons for race/ethnicity groups with n > 10. Although
salaries for I-Os in all race/ethnicity groups have increased since 2018, disparities among race/ethnicity
groups persist.
Table 35. Base Salary by Degree Level and Race
Doctorate Degree Master's Degree
White Non-White White Non-White
n 591 124 218 51
Median $139,680 $130,000 $100,600 $96,000
Mean $171,883 $144,631 $110,494 $102,185
Figure 30. Doctorate-level Median Income by Race/Ethnicity
$117,000
$127,500
$130,000
$138,500
$139,680
Black or African American
(n = 17)
Multiracial
(n = 36)
Asian
(n = 47)
Hispanic/Latinx/Spanish
(n = 21)
White
(n = 591)

Page 56 Results
Race by Gender
We examined gender pay gaps within race/ethnicity categories where sample size allowed (Figure 31).
Although doctorate-level Asian men and doctorate-level multiracial men earned more than their female
counterparts, these differences were not significant. This is likely in part due to the small group sizes at this
level of analysis, along with substantial variation in salaries within subgroups.
For the Black or African American group, male sample sizes were too small to allow comparisons between
salaries for men and women. We compared women’s salaries in this group to their overall group median.
Black or African American women earned a median salary of $125,000 compared to the overall median
salary for the African American group of $110,500. However, due in part to the small group sizes, the
difference in mean salary was not statistically significant. For the Hispanic/Latinx/Spanish group, the
women’s sample size was too small to make credible comparisons with Hispanic/Latinx/Spanish men’s
salaries or with the overall racial group.
Figure 31. Doctorate-level Median Income by Gender and Race
When comparing the salaries of women across racial categories, using the median salary of women in
the white racial group as the reference point, Black or African American and multiracial women make 95
cents on the dollar compared to white women. Asian women make less than their counterparts in the other
race categories (Figure 32), earning 91 cents on the dollar compared to white women.
Figure 32. Doctorate-level Median Income for Women by Racial Category as a Percent of White
Women's Income
$130,000
$127,500
$137,000
$139,242
$137,500
$140,000
Asian (n = 47) Multiracial (n = 36) White (n = 591)
Women Men
$0.91
$0.95 $0.95
Asian (n = 27) Black or African American (n = 12) Multiracial (n = 27)

Page 57 Results
Degree Type
The percentage of doctorate degrees and master’s degrees of those in the white racial category (73% and
27%, respectively) was nearly equal to those in the non-white category (72% and 28%, respectively). The
difference in median income for doctorate holders and master’s degree holders decreased from 40.6% in
2018 to 37% in 2021 (Table 36).
Overall, men held a greater proportion of doctorate degrees compared to master’s degrees (76% doctorate
holders and 24% master’s degree holders) than did their female counterparts (70% doctorate holders and
30% master’s degree holders).
Table 36. Median Income by Survey Year for Doctorate and Master’s Degree Holders
Doctorate Master's
Percent
Difference
Year n Income n Income
1982 844 $42,850 96 $43,000 -0.4%
1988 1448 $60,000 171 $51,500 16.5%
1994 1124 $71,000 104 $59,500 19.3%
1997 1231 $80,000 99 $55,000 45.5%
1999 882 $83,000 117 $58,000 43.1%
2000 905 $90,000 126 $67,000 34.3%
2002 904 $83,750 131 $60,000 39.6%
2003 922 $87,714 133 $65,000 34.9%
2005 931 $92,000 139 $68,000 35.3%
2006 942 $98,500 141 $72,000 36.8%
2008 869 $102,000 141 $72,000 41.7%
2009 904 $105,000 148 $74,500 40.9%
2011 921 $110,000 175 $75,000 46.7%
2012 938 $113,200 182 $80,750 40.2%
2014 802 $112,000 238 $76,650 46.1%
2015 817 $118,818 246 $84,500 40.6%
2018 1067 $125,000 318 $88,900 40.6%
2021 733 $137,000 275 $100,000 37.0%

Page 58 Results
When examining degree type by age, younger I-Os are more likely to have a master’s degree than are their
older counterparts, particularly for those under 35. The percentage of respondents under 35 who hold a
master’s degree is nearly double that of the 35-to-39-year-old cohort (Figure 33).
Figure 33. Degree Type by Age Group
47%
25%
18%
15%
14%
3%
53%
75%
82%
85%
86%
97%
< 35
35-39
40-44
45-49
50-54
55+
Doctorate Master's

Page 59 Conclusion
CONCLUSION
This report provides an overview of the current
state of income and employment for those working
in the field of industrial-organizational psychology.
Several findings from past reports still hold true.
Doctorate-level I-Os have a higher median income
than do master’s level I-Os. Practitioner salaries
are higher on average than the salaries of those in
academia. And among academics, those working
in business schools or departments have a higher
median income than those in psychology
departments. The median income for women is
still less than that of men, although the gender pay
gap has shrunk.
COVID-19 was a major market disruption in 2020
and 2021, but I-Os generally fared well through the
pandemic. A small percentage of members
experienced income or employment loss in 2020, and this percentage decreased by about half in 2021.
Many employers of I-Os acknowledged the pandemic challenges by offering additional time off or more
flexible work arrangements.
The results of this most recent survey provide students preparing for a career in this field, I-Os newly
entering the job market, and experienced I-Os seeking a job change or renegotiating with current employers
with information that can be leveraged to inform job choice and aid in making decisions about individual
career growth. Industrial-organizational psychologists continue to contribute to organizations in a wide
variety of industries and across job sectors, and their value to the world of work is reflected in the steady
employment and income trends reported here.

Page 60 Appendix
APPENDIX
Subgroup sizes in the sample limited the analyses we were able to conduct. In our sample, the following
race/ethnicity groups were of sufficient size to report overall salary information for: White (n = 860), Asian (n
= 67), Black or African American (n = 28), Hispanic, Latinx, or Spanish (n = 30), bi-racial or multi-racial (n =
57), Prefer not to respond (n = 21). Other race/ethnicity categories with under 10 respondents: American
Indian or Alaska Native, East European Jewish, Saami, and Middle Eastern North African. Regarding age,
the median age in the sample was 38 (M = 41.3, SD = 11.4, min. = 24, max. = 81). The sample included 29
I-Os who identified as military veterans.
Historical Comparisons
Table 37. Sample Characteristics Across Prior Survey Administrations
1982 1988 1994 1997 2000 2003 2006 2009 2012 2015 2018 2021
Gender
Men 84% 79% 71% 67% 65% 58% 58% 54% 56% 51% 48% 46%
Women 16% 21% 29% 33% 35% 42% 42% 46% 45% 49% 52% 53%
Other N/A N/A N/A N/A N/A N/A N/A N/A N/A N/A 0% 1%
Membership Type
Associate N/A 10% 6% 7% 10% 12% 14% 14% 15% 17% 17% 22%
Member N/A 82% 86% 86% 83% 82% 80% 80% 79% 74% 75% 71%
Fellow N/A 8% 9% 7% 7% 6% 6% 6% 6% 6% 7% 7%
Employment Status
Full-time N/A 87% 89% 86% 86% 95% 97% 95% 95% 96% 97% 96%
Part-time N/A 5% 3% 8% 9% 5% 3% .05% 500% 4% 3% 4%
Location
New York
area
4% 14% 11% 10% 11% 7% 8% 7% 6% 6% 4% 4%
D.C. area N/A N/A N/A N/A N/A N/A N/A N/A N/A N/A 10% 10%
Elsewhere 86% 86% 89% 90% 89% 93% 92% 93% 94% 94% 86% 86%

Page 61 Appendix
1982 1988 1994 1997 2000 2003 2006 2009 2012 2015 2018 2021
Years since doctorate
<2 N/A N/A 8% 11% 2% 11% 8% 9% 9% 5% 7% 4%
2 to 4 N/A N/A 12% 13% 14% 19% 20% 16% 17% 18% 17% 18%
5 to 9 23% 24% 19% 18% 19% 25% 24% 22% 22% 20% 22% 26%
10 to 14 19% 22% 18% 14% 15% 13% 16% 18% 15% 16% 14% 14%
15 to 19 14% 18% 14% 14% 13% 10% 10% 10% 14% 11% 12% 12%
20 to 24 N/A N/A 14% 12% 14% 8% 7% 9% 7% 12% 11% 9%
25+ N/A N/A 15% 19% 25% 14% 15% 16% 18% 18% 15% 16%
Years since master's
<2 N/A N/A N/A N/A N/A N/A N/A N/A N/A 7% 8% 7%
2 to 4 N/A N/A N/A N/A N/A N/A N/A N/A N/A 30% 35% 31%
5 to 9 N/A N/A N/A N/A N/A N/A N/A N/A N/A 30% 22% 33%
10 to 14 N/A N/A N/A N/A N/A N/A N/A N/A N/A 17% 15% 13%
15 to 19 N/A N/A N/A N/A N/A N/A N/A N/A N/A 7% 8% 8%
20 to 24 N/A N/A N/A N/A N/A N/A N/A N/A N/A 4% 5% 6%
25+ N/A N/A N/A N/A N/A N/A N/A N/A N/A 5% 6% 2%
Highest degree
Doctorate N/A N/A N/A 92% 88% 87% 87% 86% 83% 77% 77% 72%
Master's N/A N/A N/A 7% 12% 13% 13% 14% 17% 23% 22% 27%
Other N/A N/A N/A N/A N/A N/A N/A N/A N/A N/A 1% 1%

Page 62 Appendix
Table 38. Median Income by Report Year for Men and Women
Men Women
Women's Salary
as % of Men’s
Year Income n Income n
1982 $44,250 811 $36,000 150 81.4%
1988 $62,000 1,290 $50,000 342 80.6%
1994 $75,000 954 $58,500 394 78.0%
1997 $83,000 858 $65,000 428 78.3%
1999 $85,000 637 $70,000 341 82.4%
2000 $93,000 653 $77,000 357 82.8%
2002 $86,250 605 $72,000 428 83.5%
2003 $92,000 609 $76,000 444 82.6%
2005 $95,000 626 $78,000 436 82.1%
2006 $100,000 626 $85,000 449 85.0%
2008 $108,000 556 $90,000 451 83.3%
2009 $110,000 569 $92,000 480 83.6%
2011 $110,800 613 $94,000 475 84.8%
2012 $113,800 624 $100,000 490 87.9%
2014 $110,000 521 $97,008 513 88.2%
2015 $116,779 536 $104,750 522 89.7%
2018 $125,000 658 $108,575 712 86.9%
2021 $130,195 460 $121,900 540 94.0%

Page 63 About HumRRO
Index
List of Tables
Table 1. Base Salary by Years Since Doctorate Degree ................................................................................ 6
Table 2. Base Salary by Years Since Master’s Degree .................................................................................. 7
Table 3. Base Salary by Years Since Doctorate Degree for Practice and Academia ...................................... 7
Table 4. Base Salary by Years Since Master’s Degree for Practitioners ........................................................ 8
Table 5. Base Salary by Type of Certification ................................................................................................ 9
Table 6. Base Salary by Employment Sector for Doctorate-level I-Os .......................................................... 12
Table 7. Base Salary by Employment Sector for Master’s-level I-Os ............................................................ 12
Table 8. Practitioner Base Salary by Job Title for Doctorate Degree Holders ............................................... 14
Table 9. Practitioner Base Salary by Job Title for Master’s Degree Holders ................................................. 15
Table 10. Doctorate-Level Base Salary by Institution Type .......................................................................... 16
Table 11. Doctorate-Level Base Salary by Academic Department ............................................................... 17
Table 12. Doctorate-Level Base Salary by Metro Area ................................................................................ 20
Table 13. Master’s-Level Base Salary by Metro Area .................................................................................. 20
Table 14. Bonuses for Doctorate and Master’s Degree Holders in 2021 ...................................................... 21
Table 15. Types of Bonuses Received by Doctorate and Master’s Degree Holders in 2021 ......................... 22
Table 16. Amount of bonus by type of bonus in 2021 .................................................................................. 22
Table 17. Doctorate-Level Raises as Percent of Salary ............................................................................... 23
Table 18. Master’s-Level Raises as Percent of Salary ................................................................................. 24
Table 19. Academic Supplemental Income by Source ................................................................................. 35
Table 20. Practitioner Supplemental Income by Source ............................................................................... 35
Table 21. Impact of COVID-19 on Income by Gender .................................................................................. 41
Table 22. Impact of COVID-19 on Income by Race/Ethnicity ....................................................................... 41
Table 23. Other Income Changes Due to COVID-19 by Job Sector ............................................................. 43
Table 24. Other Income Changes Due to COVID-19 by Gender .................................................................. 44
Table 25. Other Income Changes Due to COVID-19 by Race/Ethnicity ....................................................... 44
Table 26. COVID-19-related Benefits by Job Sector .................................................................................... 45
Table 27. Caregiving Responsibilities for Those Who Reported Being a Caregiver ...................................... 47
Table 28. Base Salary for Caregivers and Non-Caregivers .......................................................................... 48
Table 29. Caregiving Responsibilities Impact on Salary ............................................................................... 49
Table 30. Base Salary for Those With and Without a Disability .................................................................... 51
Table 31. Doctorate-level Median Income by Gender and Years Since Earning Degree .............................. 53
Table 32. Doctorate-level Median Income by Gender for Practitioners ......................................................... 53
Table 33. Doctorate-level Median Income by Gender for Academics ........................................................... 54
Table 34. Master’s-level Median Income by Gender and Years Since Earning Degree ................................ 54
Table 35. Base Salary by Degree Level and Race ....................................................................................... 55
Table 36. Median Income by Survey Year for Doctorate and Master’s Degree Holders ............................... 57
Table 37. Sample Characteristics Across Prior Survey Administrations ....................................................... 60
Table 38. Median Income by Report Year for Men and Women ................................................................... 62

Page 64 About HumRRO
List of Figures
Figure 1. Median Income Over Time by Degree Level ................................................................................... 5
Figure 2. Percent Difference Between Doctorate-level and Master's-level Median Salaries Over
Time ............................................................................................................................................... 5
Figure 3. Median Income by Years Since Degree .......................................................................................... 8
Figure 4. Median Salary by Certification Type by Degree Level ................................................................... 10
Figure 5. Doctorate-Level I-Os in Each Employment Sector ........................................................................ 11
Figure 6. Master's-Level I-Os in Each Employment Sector .......................................................................... 12
Figure 7. Doctorate - Median Base Salary by Industry ................................................................................. 13
Figure 8. Master's - Median Base Salary by Industry ................................................................................... 13
Figure 9. Median Salary by Degree-granting Level by Institution Type ......................................................... 16
Figure 10. Doctorate-Level Median Base Salary by Professor Type and Department .................................. 18
Figure 11. Retirement Benefits by Job Sector .............................................................................................. 26
Figure 12. Leave Benefits by Job Sector ..................................................................................................... 27
Figure 13. Health Insurance Benefits by Job Sector .................................................................................... 28
Figure 14. Disability Benefits by Job Sector ................................................................................................. 30
Figure 15. Professional Development and Education Benefits by Job Sector ............................................... 31
Figure 16. Stock Options, Profit Sharing, and Bonus Pay by Job Sector ...................................................... 33
Figure 17. Other Benefits by Job Sector ...................................................................................................... 34
Figure 18. Work Arrangements in 2020 and 2021 ........................................................................................ 36
Figure 19. Practitioner Work Arrangements in 2020 and 2021 ..................................................................... 37
Figure 20. Academic Work Arrangements in 2020 and 2021 ....................................................................... 37
Figure 21. Remote Work Location During COVID-19 Impact on Pay ........................................................... 38
Figure 22. COVID-19 Impact on Income in 2020 by Job Sector ................................................................... 39
Figure 23. COVID-19 Impact on Income in 2021 by Job Sector ................................................................... 39
Figure 24. COVID-19 Impact on Income in 2020 for Practice and Academia ............................................... 40
Figure 25. COVID-19 Impact on Income in 2021 for Practice and Academia ............................................... 40
Figure 26. Other Income Changes Due to COVID-19 .................................................................................. 42
Figure 27. Median Base Salary by Age Group ............................................................................................. 50
Figure 28. Gender Wage Gap Over Report Years ....................................................................................... 51
Figure 29. Women's Income as a Percent of Men's Income Over Time ....................................................... 52
Figure 30. Doctorate-level Median Income by Race/Ethnicity ...................................................................... 55
Figure 31. Doctorate Median Income by Gender and Race ......................................................................... 56
Figure 32. Doctorate Median Income for Women by Racial Category as a Percent of White
Women's Income ........................................................................................................................ 56
Figure 33. Degree Type by Age Group ........................................................................................................ 58
Page 65 About HumRRO
ABOUT SIOP
The Society for Industrial and Organizational
Psychology (SIOP) is an international
professional association with an annual
membership of nearly 10,000 industrial-
organizational (I-O) psychology practitioners,
educators, and students who study and apply
scientific principles to work. SIOP’s mission is to
enhance human well-being and performance in
organizational and work settings by promoting the
science, practice, and teaching of I-O psychology.
ABOUT HUMRRO
Human Resources Research Organization
(HumRRO) is a nationally recognized, nonprofit
applied research and consulting organization,
established in 1951 and headquartered
in
Alexandria, Virginia, with offices in Louisville,
Kentucky; Minneapolis, Minnesota; and Monterey,
California. We provide our clients with customized
solutions for complex business, HR, educational,
and organizational challenges. Our areas of
expertise include human capital management, hiring
and promotion, education research and evaluation,
credentialing, measurement and analytics,
and leadership assessment.

Page 66 About HumRRO
ACKNOWLEDGEMENTS
Thank you to all of the volunteer SIOP Institutional Research Committee (IRC) members whose
efforts were instrumental in the 2021 SIOP Salary Survey design, administration, analyses, and
report development, including the 2020-2022 SIOP Salary Subcommittee members Kristen Cecil,
Ariana Cunningham, Nhung Hendy, Kristin Horan, Anna L. Hulett (Chair), Laura McAliley, Erin
Richard, Rachel Skope, and Rachel Williamson Smith; IRC Co-Chairs Kristl Davison & Sertrice
Grice, IRC Chair-in-Training Cheryl Fernandez, and the Survey Oversight Subcommittee.
Thank you to the SIOP Administrative Staff, as well as our partners at Mercer|Sirota and HumRRO.
© 2022 Society for Industrial and Organizational Psychology, Inc. All Rights Reserved.

