
© 2013 International Monetary Fund
IMF Country Report No. 13/348
ITALY
TECHNICAL NOTE ON THE FINANCIAL SITUATION OF
ITALIAN HOUSEHOLDS AND NON-FINANCIAL
CORPORATIONS AND RISKS TO THE BANKING SYSTEM
This Technical Note on the Financial Situation of Italian Households and Non-Financial
Corporations and Risks to the Banking System on Italy was prepared by a staff team of the
International Monetary Fund as background documentation for the periodic consultation with
the member country. It is based on the information available at the time it was completed in
August 2013. The views expressed in this document are those of the staff team and do not
necessarily reflect the views of the government of Italy or the Executive Board of the IMF.
The publication policy for staff reports and other documents allows for the deletion of market-
sensitive information.
Copies of this report are available to the public from
International Monetary Fund Publication Services
PO Box 92780 Washington, D.C. 20090
Telephone: (202) 623-7430 Fax: (202) 623-7201
E-mail: [email protected]
Web: http://www.imf.org
Price: $18.00 per printed copy
2013 International Monetary Fund
Washington, D.C.
December, 2013

ITALY
FINANCIAL SECTOR ASSESSMENT PROGRAM
TECHNICAL NOTE
THE FINANCIAL SITUATION OF ITALIAN HOUSEHOLDS
AND NON-FINANCIAL CORPORATIONS AND RISKS TO THE
BANKING SYSTEM
Prepared By
Monetary and Capital Markets
Department
This Technical Note was prepared by IMF staff in the
context of the Financial Sector Assessment Program
in Country. It contains technical analysis and detailed
information underpinning the FSAP’s findings and
recommendations. Further information on the FSAP
can be found at:
http://www.imf.org/external/np/fsap/fssa.aspx.
August 2013

ITALY
2 INTERNATIONAL MONETARY FUND
CONTENTS
INTRODUCTION AND MAIN FINDINGS ________________________________________________________ 4
THE ITALIAN HOUSEHOLD SECTOR ____________________________________________________________ 5
A. Household Balance Sheets _____________________________________________________________________ 5
B. The Housing Market ___________________________________________________________________________ 9
C. Financial Linkages _____________________________________________________________________________ 11
D. Sensitivity Analysis ____________________________________________________________________________ 16
THE ITALIAN NON-FINANCIAL SECTOR_______________________________________________________ 22
A. Non-Financial Corporate Balance Sheets _____________________________________________________ 22
B. Financial Linkages _____________________________________________________________________________ 24
C. Insolvency and Debt Restructuring ____________________________________________________________ 29
D. Sensitivity Analysis ____________________________________________________________________________ 32
E. Contingent Claims Analysis ___________________________________________________________________ 36
CONCLUDING REMARKS _______________________________________________________________________ 39
REFERENCES ____________________________________________________________________________________ 40
TABLES
1. Household Debt Burden (2010)_________________________________________________________________ 17
2. Sensitivity Analysis of Indebted Households____________________________________________________ 20
3. Firms’ Ratio of Interest Expense to Gross Operating Income___________________________________ 33
4. Ratio of Interest Expense to Gross Operating Profits by Firm Size (2011)______________________ 34
5. Ratio of Interest Expense to Gross Operating Profits by Firm Size (2011)______________________ 35
FIGURES
1. Household Debt and Wealth_____________________________________________________________________ 8
2. The Housing Market____________________________________________________________________________ 10
3. Households’ Financial Conditions_______________________________________________________________ 14
4. Italian Household: Baseline Debt Vulnerability__________________________________________________18
5. Italian Household: Sensitivity Analysis__________________________________________________________ 21
6. Corporate Leverage, Funding Sources, and Profitability________________________________________ 25
7. Firms’ Financial Conditions______________________________________________________________________28
8. The Financial Situation of Italian Firms__________________________________________________________ 34
9. Sensitivity Analysis for Italian Firms_____________________________________________________________ 36
10. Contingent Claim Analysis for the Corporate Sector__________________________________________ 38
BOXES
1. Support Measures for Low-Income and Distressed Households________________________________15

ITALY
INTERNATIONAL MONETARY FUND 3
2. Measures to Support SME Financing___________________________________________________________ 27
3. The Legal Debt Restructuring Framework for Firms_____________________________________________31

ITALY
4 INTERNATIONAL MONETARY FUND
INTRODUCTION AND MAIN FINDINGS
1
1. This paper analyzes the vulnerabilities of the balance sheets of the Italian household
and corporate sector in order to assess the risk to the banking system. It takes a different
approach than the solvency and liquidity stress tests by assessing the financial soundness of the
main borrowers of the Italian banking system—households and the non-financial corporate sector—
and quantifying the potential impact from macroeconomic shocks. It relies on various sources of
information, including aggregate statistics and more granular information from household surveys
and corporate balance sheet databases.
2. The credit risk from Italian households is mitigated by their considerable net wealth.
Income has declined during the crisis, leading to tighter financial conditions for households,
especially for young and low-income groups, but low indebtedness, high levels of assets and
declining interest rates have protected households from wide-spread debt payment difficulties.
Sensitivity analysis show that further deterioration in economic conditions, through a fall in income
and higher interest rates, would reduce households’ debt repayment capacity, but their net wealth
position would continue to provide a considerable buffer, thereby dampening the potential risk
from the household sector to the banking system.
3. Real estate is the predominant source of collateral for loans, and severe strains in the
housing market could increase bank losses. The sharp drop in housing market activity reflects the
economic downturn, which has in turn put downward pressure on prices. Though housing prices are
not estimated to be substantially misaligned, continued weak activity is likely to put further
downward pressure on prices in the next few years. Sensitivity analysis shows that a moderate
decline in housing prices could be absorbed, partly due to the prudent loan-to-value ratios applied
to loans, but a more extreme shock, though not anticipated, would likely trigger credit losses for
banks and eat into provisioning coverage.
4. The financial situation of non-financial corporations, in particular SMEs, is fragile, as
evidenced by already high loan default rates. Even if the indebtedness of Italian firms is
moderate, leverage is high and has increased. About one-third of Italian firms, holding 45 percent of
the debt, are estimated to have interest payment coverage at vulnerable levels. SMEs have higher
than average leverage and lower interest payment coverage. Downside shocks to profits and interest
1
Prepared by Bergljot Bjørnson Barkbu. The note incorporates the following important contributions: Paolo Finaldi
Russo and Antonio de Socio (Bank of Italy) provided the sensitivity analysis for Italian firms, Dawn Chew (Legal
Department) drafted Box 3 on corporate bankruptcy law and parts of section III.C, and David Velazquez Romero
(European Department) carried out the Contingent Claims Analysis. I would also like to thank Marcello Bofondi, Laura
Bartiloro, Silvia Magri, Raffaella Pico and Francesco Zollino at the Bank of Italy for excellent input and suggestions,
and Zhengpeng Guo, Chen Kan, Piyaporn Nikki Sodsriwiboon, Amadou Sy, and Kenichi Ueda for very helpful
comments and advice.

ITALY
INTERNATIONAL MONETARY FUND 5
rates would increase credit risk stemming from the corporate sector though the additional strains
would likely be contained.
5. Continued strong policy action will be important to mitigate the impact of these
vulnerabilities, especially for firms. The government’s new initiative to pay part of its overdue
debt represents a crucial step to ease firms’ liquidity constraints. Continued efforts to increase
provisions−including by reducing fiscal disincentives and speed up the judicial process, strengthen
prudential considerations in collateral valuation and disclosure, and strengthened capital plans,
where needed, will be crucial to bolster confidence in banks, given the increase in non-performing
loans on their balance sheets. Also, further development of the private market for distressed assets
would help accelerate the disposal of non-performing loans and promote corporate restructuring.
Finally, with SMEs relying heavily on bank financing and suffering from tight credit conditions,
measures to expand SME financing, through more risk-based bank lending and opening up non-
bank financing channels, will be crucial to support their financial situation and the economic
recovery.
THE ITALIAN HOUSEHOLD SECTOR
A. Household Balance Sheets
6. Italian households’ debt level is low in an international perspective. Debt ratios more
than doubled during the low-interest period following the launch of the euro area; and have gone
from 33 percent of gross disposable income in 1998 to 74 percent December 2012 (Figure 1).
2
However, they remain well below those in other large economies such as France, Germany and the
United Kingdom, as well as the euro area average of 109 percent. Mortgages have been the key
source of the increase in household debt to banks (from a share of 50 percent of total bank loans
in 2003 to 60 percent in 2012), though reliance on mortgage financing continues to be low
compared to other countries.
7. The small degree of aggregate
indebtedness reflects a modest share of
indebted households. About 25 percent of
households had debt outstanding, compared
with 40 to 50 percent in other major euro area
countries, and more than 60 percent in the
United States and the United Kingdom. The
highest proportion of indebted households is
among those with higher income, with
41 percent of those in the highest quintile
having outstanding debt (see Bank of
2
Households include households and non-profit institutions servicing households.
0
10
20
30
40
50
60
0
10
20
30
40
50
60
Spain
Germany
France
Euro area
Italy
Proportion of Households with Debt
In percent
Source: ECB (2013).

ITALY
6 INTERNATIONAL MONETARY FUND
Italy, 2012a). Among lower-income households (lowest quintile), only 17 percent have debt
outstanding. The median debt-to-income ratio for Italian indebted households is about 50 percent,
10 percentage points below the euro area average. Among indebted household, the average debt-
to-income ratio was 112 percent in 2010, though it is much higher for the lower-income households.
Also, given the high frequency of low values and progressively declining frequency for higher values,
the median debt-to-income ratio is much lower, at 46 percent. Debt-service, however, remains
moderate, at an average of 13 percent of income for indebted households in 2010, in line with the
euro area average.
8. The ratio of debt to disposable income has continued to increase during the crisis,
mainly due to stagnating income. The pace of growth of household debt slowed during the crisis,
reflecting tight credit conditions and low demand. Due to modest wage growth and high
unemployment, household disposable income has declined somewhat during 2008–12, and has
fallen by 13 percent in real terms (Figure 1). As a result, households’ debt-to-income burden has
continued to increase and the household savings rate dropped from 13 to 8 percent over the same
period as many lower-income households became unable to save (see Bartiloro and
Rampazzi, 2012).
9. Italian households have considerable wealth, as well as a buffer of liquid assets.
In 2010, Italian households’ net wealth and their ratio of liquid assets to income were above the
euro area average, while the debt-to-asset ratio was below. Net wealth represented about 8 times
disposable income, somewhat lower than in the U.K. (8¼), but higher than in France (7¾) and Japan
(5½). In the three years 2008–10, total net wealth increased by 1¾ percent; the growth was the
result of the flow of saving, which, though declining, more than offset the effects of the losses
caused by the fall in the value of financial assets.
10. Real assets, mostly housing, represent an important share of Italian households’
wealth. Home ownership in Italy is high, with 68 percent of households owning their house in 2010,
which is high compared to the euro area average (60 percent), Germany (44 percent) and France
(58 percent), though below Spain (83 percent). Real assets make up about two thirds of household
0
5
10
15
20
25
30
0
50
100
150
200
250
Spain
Italy
France
Euro area
Germany
Net Wealth and Debt-to-Assets
Median Net wealth (euros)
Debt-to-assets (in percent, rhs) 1/
Source: ECB (2013).
1/ For indebted households.
0
5
10
15
20
25
0
5
10
15
20
25
Germany
Italy
Euro area
France
Spain
Net Liquid Assets to Income
In percent
Source: ECB (2013).

ITALY
INTERNATIONAL MONETARY FUND 7
assets, and given relatively stable housing prices to date, have protected households from
fluctuations in asset prices during the financial crisis (see Bank of Italy, 2012b).
11. Financial wealth is concentrated in less risky assets such as deposits and bonds. The
value of Italian households’ financial assets as a ratio to disposable income (3½) has remained
broadly unchanged during the crisis. Some 92 percent of Italians hold financial assets, somewhat
below the euro area average (97 percent). The proportion of Italian households holding riskier assets
such as mutual funds (6 percent) and shares (5 percent) are about half that of the euro area average
(11 and 10 percent, respectively). Italian households’ financial portfolios contain a high proportion of
relatively low-risk assets, partly reflecting an ageing population, such as public and private bonds
(15 percent, compared to a 5 percent euro area average), and insurance and pension reserves. Over
the past decades, mostly due to a decline in asset prices, the value of investment in risky assets has
declined. Consequently, the share in financial assets of mutual funds and shares has been reduced
from 47 percent in 2000 to 25 percent in 2012. Ownership of the riskier assets is concentrated in
high-income households, with holders of mutual funds and shares predominantly belonging to the
two highest quintiles of the income distribution.
12. Low-income and young households have a small and declining share of the wealth,
making them more vulnerable to an economic downturn. Low-income and young households
have been more strongly hit by the decline in income and tight financial conditions during the crisis.
The richest 10 percent of households owned 46 percent of net wealth in 2010, up from 44 percent
in 2008. The net wealth of low-income households is 7 percent, which is low in a historical
perspective, and young households (with a head younger than 35 years) also hold a historically low
share of net wealth, at 5 percent.

ITALY
8 INTERNATIONAL MONETARY FUND
Figure 1. Italy: Household Debt and Wealth
Household debt in Italy is low in an international
perspective
Mortgage financing has expanded, but remains below
levels in other advanced countries
Debt is less frequent among lower-income households,
though their average debt burden is more elevated
The economic downturn has reduced real disposable
income and savings
High real assets have contributed to a comfortable and
stable net wealth position
The share of riskier assets in financial assets has been
reduced, mostly reflecting declining asset values
0
20
40
60
80
100
120
140
160
180
200
0
20
40
60
80
100
120
140
160
180
200
1998
2000
2002
2004
2006
2008
2010
2012
Italy
Spain
France
Germany
Euro area
UK
Source: Eurostat, ISTAT and other national statistics agencies.
1/ Household includes households and non-profit institutions serving households
Household Debt to Gross Disposable Income, 1998-2012 1/
(In percent)
0
20
40
60
80
100
120
140
0
20
40
60
80
100
120
140
Italy
France
Germany
Euro area
Spain
UK
Household Debt to Banks to Gross Disposable Income,
2003, 2007 and 2012
(In percent)
Other
Mortgage
Consumer credit
Source: ECB, Eurostat.
0
10
20
30
40
50
60
0
50
100
150
200
250
300
1st
2nd
3rd
4th
5th
Total
Debt-to-Income Ratio and Indebted Households
(In percent, 2010)
Debt-to-income (mean)
Debt-to-income (median)
Households with debt (rhs)
Source: Bank of Italy. Quintiles
5
10
15
80
90
100
1999
2001
2003
2005
2007
2009
2011
2013
Household Disposable Income and Savings Rate
(In percent and index 2007=100)
Real disposable income
Savings rate (rhs)
Source: ISTAT.
-400
-200
0
200
400
600
800
1000
-400
-200
0
200
400
600
800
1000
1998
2008
2011
Household Net Wealth
(in percent of disposable income)
Liabilities
Financial assets
Real assets
Net wealth
Source: Bank of Italy.
0
20
40
60
80
100
0
20
40
60
80
100
2000
2007
2012
Household Financial Assets
(In percent of total)
Shares and mutual funds
Bonds
Reserves
Deposits
Source: Bank of Italy.

ITALY
INTERNATIONAL MONETARY FUND 9
B. The Housing Market
13. House price inflation in Italy has been in line with the euro area average. Over the last
decade, Italian housing prices increased on average by 4½ percent a year, about 2 percentage
points above HICP inflation, consistent with euro area trends (Figure 2). Indices of affordability show
that Italian house prices are somewhat above their long-term average, calculated as the average
since 1980, though less so than in countries where housing prices appear substantially overvalued.
The price-to-rent ratio was 2 percent above its historical average in 2012, while the price-to-income
ratio was 15 percent above. However, a study by the Bank of Italy—based on an econometric
analysis to determine a simultaneous equilibrium on the property market, the mortgage market and
the construction loan market—suggests that housing price developments have been in line with
fundamentals over the 25 years estimation period.
3
The current discrepancy between actual and
equilibrium housing prices is estimated to be less than one percentage point.
14. The weak economy and credit tightening have nevertheless translated into sharp
declines in housing market activity over the past year. High unemployment and declining real
incomes coupled with tightened bank lending standards have led to sharp falls in construction
investment and depressed house sales to half the peak level recorded in 2006. Housing transactions
started falling sharply in early 2012. Transactions declined by an annual rate of 30 percent in 2012
Q4, (Figure 2), though recovered to -14 percent in 2013 Q1, and the annual growth rate of
household mortgages turned negative in the beginning of 2013. The average time to sale has
reached more than 8 months. The majority of responding real estate agents in the April 2013
Housing Market Survey (Bank of Italy, 2013a) believes that the real estate tax put into effect in 2012
have contributed to weak activity and price declines.
15. Weak housing market activity and confidence have in turn exerted downward pressure
on prices. The Housing Market Survey shows that the number of transactions is being depressed by
a large price gap between sellers and buyers. The discount-to-ask price for sold houses reached
16 percent in 2013 Q1 (Figure 2). The official house price indices from ISTAT and the Bank of Italy
show that housing prices have fallen by almost 7 percent since their peak in 2011. The price fall is
larger for existing houses than new houses, for which prices just started falling in 2012 Q3. Price
indices from private sources show a larger price decrease, but have less comprehensive coverage
and do not capture the quality adjustment embedded in the official price index. In the next few
years, continued weak activity and tight lending conditions are likely to put further downward
pressure on prices. In this vein, most real estate agents surveyed by the Bank of Italy expect prices to
continue to fall in the next two years.
3
See Nobili and Zollino (2012).

ITALY
10 INTERNATIONAL MONETARY FUND
Figure 2. Italy: The Housing Market
House prices in Italy have increased broadly in line with
the euro area average
House prices relative to income are somewhat above long-
term averages, but less so than in some countries
Transactions have fallen by almost 50 percent since their
peak in 2006, but the price adjustment has been limited
The discrepancy of official price indices with private
sources reflects quality adjustment and a larger sample
Real estate agents expect prices to continue to decline in
the short term
A large price gap between sellers’ and buyers’ prices is one
of the reasons for an increasing average time to sale
80
100
120
140
160
180
200
220
240
260
80
100
120
140
160
180
200
220
240
260
2000
2002
2004
2006
2008
2010
2012
Housing Prices
(Index, 2000=100)
Italy
France
Germany
Spain
Euro area
UK
Source: ECB, Halifax and Nationwide Building Society.
70
80
90
100
110
120
130
140
150
160
170
70
80
90
100
110
120
130
140
150
160
170
1997
1999
2001
2003
2005
2007
2009
2011
House Price-to-Income Ratios
(Index, long-term average = 100)
United States
Italy
United Kingdom
Ireland
Spain
Germany
France
Source: OECD.
60
80
100
120
140
60
80
100
120
140
2000
2002
2004
2006
2008
2010
2012
Italy: House Transactions and Real House Price
(Index, 2000=100)
Transactions
Real price
Source: Agenzia del Territorio, Bank of Italy, and ISTAT.
100
150
200
250
300
100
150
200
250
300
1990
1993
1996
1999
2002
2005
2008
2011
House Price Indices
(Index, 1990=100)
Bank of Italy
Nomisma
Source: Bank of Italy/ISTAT and Nomisma.
-80
-70
-60
-50
-40
-30
-20
-10
0
10
2008
2009
2010
2011
2012
Expected Housing Prices Change 1/
Source: Bank of Italy.
1/ Balance of real estate agents' opinion indicating increase or
decrease in prices in the current quarter.
6
7
8
9
8
10
12
14
16
18
2008
2009
2010
2011
2012
Price Discount and Sale Time
Time to sale (rhs, months)
Discount-to-ask price (percent)
Source: Bank of Italy.

ITALY
INTERNATIONAL MONETARY FUND 11
C. Financial Linkages
16. Bank credit to households has tightened since the onset of the crisis. Prior to the crisis,
during 2005–07, household debt granted by banks grew at an annual pace of more than 10 percent.
The growth slowed rapidly to 3 percent during 2008–09 and turned negative in late 2012, reaching
-1 percent in May 2013. The deceleration in 2012 affected all categories of loans, though mortgages
were particularly impacted, as new mortgages granted in 2012 roughly halved compared to 2011.
4
New consumer loans fell somewhat less, by 14 percent. The Bank Lending Survey (Bank of
Italy, 2013b) shows that both tighter credit standards by banks and lower loan demand by
households have contributed to the decline in credit. Currently, lower loan demand appears to be
the predominant factor, with households being affected by weak consumer confidence, lower
consumption and negative housing market prospects. Banks’ tight credit standards are explained by
negative prospects of the economy and the housing market for mortgages, and increasing concerns
about the credit worthiness of households for consumer credit.
17. Households’ relatively strong balance sheets have mitigated the impact of the crisis on
banks’ asset quality.
5
The stock of bad debt was 6 percent of total household debt in June 2013, of
which about 65 percent is secured with real assets (Figure 3). Default rates, given by the ratio of new
bad loans to total performing loans at the beginning of the period, have been stable at 1¼ percent
over 2010–13, relative to about ¾ percent in the pre-crisis years. But more leading indicators such
as past due and doubtful loans have recently seen increases, pointing to a possible further
deterioration in household credit quality. Past due household loans increased to 1.2 percent in June
2013, compared to 0.9 percent in December 2011, and doubtful household loans increased to
2.6 percent from 2.1 percent over the same period.
6
For both past due and doubtful loans, the
increases have been mainly for consumer credit and other loans (comprising overdrafts and
mortgages other than those used to purchase primary residences).
18. Loan-to-value (LTV) ratios for mortgages are prudent, and have decreased for new
mortgages. The low LTV ratios are, in part, a result of strict housing credit regulations and prudent
bank practices. According to the Housing Market Survey, LTV ratios on new mortgages have declined
from 69 percent at end-2008 to 56 percent in early 2013 (Figure 3). The average length of new
mortgage loans has remained broadly constant at 22 years over this period. For outstanding
mortgages, about two thirds had LTV ratios of between 50 to 80 percent, and only 8 percent had
LTV ratios above 80 percent in September 2012. The LTV ratios for first-time home buyers in Italy are
at the lower range of those in euro area countries. The Bank of Italy estimates that the share of
mortgages in negative equity is near zero.
4
The reduction in new mortgages is partly due to a drop in mortgage substitution and subrogation, as interest rates
on new mortgages became less favorable.
5
The loan classification rules and supervisory practices are more conservative in Italy than elsewhere in Europe,
making comparison of NPL figures across countries potentially misleading.
6
The increase in past due loans is partly explained by the expiration of exceptions that allowed banks to wait to
classify loans as past due until they had been in arrears for 180 days. Now that the exceptions have expired, loans
that have been in arrears for 90 days are classified as past due.

ITALY
12 INTERNATIONAL MONETARY FUND
19. Default rates on mortgages are low, more so for younger vintages. Stricter selection
criteria and lower LTV ratios for mortgage loans have translated into a pronounced decline in
default rates on mortgage loans concluded during 2009–11, compared to those granted in the three
previous years.
20. A low share of mortgages and variable interest rates limit further the balance sheet
risk for banks. Outstanding mortgage lending amounted to EUR 365 billion at end-December 2012,
accounting for some 15 percent of total bank credit. Most mortgages––about 70 percent––have
variable rates typically linked to the three-month Euribor, though of these, 10 percent have a cap on
the interest rate. The reduction in Euribor rates following the 2008 financial crisis reduced the debt
burden of indebted households. However, as part of the tightened credit conditions, lenders have
increased the spread over Euribor on new mortgages, to about 3½ percentage points, against an
average of 1 percent in the pre-crisis years.
21. Mortgage substitution and subrogation are commonly used to enhance the financing
terms. A 2007 reform liberalized the mortgage market, including through the elimination of pre-
payment penalties, effectively increasing the mobility of mortgage customers. Mortgage
substitution, where a borrower renegotiates the contract (with the same bank or a new bank) to
obtain better financing conditions, possibly also amending the amount of the loan, or mortgage
subrogation, where borrower ends the contract and start a new contract (with the same or another
bank) to obtain better financing conditions, have been common in past years when interest rates
were low and falling. However, with worsening financing terms on new mortgages in 2011–12,
mortgage substitutions and subrogations are now less attractive. Mortgage substitutions and
subrogations amounted to about 12 percent of new mortgages in 2011, down from 20 percent
in 2009 and 16 percent in 2010, and are expected to have decreased further in 2012. Renegotiations
with the same banks were done for 7½ percent of mortgages in 2008, 3 percent in 2009 and
1–2 percent in 2010–11. The number of debt restructurings, where the bank incurs a loss, is very
limited (less than 0.1 percent of loans in December 2012).
22. Banks and the government have adopted measures to protect low-income and
distressed borrowers during the crisis. Under the initiative of the Italian Banking Association and
the main consumer organizations, a moratorium on mortgages was implemented in February 2010,
with wide participation from banks (Box 1). The moratorium expired in March 2013, and has enabled
50
60
70
80
90
100
50
60
70
80
90
100
Typical Loan-to-Value for a First-Time
Home Buyer
2007
2011
Source: Bank of Italy.
0.0
0.5
1.0
1.5
2.0
0.0
0.5
1.0
1.5
2.0
Yr disb.
+1 yr
+2 yrs
+3 yrs
+4 yrs
+5 yrs
+6 yrs
+7 yrs
+8 yrs
2004
2005
2006
2007
2008
2009
2010
2011
New Mortgage Loans in Default,
by Year of Disbursement
(in percent of number of contracts)
Source: Bank of Italy.

ITALY
INTERNATIONAL MONETARY FUND 13
around 100,000 homeowners to suspend repayments. Since banks do not incur a loss, mortgage
under the moratorium are not classified as “restructured” and are not considered part of impaired
loans. About 70 percent of those benefiting from the moratorium have resumed regular payments
at the end of the suspension, suggesting that the measure has improved the creditworthiness of the
participating households (see Bartiloro, Carpinelli, Finaldi Russo and Pastorelli, 2012, and Bank of
Italy, 2012c). The government’s Solidarity Fund (Box 1) is targeted at low-income households and
contributes to interest payments on mortgage loans for first-time home buyers during payment
suspensions. The capital endowment of EUR 20 million for 2011 was quickly exhausted, and
contributed to the interest payments of 5,000 households. A further EUR 20 million have been
allocated for 2012–2013.
23. Mortgage loans are full recourse under Italian law, offering considerable protection to
creditors. As in other countries in continental Europe, borrowers in Italy must repay their debt in
full, regardless of any change in the value of the property, and a creditor can in some cases attach
other (present and future) assets of the debtor.
24. The recent law on personal bankruptcy provides support for households that are
unable to pay their debt. Under the new law, over-indebted households can chose between two
new insolvency procedures; restructuring and liquidation. The restructuring is done with the
intervention of an ad-hoc body, and if feasible, approved by a judge. The debtor can propose an
agreement that can, among other, postpone payment deadlines or discount the total debt.
However, if the procedure encompasses secured debts, creditors should be repaid no less than the
collateral market value. The liquidation process is managed by an agent appointed by a judge, and
once started, prohibits new legal action against the debtor. If the liquidation of all the debtor’s
assets is closed but the debt is not yet fully paid off, the debtor can ask the court for a discharge,
which can be granted if strict conditions are satisfied.
7
25. The lengthy process to recover collateral affect banks’ expected recovery values. The
legal process to repossess collateral can be initiated after single or multiple delays in the payment of
installments. The average length of the legal procedures leading to repossession was about three
years in 2011, having improved from six years in 2001. The lender can, in addition, activate a
foreclosure procedure on other assets of the debtor, consistent with the full recourse legislation.
7
The debtor needs to prove good faith, i.e., the debtor needs to be cooperative, not having been sentenced for
bankruptcy crimes and not responsible for the default, and not having been granted a discharge of debt in the
previous eight years.

ITALY
14 INTERNATIONAL MONETARY FUND
Figure 3. Italy: Households’ Financial Conditions
Credit growth has turned negative, and interest rates on
new loans remain high
Bank credit standards have tightened and demand for
credit has declined substantially.
The flow of new bad household loans is stable at a low
level
The stock of bad debt reflects a large amount of legacy
assets
The stocks of past due and substandard household loans
are on the rise
Loan-to-value ratios are low, but have come down, further
as has the use of mortgages for house purchases
0
1
2
3
4
5
6
0
1
2
3
4
5
6
1997
1999
2001
2003
2005
2007
2009
2011
2013
Ratio of New Bad Debt to Outstanding
Household Loans
(In percent, annualized)
Source: Bank of Italy.
50
60
70
80
50
60
70
80
2008
2009
2010
2011
2012
Household Mortgage Financing
(In percent)
Loan-to-value ratio
House purchases with mortgage
Source: Bank of Italy.
-100
-80
-60
-40
-20
0
20
40
60
80
100
-100
-80
-60
-40
-20
0
20
40
60
80
100
2008
2009
2010
2011
2012
2013
Bank Lending Standards and Demand
(Net percentages) 1/
House purchase (credit standards)
House purchase (demand)
Consumer credit (credit standards)
Consumer credit (demand)
Source: Bank Lending Survey, Bank of Italy.
1/ Difference betweeen the sum of the percentages for tightened and eased for
credit standards and increased and decreased for loan demand.
0
2
4
6
8
10
12
0
2
4
6
8
10
12
1998
2000
2002
2004
2006
2008
2010
2012
Households' Bad Debt
In percent of outstanding loans
Source: Bank of Italy.
0
1
2
3
4
5
0
1
2
3
4
5
2008
2009
2010
2011
2012
2013
Impaired Household Loans, Excluding Bad Debts
In percent of total loans
Past due
Restructured
Substandard
Source: Bankof Italy.
June
2013
0
2
4
6
8
10
-5
0
5
10
15
20
Jan-07
Dec-07
Nov-08
Oct-09
Sep-10
Aug-11
Jul-12
12- Month Credit Growth and Interest Rates 1/
(In percent)
Credit growth (lhs)
Interest rate, consumer credit
Interest rate, mortgage
Source: Bank of Italy and ECB.
1/ Corrected for securitization. Interest rates on new loans (rhs).

ITALY
INTERNATIONAL MONETARY FUND 15
Box 1. Italy—Support Measures for Low-Income and Distressed Households
Moratorium. The moratorium promoted by the Italian Banking Association together with the
main consumer organizations, has allowed households in difficulty to suspend mortgage loan
repayments for at least 12 months, under the following conditions:
Mortgage not higher than EUR 150,000 for the purchase or restructuring of the primary
residence.
Annual household income up to EUR 40,000.
Loss of main income source after January 1, 2009, because of job loss, job reduction (including
under the Wage Supplementation Fund) for at least 30 days, or death of household main income
earner.
The suspension of payment include principal or principal and interest payments, and the
amortization period of the mortgage is extended for the period of the suspension, during which
interest continues to be due.
The participation of banks has been wide (92 percent). Since February 2010, the moratorium has
enabled around 85,000 homeowners (approximately 30 percent of mortgage holders in the lowest
income quartile) to suspend repayments, amounting on average to EUR 7,130 (approximately one
quarter of the disposable income of mortgage holders in the lowest income quartile). The
moratorium expired in March 2013.
Solidarity Fund. The government’s Solidarity Fund is targeted at low-income households and
contributes to interest payments on mortgage loans for first-time home buyers during payment
suspensions. The selection criteria are stricter than for the moratorium; in particular, those
benefiting from the Wage Supplementation Fund do not qualify, and bank participation is
mandatory. The Fund’s capital endowment of EUR 20 million for 2011 was quickly exhausted, and
contributed to the interest payments of 5,000 households. A further EUR 20 million has been
allocated for 2012–13.
In addition, the government has put in place a credit fund for parents of newborn children, valid
until 2014. Between 2010 and 2011, this fund disbursed loans totaling EUR 116 million to 21,000
households (0.2 percent of total loans to households). Finally, a guarantee funds for purchase of a
primary residence by young couples has been set up, where the government covers 50 percent of
the residual amount due in case of insolvency. The latter fund has been used scarcely, and the
conditions, in particular the cap on the spread applied to variable rate mortgages are currently
under review.

ITALY
16 INTERNATIONAL MONETARY FUND
D. Sensitivity Analysis
26. This section analyzes the risk to financial stability from household indebtedness. The
analysis uses the dataset from the Bank of Italy’s Survey of Household Income and Wealth (2010),
which allows a detailed analysis of households’ indebtedness across income groups. The 2010
Survey covers 7,951 households in Italy. To assess vulnerabilities, the analysis considers the financial
situation of households in 2010 (the baseline) and the impact of a set of hypothetical
macroeconomic shocks illustrating the key risks to the household sector; a further fall in income, an
increase in interest rates, and a continued decline in housing prices.
8
Baseline
27. The debt burden of Italian households is modest. In 2010, only 22 percent of households
had mortgage or consumer credit, see Table 1 and Figure 1.
9
Indebtedness is larger in the more
wealthy percentiles of the income distribution. The median debt-service to income ratio for
indebted households is 10 percent. Considering the ratio of debt payment to income as an indicator
of vulnerability, a household is defined to be vulnerable if debt service exceeds 30 percent of
income—a conservative threshold. The proportion of vulnerable household in the total sample is
2¼ percent, which is low in an international perspective, and the proportion of vulnerable
households among indebted households is 10 percent.
28. The lowest income group represents the most vulnerable group among indebted
households. Their median debt payment to income ratio was 18 percent, against 10 percent for all
indebted households. As a result, the share of distressed households was 29 percent for this income
group, about the double of that of the second lowest income group.
29. Vulnerable households hold a considerable share of total household debt. In total,
vulnerable households hold 27 percent of total household debt, though with large variation across
income groups. In the lowest income group, almost 75 percent of the debt is held by vulnerable
households, whereas the proportion is about 12 percent in the highest income group.
30. A large part of the debt of vulnerable households (debt at risk) is covered by real and
financial assets. The positive net wealth position, defined as real and financial assets minus financial
debt, provides a buffer for most indebted households. Only 1.2 percent of total debt is held by
vulnerable households (e.g., with debt service above 30 percent of income) that do not have a
positive net wealth position. The proportion is somewhat higher for the lowest income group; at
3 percent. In line with this, the loan default rate for Italian households is relatively low.
8
The survey is bi-annual and the 2012 dataset will become available in early 2014. See Bank of Italy (2011) for a
sensitivity analysis based on an extrapolation of the dataset to 2012.
9
The definition of debt used here includes mortgages and consumer credit, but excludes credit cards, overdrafts, and
business loans. If debt on credit cards and overdrafts are included, 27 percent of households are indebted. Income
includes non-monetary income.

INTERNATIONAL MONETARY FUND 17
Table 1. Italy: Household Debt Burden (2010)
All households
Indebted households
Income
Proportion
of indebted
households
(in percent
of total)
Proportion
of distressed
households
(in percent
of total)
Ratio of
debt
payment to
income
(median)
Share of
distressed
households
(in percent)
Share of
debt at risk
(in percent)
Debt at risk not
covered by
household assets
(in percent of
loans)
<20
11.3
3.3
18.2
29.1
73.2
3.0
20-40
16.7
2.5
12.6
15.1
40.9
1.0
40-60
22.2
2.6
11.5
11.9
42.4
1.5
60-80
27.2
1.7
10.2
6.3
21.6
0
80-90
28.3
0.6
9.4
2.2
12.0
4.3
90-100
32.8
0.6
6.9
1.9
12.5
0
Total
21.6
2.2
10.1
10.0
26.5
1.2
Source: Staff estimates using the Bank of Italy’s 2010 Household Income and Wealth Survey.
ITALY

ITALY
18 INTERNATIONAL MONETARY FUND
Figure 4. Italian Household: Baseline Debt Vulnerability
The debt burden of Italian households is moderate and in
line with euro area averages
Indebtedness is higher for higher income groups, but
vulnerabilities are largest in the lower income groups
Debt service constitutes a larger share of income in the lower
income groups, making households more vulnerable
The debt of vulnerable households is mostly covered by
positive net wealth positions
Source: IMF staff estimates based on the Bank of Italy’s 2010 Household Income and Wealth Survey and ECB (2013) for
cross-country data on debt burden.
Sensitivity Test Scenarios
31. The sensitivity analysis considers the impact on the number of vulnerable households
and debt at risk of a set of hypothetical macroeconomic shocks. It takes the 2010 balance
sheets as the starting point and simulates the impact of the shocks to interest rates and income on
households, comparing the share of vulnerable households and households’ debt-servicing capacity
with the baseline figures. Since the results depend also on the valuation of net wealth, a house price
shock is also included.
0
5
10
15
20
25
0
20
40
60
80
100
120
Euro area
Germany
France
Italy
Spain
Debt Burden 1/
In percent of household income
Debt
Debt service (rhs)
1/ 2010, except for Spain (2008). For indebted households.
0
20
40
60
80
100
0
20
40
60
80
100
<20
20-40
40-60
60-80
80-90
90-100
All
Share of Indebted and Vulnerable Households,
by Income Group
(in percent of total households)
Indebted households
Vulnerable households
0
20
40
60
80
100
0
20
40
60
80
100
<20
20-40
40-60
60-80
80-90
90-100
All
Median Debt Service to Income and Share of
Vulnerable Households, by Income Group
(in percent of indected households)
Debt-service-to-income ratio
Vulnerable households
0
20
40
60
80
100
0
20
40
60
80
100
<20
20-40
40-60
60-80
80-90
90-100
All
Debt at Risk, by Income Group
(in percent of total debt)
Debt at risk
Debt at risk not covered by assets

ITALY
INTERNATIONAL MONETARY FUND 19
32. The sensitivity tests find that credit risk from households is mostly mitigated by their
positive net wealth position, even under severe shocks. Interest rate and income shocks have a
moderate impact on debt-at-risk, in particular when net wealth is taken into consideration. House
price shocks, however, due to the importance of real assets in financial assets, could have a
substantial impact on households’ net wealth and the collateral coverage of their loans.
33. Households are vulnerable to higher interest rate, though uncovered debt at risk
remains fairly moderate even under a severe scenario. About 60 percent of mortgages in the
survey have variable rates (against 70 percent nationally), and a rise in the interest rate could make it
more difficult for household to service their existing mortgages. Assuming a 100 basis points shock
to variable interest rate mortgages––similar to the increase in rates on new mortgages in 2011–12––
would increase the share of distressed households to 11 percent and debt at risk would increase to
29 percent. In a more extreme scenario, where interest rates on mortgages increase by 300 basis
points, the share of distressed households increases to 13 percent, bringing debt at risk to
35 percent. The shocks particularly affect the number of distressed households among the lower
income groups. However, the share of debt at risk, not covered by households’ assets, even in the
most severe scenario (a 300 basis points hike in interest rates) is limited to 1.2 percent of total
household loans.
34. Income shocks have further large impact on debt-servicing capacity, but are also
mitigated by the net wealth position. In a downside scenario where income declines by 3 percent
(similar to the decline in gross household disposable income in 2012), the share of vulnerable
households would increase to close to 11 percent, brining debt at risk to 29 percent. In a more
severe scenario––such as a 15 percent decline in income––14 percent of indebted households would
become distressed, and 36 percent of debt would be at risk. A combined interest rate and income
shock would increase further the share of distressed households, but the debt at risk not covered by
households’ net assets would be limited to about 1.6 percent of total household loans even in the
most severe combined scenario.
35. A housing price shock could, however, have a significant impact on the value of
vulnerable households’ collateral. The debt-servicing capacity is not directly affected by housing
prices. But if housing prices fall, the collateral of the debt held by vulnerable households would be
reduced. A moderate decline in housing prices of 5 percent would increase somewhat debt-at-risk
not covered by assets to 1.6 percent of total household loans, reflecting the prudent loan-to-value
ratios applied to mortgages. But in a more severe downside scenario where housing prices fall
by 20 percent, debt at risk not covered by such collateral could increase to 12 percent, considerably
increasing credit risk for banks.

ITALY
20 INTERNATIONAL MONETARY FUND
Table 2. Italy: Sensitivity Analysis of Indebted Households
(In percent of indebted households)
Income
Ratio of
debt
payment
to income
(median)
Share of
distressed
households
(in percent)
Share of debt
at risk
(in percent)
Debt at risk not
covered by
household
assets
(in percent of
loans)
Baseline
10.1
10.0
26.5
1.2
Shocks
Interest rate increase
Moderate (100 bps)
12.2
10.7
29.3
1.2
Extreme (300 bps)
12.6
12.6
35.1
1.2
Income decline
Moderate (3 percent)
12,2
10.6
29.4
1.3
Extreme (15 percent)
13.9
14.3
35.5
1.6
House price decline
Moderate (5 percent)
10.1
10.0
26.5
1.6
Extreme (20 percent)
10.1
10.0
26.5
11.7
Combined shock
(Interest rate increase and
income decline)
Moderate (100 bps, 3
percent)
10.7
11.3
30.6
1.3
Extreme (300 bps, 15
percent)
12.6
17.2
43.5
1.6
Source: Staff calculations using the Bank of Italy’s 2010 Household Income and Wealth Survey.

ITALY
INTERNATIONAL MONETARY FUND 21
Figure 5. Italian Household: Sensitivity Analysis
Higher interest rates would increase the share of
vulnerable households, especially in mid-income groups
The impact on debt at risk (not covered by net assets) is
limited even in a severe scenario, given high wealth
An adverse income shock would also directly reduce debt-
servicing capacity
But again, large household wealth impact constitutes an
important collateral buffer
A combined severe interest rate and income shock would
make almost 50 percent of households distressed
But as before, large household buffers would dampen the
impact of debt at risk
0
10
20
30
40
50
0
10
20
30
40
50
<20
20-40
40-60
60-80
80-90
90-100
All
Combined Interest Rate and Income Shock:
Share of Vulnerable Households,
by Income Group
(in percent of indebted households)
Baseline
Moderate (Interest +100 bps, income -3%)
Extreme (Interest +300bps, income -15%)
0
5
10
15
20
25
30
35
0
5
10
15
20
25
30
35
<20
20-40
40-60
60-80
80-90
90-100
All
Combined Interest Rate and Income Shock:
Share of Uncovered Debt at Risk,
by Income Group
(in percent of total debt)
Baseline
Moderate (Interest +100bps, income -3%)
Extreme (Interest +300bps, income - 15%)
0
10
20
30
40
50
0
10
20
30
40
50
<20
20-40
40-60
60-80
80-90
90-100
All
Interest Rate Shock:
Share of Vulnerable Households,
by Income Group
(in percent of indebted households)
Baseline
Moderate (100 bps)
Extreme (300 bps)
0
5
10
15
20
25
30
35
0
5
10
15
20
25
30
35
<20
20-40
40-60
60-80
80-90
90-100
All
Interest Rate Shock:
Share of Uncovered Debt at Risk,
by Income Group
(in percent of total debt)
Baseline
Moderate (100 bps)
Extreme (300 bps)
0
10
20
30
40
50
0
10
20
30
40
50
<20
20-40
40-60
60-80
80-90
90-100
All
Income Shock:
Share of Vulnerable Households,
by Income Group
(in percent of indebted households)
Baseline
Moderate (3 percent)
Extreme (15 percent)
0
5
10
15
20
25
30
35
0
5
10
15
20
25
30
35
<20
20-40
40-60
60-80
80-90
90-100
All
Income Shock:
Share of Uncovered Debt at Risk,
by Income Group
(in percent of total debt)
Baseline
Moderate (3 percent)
Extreme (15 percent)

ITALY
22 INTERNATIONAL MONETARY FUND
Figure 5. Italian Household: Sensitivity Analysis (concluded)
A house price shock does not directly affect households’
debt-servicing capacity on existing debt
But could severely reduce the value of collateral for
already vulnerable households
1/ Based on simulations of severe shocks to interest payments due ( 100 and 300 basis points increase), to income (3 and 15
percent decline), to a combination of interest payment and income, and to housing prices (5 and 20 percent).
THE ITALIAN NON-FINANCIAL SECTOR
10
A. Non-Financial Corporate Balance Sheets
36. The Italian corporate sector is dominated by SMEs. The SME’s share in business valued
added is above 70 percent, with 33 percent produced by micro enterprises, compared to EU
averages of 58 percent and 22 percent, respectively.
11
37. The debt burden of the corporate sector is moderate, but leverage is high. Corporate
balance sheets, made fragile by the prolonged recession, are weighed down by a historically high
level of debt in relation to both value added and equity. Leverage has increased during the crisis,
though mostly reflecting a decline in the value of equity. On average, Italian firms’ leverage is
among the highest in the euro area (Figure 6). SMEs are more highly leveraged than other firms.
In 2011, micro firms had a leverage ratio of 58 percent and small firms 55 percent, both above the
average of 52 percent in the Bank of Italy’s dataset of Italian companies. Large companies have
below average leverage (at 49 percent).
10
In this paper, the terms corporate sector, corporate and firms are used to refer to non-financial corporations.
11
European Commission (2011). A micro firm employs fewer than 10 persons and its annual turnover and/or balance
sheet total does not exceed EUR 2 billion. A small firm employs fewer than 50 persons and its annual turnover and/or
balance sheet total does not exceed EUR 10 million. A medium-sized firm employs fewer than 250 persons and its
annual turnover or balance sheet total does not exceed EUR 50 million or EUR 43 million, respectively.
0
10
20
30
40
50
0
10
20
30
40
50
<20
20-40
40-60
60-80
80-90
90-100
All
House Price Shock:
Share of Vulnerable Households,
by Income Group
(in percent of indebted households)
Baseline
5 pecent
20 percent
0
5
10
15
20
25
30
35
0
5
10
15
20
25
30
35
<20
20-40
40-60
60-80
80-90
90-100
All
House Price Shock:
Share of Uncovered Debt at Risk,
by Income Group
(in percent of total debt)
Baseline
5 pecent
20 percent

ITALY
INTERNATIONAL MONETARY FUND 23
38. The reliance on bank financing is high, in particular for SMEs. In 2011, bank lending to
firms represented 56 percent of GDP, against 49 percent on average for the euro area and
35 percent for Germany and 43 percent for France. About 50 percent of non-financial corporations’
financial debt is from banks, but for SMEs, the reliance on bank debt is higher, at 73 percent. Also,
Italian companies’ reliance on bond financing is limited. In 2012, the ratio of securities to loans was
8 percent, against 12 percent on average for the euro area and 40 percent for the United Kingdom.
The level and composition of Italian firms’ bank debt made them vulnerable to higher interest rates
and tighter bank lending standards during the crisis.
39. A large share of debt has short maturity. Loans with an original maturity of less than one
year make up 45 percent of firms’ bank debt in Italy, compared with 24 percent in the euro area. The
maturity of debt has shortened during the crisis, partly reflecting that bank lending standards
tightened more for long-term than short-term financing. SMEs are more vulnerable, with 54 percent
of their bank debt being short term.
40. Italian firms face headwinds from weak profitability. The protracted recession has
caused a sharp decline in profitability, with gross operating profit of firms continuing to fall in 2011,
having recovered in most large European economies, and its ratio to value added falling to the
lowest level since the 1990s (34 percent). The proportion of profit-making firms was 57 percent
in 2011, while 25 percent were loss-making (Figure 6). Exporting firms are faring somewhat better
than other firms, with 65 percent recording profits and 23 percent recording losses.
41. The construction and real estate sectors have been hit strongly by the crisis. The
recession in the construction sector started in 2005, earlier than the economy-wide recession,
following a prolonged expansion since the end of the 1990s. As the financial crisis deepened, the fall
in non-residential investment has been particularly severe, with non-residential investment currently
at 70 percent of its pre-crisis level, and residential investment at 85 percent. Despite the decline in
investment, the stock of unsold new houses suggests that there is a considerable over-supply in the
market.
42. Delays in intra-firm payments reinforce payment difficulties. The need of many firms for
external financing continued to reflect the large delays in payment of business transactions. The
average payment duration for Italian firms was 96 days in 2012, among the longest in the euro area
(Intrum Justitia, Figure 6). The payment delays have increased during the crisis, and the percentage
of firms with very late payments (more than 60 days beyond the agreed payment date) was
9 percent in 2013 Q1 (Cerved group). The delays in intra-firm payments to some extent are due to
the delays payments by the public administration—at an average of 180 days, the longest in the
euro area, which is currently being addressed (see section III.B).
43. Firms’ liquidity buffers have been relatively stable. The average liquidity ratio (current
assets to current liabilities) has been relatively stable at 114 percent during the crisis,
two percentage points below the average in the pre-crisis years (Cerved group). It increased
from 2009 to 2011 for small firms, whereas it decreased for medium and large enterprises. Firms can
still rely on substantial bank credit lines. The ratio between drawn and granted credit lines is equal

ITALY
24 INTERNATIONAL MONETARY FUND
to 57 percent, though it has been increasing in recent years (Central Credit Registry). The ratio is
lower for larger firms (with more than 20 employees), suggesting that these firms can rely on larger
liquidity buffers.
B. Financial Linkages
44. Bank credit to firms has declined substantially since the onset of the crisis. The growth
in bank loans to firms, net of repos and bad debts, began to slow from the middle of 2011 and
turned negative in mid-2012. By May 2013, credit was contracting at 3.6 on an annual basis. Unlike
the previous phase of reduction in credit in 2009, the contraction of the past months was greater for
small firms. The rising trend of bank interest rates for firms, under way since the middle of 2010,
slowed somewhat in 2012. In June, interest rates on new loans to firms were on average 3½ percent,
90 basis points above the euro area average reflecting continued financial fragmentation.
45. The decline in credit reflects both tighter credit conditions and slower demand.
12
The
Bank Lending Survey shows that both demand and supply factors have affected credit, though with
different intensity at varying stages of the crisis (Figure 7). The slowdown in credit to firms
during 2008–09 reflected to a large extent weak loan demand. From 2010 onward, when the
economy recovered, supply constraints started playing an increasingly important role, and by the
second half of 2011 at the peak of the Italian sovereign crisis, supply factors were prevailing.
However, as demand collapsed in 2012, the situation reversed, so that weak demand now tends to
be the stronger factor driving the decline in credit. Consistent with this, according to the Survey of
Industrial and Service Firms, some 40 percent of firms reported a worsening of access to credit in the
second half of 2011, twice as many as in the corresponding period of 2010. The leading reason cited
for the deterioration was the cost of credit, but the share of firms that had trouble getting the
desired amount of financing also rose significantly. The percentage of firms reporting that they got
less than the full amount of credit requested reached its highest level since the start of the crisis.
12
See Zoli (2013) for a discussion of the role of supply and demand in explaining recent credit developments.

ITALY
INTERNATIONAL MONETARY FUND 25
Figure 6. Italy: Corporate Leverage, Funding Sources, and Profitability
Italian firms have high leverage in an international
perspective
Leverage is higher for smaller firms
Reliance on bank loan financing is large in Italy
The share of loss-making firms has increased and that of
profit-making firms has fallen
Profitability has not recovered in line with other European
economies
Delays in government and intra-firm payments are among
the highest in the euro area
30
35
40
45
50
55
60
65
70
30
35
40
45
50
55
60
65
70
2000
2002
2004
2006
2008
2010
2012
Firm Leverage, 2000-2012
(Debt to the sum of debt plus equity, in percent)
Italy
France
Germany
Spain
Euro area
UK
Source: National statistics agencies and central banks.
40
45
50
55
60
65
40
45
50
55
60
65
Micro
Small
Medium
Large
Total
Leverage, by Firm Size (2011)
Source: Bank of Italy.
0
20
40
60
80
100
120
140
160
180
200
0
20
40
60
80
100
120
140
160
180
200
Italy
Spain
Euro area
France
United
Kingdom
Germany
Payment Duration for Government and Businesses
(Average, in days, 2012)
Government
Businesses
Source: Intrum Justitia.
0
10
20
30
40
50
60
70
80
0
10
20
30
40
50
60
70
80
2003
2004
2005
2006
2007
2008
2009
2010
2011
Operating Results
(Percent of firms)
Profit-making firms
Loss-making firms
Source: Bank of Italy.
-20
-15
-10
-5
0
5
10
15
-20
-15
-10
-5
0
5
10
15
2005
2006
2007
2008
2009
2010
2011
Firms' Gross Operating Profit
(Annual change, in percent)
Euro area
Germany
Spain
France
Italy
UK
Source: Eurostat.
0
50
100
150
200
250
300
0
50
100
150
200
250
300
Germany
Italy
Euro area
Spain
UK
France
Loans
Bonds
Equity
Non-Financial Corporations' Financing , 2002 and 2011
(In percent of GDP)
Source: Eurostat.

ITALY
26 INTERNATIONAL MONETARY FUND
46. Firms’ financial difficulties have translated into a sharp deterioration in banks’ asset
quality. The share of firms’ loans that are considered non-performing reached 25 percent in
June 2013, with that of smaller firms 26 percent. The flow of new bad debts (as a ratio of
outstanding firm loans) have increased to 3 percent from about 1 percent pre-crisis (annualized,
Figure 7). The stock of bad debt was 14.1 percent of total firm debt in June 2013, of which less than
40 percent is secured with real assets. Default rates, in terms of number of borrowers defaulting
each year, have doubled relative to the pre-crisis years to 3 percent in 2012. For the more forward-
looking categories, in June 2013, substandard loans represented another 7.3 percent of total loans,
while restructured and past due were 1.1 and 2.6 percent, respectively. Once classified as non-
performing, the loan quality in most cases deteriorates, as shown by the transition dynamics
between the NPL categories, suggesting continued increases in bad loans going forward.
47. Loans to construction firms represent considerable risk for Italian banks. These loans
amounted to EUR 150 billion in 2011 or 10 percent of total credit to the private sector. Based on
Cerved Group data, 52 percent of construction firms made losses in 2011, compared to 35 percent
for manufacturing firms and 42 for the entire sample. In August 2012, 16 percent of bank loans to
construction firms were classified as bad debts and another 14 percent were impaired. Banks also
have a substantial exposure (EUR 120 billion) to real-estate service companies (sales, rentals,
management and brokerage). The quality of credit to these companies is deteriorating rapidly;
8 percent of all loans were classified as bad debts and another 14 percent were substandard,
restructured or past due.
48. The use of collateral to back loans has increased. The share of firms’ loans that are
backed by collateral or guarantees increased from 64 to 68 percent between 2007 and 2012. The
increase was stronger for smaller firms, whose access to new financing is more conditioned on the
availability of collateral. Many firms benefit from guarantees issued by the entrepreneur (or a
member of the entrepreneur’s family), backed by personal real and financial assets. These kinds of
guarantees are estimated to represent about 15 percent of total real and financial assets used as
collateral or guarantees for loans. There is however no harmonized data reporting on collateral held
by banks and also no available data on unpledged assets that could be used as collateral or
guarantees for new loans.
-10
-8
-6
-4
-2
0
2
4
-10
-8
-6
-4
-2
0
2
4
2008
2009
2010
2011
2012
Transition Between Impaired Loan Categories
In percent of total loans to firms
Worsen
Improve
Net improvement
Source: Bank of Italy.
0
5
10
15
20
25
30
0
5
10
15
20
25
30
Jan-06
Jan-07
Jan-08
Jan-09
Jan-10
Jan-11
Jan-12
Jan-13
Firms Non-Performing Loans
In percent of total loans to firms
Small firms
Large and medium-sized firms
Source: Bank of Italy.

ITALY
INTERNATIONAL MONETARY FUND 27
Box 2. Italy—Measures to Support SME Financing
During the crisis, several initiatives have been implemented to alleviate SMEs’ temporary
debt payment difficulties and support their access to credit:
Debt Payment Moratoria for SMEs. The government, the banking association, and business
associations signed an agreement in August 2009 to allow the suspension of principal
repayments on part of SME debt. During the first two years, the moratorium was applied to
debt totaling EUR 65 billion on 225,000 loans, resulting in the suspension of some
EUR 15 billion in loan repayments. A new moratorium with stricter eligibility criteria was agreed
in February 2012, which was applied to debt of EUR 28 billion as of April 2013. Although it
expired in June 2013, a new round of debt moratoria similar to previous ones was signed in
July 2013. The moratoria have helped firms face temporary payment difficulties. According to
the Bank of Italy, regular payments are resumed for about 60 percent of loans after suspension,
suggesting limited forbearance risk.
Payment of Government Overdue Debt. To ease the liquidity problems of suppliers due to
late payments by government entities, the government approved in April 2013 a plan to pay a
substantial part (EUR 40 billion, 2½ percent of GDP) of its overdue debt during 2013–14. The
implementation of the plan, which was approved by Parliament in May 2013, should bolster
firms’ liquidity position and improve their debt-servicing capacity, and more generally, boost
growth, thereby enhancing firm profitability. Moreover, in August 2013 a plan to further
increase the payment by EUR 7 billion in 2013 was approved.
Guarantee Fund for SMEs. The government’s Guarantee Fund for SMEs was boosted in
response to the crisis, by increasing its endowment, widening the eligibility criteria for firms,
easing the minimum requirement for the firm’s financial indicators, and providing a
government back-stop guarantee to allow a more favorable prudential treatment of the
guarantees. The value of the guarantee amounts to a maximum of 80 percent of the loan (or
EUR 1.5 million). Up to end-2012, the fund had given guarantees amounting to EUR 21 billion,
for total loan amounts of EUR 39 billion.
The SME Plafonds from Cassa Depositi e Prestiti (CDP). Since 2009, CDP has used its retail
deposit base to grant medium-and long-term credit to SMEs through banks at below-market
interest rates. The total amounts that can be provided are EUR 18 billion, 75 percent of the
banking system participates, and 60,000 firms have received financing so far.
Initiatives are also in place to strengthen capital and promote alternative financing
opportunities for SMEs, to reduce their leverage and reliance on bank funding. First, the
Italian Investment Fund (a EUR 1.2 billion private equity fund promoted by the government and
mainly funded by the largest Italian banking groups) supports capital strengthening and mergers
and acquisitions among medium and large enterprises. Second, to strengthen the capitalization of
firms and foster “internal” growth, the government has made the notional return on new equity
deductible from taxable income, according to the allowance for corporate equity principle. Finally,
the government increased fiscal incentives to facilitate the issuance of unlisted firms of
commercial paper and bonds.

ITALY
28 INTERNATIONAL MONETARY FUND
Figure 7. Italy: Firms’ Financial Conditions
Credit to firms has declined, and interest rates remain high
despite lower euro area rates
Bank credit standards have tightened substantially, and
demand for credit has declined.
The flow of new bad debts from firms is on an increasing
trend
Firms’ non-performing loans have doubled in the past five
years
New bankruptcy proceedings reached new highs in 2012,
making it more challenging to reduce the length
The use of corporate restructuring options is moderate and
below pre-crisis levels
0
2
4
6
8
10
-5
0
5
10
15
20
Jan-07
Dec-07
Nov-08
Oct-09
Sep-10
Aug-11
Jul-12
12- Month Credit Growth and Interest Rates 1/
(In percent )
Credit growth (lhs)
Interest rates, loan < €1 million
Interest rates, loan > €1 million
Source: Bank of Italy and ECB.
1/ Corrected for securitization. Interest rates on new loans (rhs).
0
1
2
3
4
5
6
0
1
2
3
4
5
6
1997
1999
2001
2003
2005
2007
2009
2011
2013
Ratio of New Bad Debt to Outstanding
Firm Loans
(In percent, annualized)
Source: Bank of Italy.
0
5
10
15
0
5
10
15
2006
2007
2008
2009
2010
2011
2012
Bankruptcy Proceedings
New bankruptcy proceedings (thousands)
Time to close court case (years)
Source: Ministry of Justice and Cerved Group.
0
1
2
3
4
5
6
7
8
0
1
2
3
4
5
6
7
8
2003
2004
2005
2006
2007
2008
2009
2010
2011
Firms Involved in Corporate Restructuring 1/
Industry
Services
Source: Bank of Italy.
1/ Covers mergers, acquisitions, contributions, transfers and splits.
-80
-60
-40
-20
0
20
40
60
80
100
120
-80
-60
-40
-20
0
20
40
60
80
100
120
2008
2009
2010
2011
2012
2013
Bank Lending Standards and Demand
(Net percentages)
SME(credit standards)
SME (demand)
Large enterprises (credit standards)
Large enterprises (demand)
Source: Bank Lending Survey, Bank of Italy.
1/ Difference betweeen the sum of the percentages for tightened and eased for
credit standards and increased and decreased for loan demand.
0
5
10
15
20
25
30
0
5
10
15
20
25
30
2007
2008
2009
2010
2011
2012
Jun-13
Firms' Non-Performing Loans
(In percent of total loans)
Bad
Restructured
Substandard
Past due
Source: Bank of Italy.

ITALY
INTERNATIONAL MONETARY FUND 29
49. Several initiatives have been implemented by the government and banks to support
firms’, in particular SMEs’, access to credit (Box 2). The government, the Banking Association, and
business associations signed an agreement in August 2009 to allow the suspension of principal
repayments on some forms of debt held by SMEs. During 2009–11, 225,000 applications were
accepted and the moratorium was applied to debt totaling EUR 65 billion (three quarters of it in the
form of mortgages). It is estimated that the agreement resulted in the suspension of some
EUR 15 billion in loan repayments. New moratoria with stricter eligibility criteria were agreed in
February 2012 and July 2013. 68,000 applications were accepted and the moratorium was applied to
debt totaling EUR 22 billion. Evidence from Bank of Italy inspection suggest that the forbearance risk
related to the moratoria is limited, as following the suspension, regular payments were resumed in
respect of loans worth 60 percent of the total value covered by the moratorium (Bank of
Italy, 2012c).
50. The government’s new initiative to pay overdue debt represents a crucial step to ease
firms’ liquidity constraints. The government approved in 2013 a plan to pay a substantial part
(EUR 47 billion, 3 percent of GDP) of its overdue debt during 2013–14. The implementation of the
plan should bolster firms’ liquidity position and improve their debt-servicing capacity, and more
generally, boost growth and reduce uncertainty in the economy, thereby enhancing firm
profitability.
C. Insolvency and Debt Restructuring
51. The number of business closures and bankruptcies has increased substantially. About
104,000 firms closed in 2012, representing a 2¼ percent increase from 2011 (Cerved Group, 2013a).
The largest share of firm closure consists of voluntary liquidations (about 90,000). In 2012, over
12,000 bankruptcy procedures began, a 2¼ percent increase from 2011, and the highest number
registered in historical data. Since 2009, more than 45,000 firms have declared bankruptcy, nearly
half of them in the service sector (Figure 7). The bankruptcy rate is however largest in industrial
companies, where 5¼ percent of firms have declared bankruptcy, as compared to 4½ percent in the
construction sector and 2¼ percent in the service sector. Non-bankruptcy insolvency procedures,
including proceedings oriented at debt restructuring, also increased in late 2012, especially in the
construction sector. An early warning indicator for bankruptcies––official complaints of late
payments––suggest that a further deterioration is
likely in the near term (Cerved Group, 2013b).
52. Firms have only made moderate use of
debt restructuring operations. The share of firms
resorting to restructuring or re-negotiations of loans
was about 7 percent in 2011, down from 10 percent
in 2010 (Bank of Italy, 2012d). The most commonly
used restructuring operations are a lengthening of
the maturity of the loan and granting additional
financing, whereas converting debt to equity or
writing down debt were only used in a few instances.
10
15
20
25
10
15
20
25
2007
2007
2008
2008
2009
2010
2010
2011
2011
2012
2013
Official Complaints of Late Payments
In thousands of firms
Source: Cerved Group.
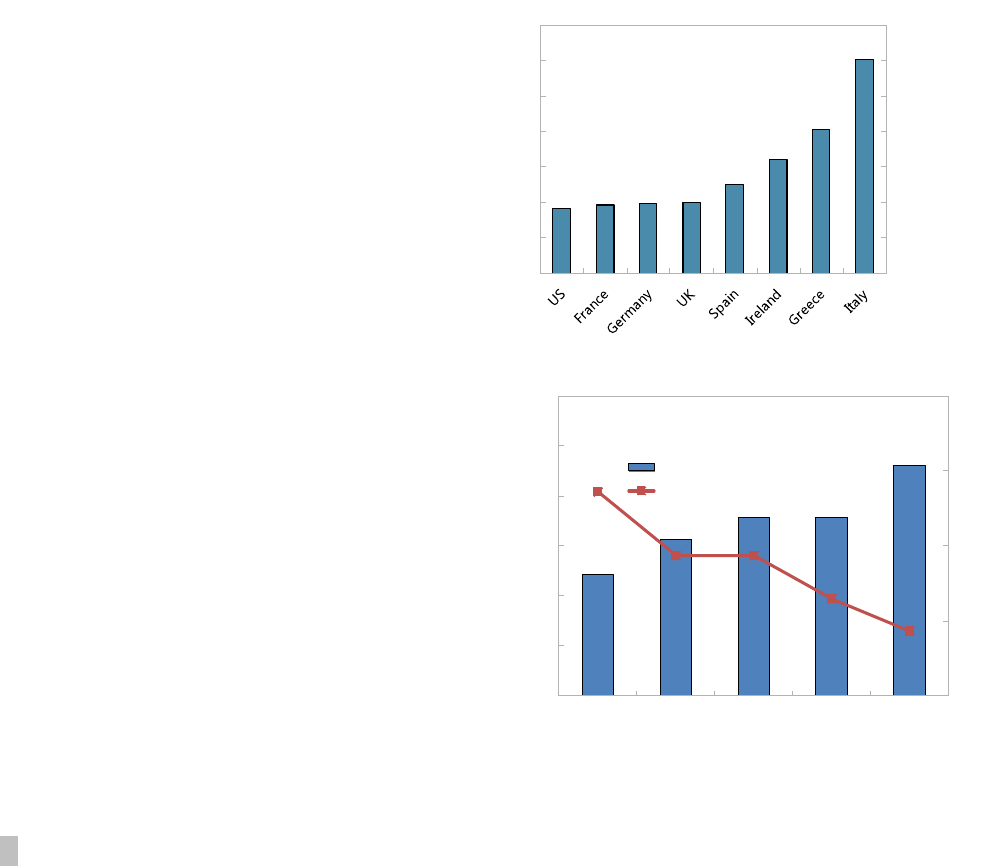
ITALY
30 INTERNATIONAL MONETARY FUND
The use of corporate restructuring options is also limited; the share of firms resorting to corporate
restructuring (including mergers, acquisition, contributions, transfers and splits) was 3.6 percent
in 2011, broadly unchanged from 2010 (3.7 percent) (Bank of Italy, 2012d, Figure 7).
53. The legal framework for bankruptcy has been amended in past years (Box 3). The
bankruptcy framework comprises three main restructuring options; creditor composition, debt
restructuring agreement and out-of-court restructuring plan. Recent reforms have introduced
several aspects to facilitate restructuring and business continuation, including super-priority status
for interim financing, a moratorium on creditors’ action; and no claw-back action in relation to
payments made pursuant to the agreements. While the restructuring options have been successfully
used by some companies to avoid liquidation, there have also been cases of abuse. Some
companies file applications to take advantage of the moratoria on payments and seek to “buy-time”
relating to their debts, to delay the commencement of liquidation proceedings. The courts are
becoming increasingly mindful of abuses, are taking measures to mitigate the problem.
54. The liquidation process continues to be slow, partly attributed to lengthy court
proceedings. The reform of bankruptcy law has reduced the backlog of bankruptcy cases, bringing
the average time to complete the court case down
from a peak of more than nine years in 2008 to
about seven years in 2011. However, geographical
differences are substantial—while some courts
have committees for bankruptcy courts and the
process is relatively faster, some other courts face
a substantial backlog of cases. The lengthy court
procedures represent an important hurdle to
corporate restructuring in Italy, and are part of a
wider problem of enforcing contracts in Italy
compared to in other advanced economies.
55. Banks’ make limited write-offs of non-
performing loans, partly reflecting the lengthy
legal procedures, as well as fiscal disincentives.
The stock of banks’ legacy NPLs from firms is already
high, and new NPLs are rising quickly. Banks’ write-
offs have been limited over the past years, and have
declined to below ½ percent of non-performing
loans in 2012.
Lengthy legal procedure. It takes on average
three years to obtain a real estate asset used for
collateral through court and on average seven
years to close a bankruptcy procedure.
0
200
400
600
800
1000
1200
1400
0
200
400
600
800
1000
1200
1400
Enforcing Contracts:
Time to Resolve a Dispute
Through Courts (days)
Source: World Bank Doing Business
0.0
0.5
1.0
1.5
2.0
0
5
10
15
20
25
30
2008
2009
2010
2011
2012
Italy - Firms NPLs (percent of loans) and Write-
Offs (in percent of NPLs)
Stock of NPLs
Write-off (rhs)
Source: Bank of Italy.

ITALY
INTERNATIONAL MONETARY FUND 31
Fiscal disincentives for provisioning and write-offs. The deductibility from taxable income of
loan-loss provisions is limited to 0.3 percent of the banks’ outstanding loans, with the exceeding
amount being deductible over 18 years. The tax deductibility of write-offs follow a similar
treatment, except in cases of a court judgment on insolvency, small loans delinquent for over six
months and losses resulting from the sale of a distressed asset.
A price gap between banks’ valuation of the asset (the book value) and the market’s
valuation of the asset. The high uncertainty about the developments of the real economy
pushes investors to ask for a large haircut on distressed assets, and there is limited activity in the
private market for distressed assets, in Italy, as in the rest of Europe.
Box 3. Italy—The Legal Debt Restructuring Framework for Firms
1
The Italian Bankruptcy Law has been amended several times from 2006 to 2012 to better facilitate
the reorganization/ rehabilitation of firms. It comprises of three main restructuring options:
(i) creditor composition; (ii) debt restructuring agreement; and (iii) out-of-court restructuring plan.
Important features which have been introduced to facilitate restructuring/business continuation
for (i) and (ii) include: (a) super priority status for interim financing; (b) a moratorium on creditors’
action; (c) no claw-back action in relation to payments made pursuant to the agreements (also for
(iii)); and (d) the possibility to switch from (i) to (ii) and vice versa. The three main options are
summarized below.
Creditor composition: This process, which is designed to enable the company to continue
business as a going concern, involves reaching a creditors composition agreement with the
majority of creditors (50 percent plus 1 of the liabilities admitted to the list of liabilities) or
majority of all claims and classes of creditors (if creditors are divided into different classes).
Once approved by the court, it becomes binding on all creditors. Secured creditors need to
receive a minimum payment of at least what they would expect from the sale of the assets over
which they have security and can only vote for the part of the debt on which they are not to
receive a payment under the proposal or if they give up their security. An independent expert is
required to evaluate the accuracy of the financial data and feasibility of the proposal. This
process allows the company to suspend payments (relating to privileged credits) for a period of
up to 180 days, while negotiating the agreement with creditors and this suspension remains in
force until the court approves the agreement.
Debt restructuring agreement: This procedure involves the company reaching a restructuring
agreement with the majority of creditors holding at least 60 percent of the value of all claims
and becomes binding after the court’s approval. The agreement does not bind creditors who
are not parties to the agreement, but payment for such creditors may be delayed by up to 120
days. An independent expert is required to evaluate the accuracy of the financial data and
feasibility of the proposal. As soon as the debtor files a proposal, he can ask the court for a
moratorium for up to 60 days (extendable by a further 60 days), to allow the debtor to
negotiate the agreement with creditors.

ITALY
32 INTERNATIONAL MONETARY FUND
Box 3. Italy—The Legal Debt Restructuring Framework for Firms (concluded)
Restructuring plan: This out-of-court procedure involves the company proposing an
agreement with some of its creditors to restructure certain debt. Creditors who do not take part
in the agreement are not bound by the terms. An independent expert appointed by the debtor
is in charge of evaluating the accuracy of the financial data and feasibility of the proposal. The
law provides for immunity of the operations under the plan from the risk of claw-back in a
bankruptcy proceeding.
In addition, other available restructuring procedures specific to the size of companies include:
Extraordinary administration. This process is available for a large insolvent company - one who
employs at least 200 employees and with accrued debts amounting to two-thirds of assets or
previous years’ revenues or 500 employees, with outstanding debt of at least EUR 300 million. An
extraordinary commissioner manages the company’s assets and prepares a restructuring plan. The
plan usually involves a creditor composition and must be approved by the majority of creditors.
Over-indebtedness agreement. Similar to the debt restructuring agreement, this process is
available for small entities and involves reaching an agreement with at least 60 percent of
creditors. Secured creditors do not vote if they are paid the full amount of their credits but may
be paid with a maximum of one year delay. The agreement is reviewed and approved by the
court. Payments are suspended in the interim to allow the preparation of the plan.
_________________________________
1/
Box 3 was drafted by Dawn Chew (Legal Department).
D. Sensitivity Analysis
56. This section analyzes the risk to financial stability from firm indebtedness. The analysis
is done by the Bank of Italy using Cerved data through 2011, covering almost 700,000 Italian firms
holding 80 percent of the total financial debt of Italian corporations. To assess vulnerabilities, the
analysis considers the financial situation of firms in 2011 (the baseline) and the impact of a set of
hypothetical macroeconomic shocks, based on an extrapolation of the dataset to 2012 using
national and financial accounts and to 2013 using the FSAP stress test scenario. The macroeconomic
shocks illustrate the principal risks to Italian firms: a further decline in profitability and a worsening
of firms’ financing terms.
Baseline
57. Almost one third of firms, holding half of the financial debt, could be considered
vulnerable based on the ratio of interest expense to gross operating income. The ratio of
interest expense to gross operating profits has increased in past years, though remains below the
peak in 2008 (Table 3). Taking a conservative threshold, a firm could be considered vulnerable if the

ITALY
INTERNATIONAL MONETARY FUND 33
ratio is above 50 percent, implying an interest coverage ratio of less than 2.
13
Rating agencies
estimate that coverage ratios below 2 are broadly consistent with B ratings or lower, suggestive of
about 20 percent probability of default over a five-year horizon. With this threshold, 31 percent of
the firms are considered vulnerable. These firms hold 47 percent of the debt (“debt at risk”). While
the proportion of vulnerable firms has decreased since the peak in 2008, it has been on an upward
trend in the past two years. The high vulnerabilities are consistent with the already high default rates
of Italian firms.
58. Smaller firms and firms in the construction and real estate sectors have a larger
proportion of debt at risk. Among micro-and small-sized firms, the proportion of vulnerable firms
is 31 percent and 27 percent, respectively, compared to 24 percent for large firms (Table 4). On this
basis, about 54 percent of micro firms’ debt and 49 percent of small firms’ debt is at risk. This is
consistent with the higher non-performing loans among smaller firms. Furthermore, the analysis
confirms the vulnerabilities of the construction and real estate sectors. Figure 8 shows that firms in
agriculture has the largest share of vulnerable firms (44 percent), followed by construction
(34 percent) and real estate (29 percent). The debt at risk in the construction and real estate sectors
is particularly high, from 55 and 65 percent, as vulnerable firms have larger debt than in other
sectors.
Table 3. Italy: Firms’ Ratio of Interest Expense to Gross Operating Income
Year
Number of
firms
Ratio of interest expense to
gross operating income
Firms with ratio above
50 percent
Average
Median
Share of firms
Share of debt
held
2008
682,960
31.4
24.4
35.5
49.4
2009
701,389
25.2
20.9
34.4
43.8
2010
706,334
20.3
15.8
30.3
42.0
2011
684,569
22.3
16.7
30.5
43.7
2012
684,569
23.9
30.8
46.6
Source: Bank of Italy
13
The choice of the ratio of interest expense to gross operating income rather than the interest rate coverage ratio
(gross operating income/interest expense) adds an additional layer of caution. The interest coverage ratio would not
be calculated if interest expense is zero, but the ratio of interest expense to gross operating income would be zero
independently of the gross operating income. In cases where the gross operating income is zero or negative, the
ratio of interest expense to gross operating income is approximated by the 99
th
percentile of the firm distribution;
implying that firms with non-positive operating income are classified as vulnerable in any case. An interest coverage
ratio below 1 would imply that the firm is not able to service its debt, while a ratio of 1½ is in most cases considered
a “bare minimum,” and a ratio below 2 percent would imply substantial vulnerabilities.

ITALY
34 INTERNATIONAL MONETARY FUND
Table 4. Italy: Ratio of Interest Expense to Gross Operating Profits by Firm Size (2011)
Size of
firm
Number of
firms
Ratio of interest expense to
gross operating income
Firms with ratio above 50 percent
Average
Median
Share of firms
Share of debt held
Micro
587,147
33.2
16.0
31.2
54.4
Small
71,159
26.8
20.0
26.8
48.5
Medium
21,060
21.4
17.3
24.8
40.0
Large
5,203
18.9
15.6
23.8
37.8
Total
684,569
22.3
16.7
30.5
43.7
Source: Bank of Italy.
Figure 8. Italy: The Financial Situation of Italian Firms
Interest coverage and the share of vulnerable firms has
improved since 2008, but remain elevated
Debt at risk is also down from the peak in 2008, but was
estimated at 46 percent in 2012.
Smaller firms are more vulnerable, and have a higher
proportion of debt-at-risk
Construction and real estate are the sectors with the
highest proportion of debt at risk
20
25
30
35
40
45
20
25
30
35
40
45
2002
2004
2006
2008
2010
2012
(est.)
Vulnerability of Italian Firms
Share of vulnerable firms
Average interest expense/gross operating income
Source: Bank of Italy.
30
35
40
45
50
55
60
20
25
30
35
40
Micro
Small
Medium
Large
Vulnerability of Italian Firms, by Firm Size, 2011
Share of vulnerable firms
Share of debt held by vulnerable firms (rhs)
Source: Bank of Italy.
30
35
40
45
50
55
60
65
70
20
25
30
35
40
45
50
Vulnerability of Italian Firms, by Sector, 2011
Share of vulnerable firms
Share of debt held by vulnerable firms (rhs)
Source: Bank of Italy.
40
42
44
46
48
50
20
25
30
35
40
2008
2009
2010
2011
2012 (est)
Vulnerability of Italian Firms' Debt
Share of vulnerable firms
Share of debt held by vulnerable firms (rhs)
Source: Bank of Italy.

ITALY
INTERNATIONAL MONETARY FUND 35
Sensitivity Test Scenarios
59. Downside shocks would increase credit risk stemming from the corporate sector,
though the increase in vulnerable firms and debt at risk is contained. The 2013 baseline
assumes a 3 percent reduction in operating income and 25 basis points fall in interest rates,
consistent with the macroeconomic framework used for the FSAP stress tests. The following shocks
are imposed in addition:
Profitability. Simulations show that the impact on firms’ debt-servicing capacity of a decline
in operating income by 10 percent (slightly more than in the 2011–12 downturn) or by a
more severe 15 percent would be moderate.
Interest rates. The impact of an interest rate shock is somewhat more pronounced; a
50 basis points increase in interest rates, in line with the increase seen in 2011/12, would
increase the proportion of vulnerable firms to 32 percent, putting 51 percent of firms’ debt
at risk. A doubling of the shock to 100 basis points would further increase debt at risk by
1½ percentage points.
Combined severe shock. In the extreme event of a combined severe shock (15 percent
decline in operating income, 100 bps increase in interest rates), the proportion of vulnerable
firms would reach 34 percent, leaving 55 percent of debt at risk.
60. Reflecting a weaker starting point, smaller firms are most vulnerable to shocks. Under
a combined severe shock, the proportion of vulnerable firms among micro and small firms could rise
to 33–24 percent and debt at risk for micro firms would represent almost two-thirds of their total
debt.
Table 5. Italy: Ratio of Interest Expense to Gross Operating Profits by Firm Size (2011)
Size of
firm
2013
baseline
Operating
income:
-10 percent
Operating
income:
-15 percent
Interest rate:
+50 bps
Interest rate:
+100 bps
Combined: Operating
income -15 percent,
interest rate +100 bps
Share of vulnerable firms
Micro
31.3
31.9
32.4
32.5
33.2
34.4
Small
27.7
28.8
29.6
29.7
31.1
33.3
Medium
26.5
27.5
28.4
28.8
30.3
32.4
Large
25.6
26.4
27.0
27.6
29.0
30.9
Total
30.7
31.4
31.9
32.0
32.9
34.2
Share of debt held by vulnerable firms
Micro
58.1
59.5
60.6
59.5
60.6
65.4
Small
52.4
54.2
55.6
54.2
55.6
61.0
Medium
43.5
45.4
46.5
45.4
46.5
52.5
Large
39.6
42.7
45.2
42.7
45.2
48.5
Total
46.5
48.8
50.6
48.8
50.6
55.0
Source: Bank of Italy.

ITALY
36 INTERNATIONAL MONETARY FUND
Figure 9. Italy: Sensitivity Analysis for Italian Firms
The average share of interest in operating income is highly
sensitive to income and interest rate changes
The share of debt held by vulnerable firms could reach 55
percent in a severe downside scenario
Medium-sized firms would experience the largest increase
in vulnerability in a downside scenario
In a severe downside scenario, more than 60 percent of
debt held by micro and small firms would be at risk
E. Contingent Claims Analysis
14
61. A Contingent Claims Analysis (CCA) helps assess market expectations of failures of
large corporations, with potential implications for banks. The CCA, based on Merton (1974),
allows estimating the probability that a company may not be able to meet its debt obligation in the
future, thus imposing losses on its creditors. It is based on market information; implicitly embedding
market participants’ view of listed companies, to the extent that the market incorporates efficiently
14
The CCA was carried out by David Velazquez-Romero with data from Moody’s KMV.
25
30
35
25
30
35
Baseline
Operating
income -10%
Interest rate +50
bps
Operating
income -15%,
interest rate
+100bps
Proportion of Vulnerable Firms,
by Firm Size
Micro
Small
Medium
Large
Source: Bank of Italy.
40
50
60
70
40
50
60
70
Baseline
Operating
income -10%
Interest rate +50
bps
Operating
income -15%,
interest rate
+100bps
Proportion of Debt Held by Vulnerable Firms,
by Firm Size
Micro
Small
Medium
Large
Source: Bank of Italy.
20
25
30
35
20
25
30
35
Baseline
Operating
income -
10%
Operating
income -
15%
Interest
rate +50
bps
Interest
rate +100
bps
Operating
income -
15%,
interest
rate
+100bps
Average Ratio of Interest Expenditure to Gross
Operating Income
Source: Bank of Italy.
45
46
47
48
49
50
51
52
53
54
55
25
26
27
28
29
30
31
32
33
34
35
Baseline
Operating
income -
10%
Operating
income -
15%
Interest
rate +50
bps
Interest
rate +100
bps
Operating
income -
15%,
interest
rate
+100bps
Sensitivity of Firms to Shocks
Share of vulnerable firms
Share of debt held by vulnerable firms (rhs)
Source: Bank of Italy.

ITALY
INTERNATIONAL MONETARY FUND 37
all relevant information into the companies’ equity prices. Moody’s-KMV has developed a
comprehensive database of listed companies around the world, to estimate credit risk indicators
using the Merton model. The CCA’s time-series estimates of default probabilities provide useful
information of how market views develop over time. Estimates of potential losses give an indication
of costs to be borne by creditors, including banks. Also, the data allows considering these variables
by sector of economic activity.
62. While the CCA adds a market perspective, the small sample and the illiquid of equity
markets for many companies may bias the results. The sample is considerably less
comprehensive than the analysis in Section D, as it considers only the 211 listed Italian non-financial
companies. One short-coming is that the companies in the sample are less reliant on bank lending
than the average, as is typical for listed companies. Also, several of the listed non-financial
companies are in ‘second-tier’ more illiquid market, where liquidity shortfalls, rather than market
assessment of firms’ fundamentals, may be driving equity prices.
63. The estimated default probabilities of Italian firms deteriorated in early 2011, reaching
their peak in July 2012, but have improved since then (Figure 10). During this period, equity
prices were negatively affected by market forecasts of negative earnings, mainly reflecting the weak
economic outlook and the sovereign crisis, which also reduced the liquidity of equity markets. The
estimated probability of default, as of end-May 2013, over a one-year horizon, ranges from about
¼ percent for firms in the 25
th
percentile, to more than 15 percent for firms in the 90
th
percentile.
The fraction of firms with estimated one-year-ahead probabilities of default larger than 5 percent
has moved from less than 2 percent in 2010 to more than 15 percent in 2012, but has now come
back to about 5 percent. The estimated default probabilities are, however, likely to be partly driven
by the deterioration in liquidity conditions during the sovereign crisis, which have currently abated.
Similar effects could also affect the Spanish equity markets, though it is notable that the median
probability of default of Italian firms (2 percent) is almost double that of Spanish listed companies,
and well above that of German, French, and U.K. listed firms.
64. Construction and real estate are the riskiest sectors. Firms in this sector have been
exposed to the economic downturn and weak investment, and have incurred large valuation losses.
Other capital-intensive sectors such as material and fabrication, machinery and equipment, and the
automobile sectors are also considered highly risky.
65. The estimated default probabilities suggest that losses for listed firms could be
substantial. As of May 2013, based on historical values of loss-given-default rates, losses could
reach 1 percent of GDP within one year, though the illiquid markets likely also bias this result
upward. The largest losses are expected in the automobile and utilities and electric industries, mostly
reflecting their importance among listed Italian firms.

ITALY
38 INTERNATIONAL MONETARY FUND
Figure 10. Italy: Contingent Claim Analysis for the Corporate Sector
Default probabilities increased starting in early 2011, in
particular for the weaker tail
The market value of assets subject to a 5 percent default
probability is about 5 percent
Expected default probabilities for the median percentile
are above levels in other large European economies
The construction and real estate sectors are considered
most risky
Losses could reach close to 1 percent of GDP, based on
historical loss-given-default rates
Expected losses are largest for the automotive and utilities
sector, reflecting their importance among listed companies
0
5
10
15
20
25
0
5
10
15
20
25
Nov-08
Sep-09
Jul-10
May-11
Mar-12
Jan-13
25th percentile
Median
75th percentile
90th percentile
Italian corporates: Expected Default Probabilities
0
10
20
30
40
50
60
70
80
90
100
0
1
2
3
4
5
Dec-08
Dec-09
Dec-10
Dec-11
Dec-12
May-13
One-Year Ahead Default Probability of Non Financial
Corporates in Italy (Cummulative market value of asset)
0.0
0.5
1.0
1.5
2.0
2.5
3.0
3.5
4.0
0.0
0.5
1.0
1.5
2.0
2.5
3.0
3.5
4.0
Nov-08
Sep-09
Jul-10
May-11
Mar-12
Jan-13
Italy
Spain
France
Germany
UK
Expected Default Probabilities for Corporates
(Median percentile)
0
1
2
3
4
5
6
7
Nov-08
Sep-09
Jul-10
May-11
Mar-12
Jan-13
Construction and Real Estate
Materials and fabrication
Mach and Equipment
Auto
Italy: Expected Default Probabilities by Industry
(Median percentile)
0.0
0.2
0.4
0.6
0.8
1.0
1.2
1.4
1.6
1.8
2.0
0.0
0.2
0.4
0.6
0.8
1.0
1.2
1.4
Historical LGD,
62%
Conservative
LGD, 80%
Optimistic LGD,
20%
Expected Losses from Non-Financial Corporate Defaults
(Average expected losses to creditors one year ahead,
by LGD rates, in percent of 2012 GDP)
Sources: Moody's MKMV and IMF Staff Calculations
0 1 2 3
AUTOMOTIVE
UTILITIES, ELECTRIC
PUBLISHING
AEROSPACE & DEFENSE
CONSTRUCTION
CONSTRUCTION MATERIALS
TELEPHONE
MACHINERY & EQUIPMENT
UTILITIES NEC
TRANSPORTATION
STEEL & METAL PRODUCTS
Other
Expected Losses from Corporate Defaults by Sector
(Billions of euros, historical LGD)

ITALY
INTERNATIONAL MONETARY FUND 39
CONCLUDING REMARKS
66. Italian banks’ credit risk is predominantly from exposures to the non-financial
corporate sector, while the risk from the household sector is limited. The financial situation of
non-financial corporations, in particular SMEs, is weak and vulnerable to downside shocks. For the
household sector, the credit risk is mitigated by the considerable net wealth, though severe shocks
to wealth—through the housing market—could increase bank losses also from the household
sector.
67. The analysis of the financial situation of firms and households can help understand the
large expected credit losses in the FSAP solvency stress test. In the stress test, credit losses are
expected to be a main driver of the decline in capital ratios, consistent with the fragility of the
corporate sector. The high share firms’ debt at risk is in line with the large credit losses in the
baseline, and in both analyzes, the impact on credit losses in the adverse scenarios are negative but
contained.

ITALY
40 INTERNATIONAL MONETARY FUND
References
Agenzia del Territorio (2013), “Andamento del Mercato Iimmobiliare nel IV Trimestre 2012 e Sintesi
Annua,” Nota Trimestrale, March 2013.
Albareto, Giorgio, and Paolo Finaldi Russo (2012), “Financial Fragility and Growth Prospects: Credit
Rationing During the Crisis,” Bank of Italy Occasional Paper No. 127.
Bank of Italy (2011), Financial Stability Report, No. 2, November 2011.
Bank of Italy (2012a), “Household Income and Wealth in 2010,” Supplements to the Statistical
Bulletin No.6, Sample Surveys, January 2012.
Bank of Italy (2012b), “The Wealth of Italian Households,” Supplements to the Statistical Bulletin
No.65, December 2012.
Bank of Italy (2012c), Financial Stability Report, No.3, April 2012.
Bank of Italy (2012d), “Business Outlook Survey of Industrial and Service Firms,” Supplement to the
Statistical Bulletin No. 56, Sample Surveys, November 2012.
Bank of Italy (2012), 2011 Annual Report, May 2012.
Bank of Italy (2012), Financial Stability Report, No. 4, November 2012.
Bank of Italy (2013a), “Sondaggio congiunturale sul mercato delle abitazioni in Italia, Aprile 2013,”
Supplement to the Statistical Bulletin, No. 24, Sample Surveys, March 2013.
Bank of Italy (2013b), “July 2013 Bank Lending Survey.”
Bank of Italy (2013), 2012 Annual Report, May 2013.
Bartiloro, Laura, Luisa Carpinelli, Paolo Finaldi Russo and Sabrina Pastorelli (2012), "Access to Credit
in Times of Crisis: Measures to Support Firms and Households," Bank of Italy
Occasional Papers No. 111.
Bartiloro, Laura and Cristina Rampazzi (2012), “Saving and Wealth of Italian Households During the
Recession”
Bofondi, Marcello and Tiziano Ropele (2011) Macroeconomic Determinants of Bad Loans: Evidence
from Italian Banks,” Bank of Italy Occasional Paper No. 89, March 2011.

ITALY
INTERNATIONAL MONETARY FUND 41
Bugamelli, Matteo, Luigi Cannari, Francesca Lotti, and Silvia Magri (2012), “The Innovation Gap of
Italy’s Production System: Roots and Possible Solutions,” Bank of Italy Occasional
Paper No. 121.
Bugamelli, Matteo, Riccardo Cristadoro and Giordano Zevi (2009), “The International Crisis and the
Italian Productive System: An Analysis of Firm-Level Data,” Bank of Italy Occasional
Paper.
Cerved Group (2012), “Cerved Group Risk Index: Insolvency Risk Among Italian Companies,” Number
5, November 2012.
Cerved Group (2013a), “Monitor of Bankruptcies, Insolvency Proceedings and Business Closures,”
February 2013.
Cerved Group (2013b),” Monitor of Company Payments and Non-Payment Protests,” Number 10,
March 2013.
European Central Bank (2013), The Eurosystem Household, Finance and Consumption Survey,
Results from the first wave”, Statistics Paper Series, No.2, April 2013.
European Commission (2011), “Small Business Act Factsheet 2010/11,” European Commission,
Enterprise and Industry.
IMF (2011),” United Kingdom—Vulnerabilities of Household and Corporate Balance Sheets and Risks
for the Financial Sector Technical Note,” July 2011.
IMF (2012), “Spain—Vulnerabilities of Private Sector Balance Sheets and Risks to the Financial
Sector,” Technical Note for the Financial Sector Assessment Program Update, May
2012.
Intrum Justitia (2012), European Payment Index 2012.
Magri, Silvia, and Raffaella Pico (2012), “L’Indebitamento delle Famiglie Iitaliane Dopo la Crisi del
2008,” Bank of Italy Occasional Paper No. 134, September 2012.
Merton, Robert (1974), “On the Pricing of Corporate Debt: The Risk Structure of Interest Rates,”
Journal of Finance, 29, 449-470.
Muzzicato, Salvatore, Roberto Sabbatini and Francesco Zollino (2008), “Prices of Residential Property
in Italy: Constructing a New Indicator,” Bank of Italy Occasional Papers No. 17, August
2008.

ITALY
42 INTERNATIONAL MONETARY FUND
Nobili, Andrea and Francesco Zollino (2012), “A Structural Model for the Housing and Credit Markets
in Italy,” Bank of Italy Working Papers, No. 887, 2012.
Rapaccciuolo, Ciro (2013), “Credit Crunch e Recessione: Il Circolo Vizioso Si Spezza Solo con una
Politica Economica che Rilancia la Crescita,” Nota dal Cervizio Studi di Confindustria
No. 2013-2, March 2013.
Zoli, Edda (2013), “Italian Sovereign Spreads: Their Determinants and Pass-through to Bank Funding
Costs and Lending Conditions,” IMF Working Paper No. 13/84, April 2013.
