
Evaluation of Traffic Signal
Displays for Protected/
Permissive Left-Turn Control
NATIONAL
COOPERATIVE
HIGHWAY
RESEARCH
PROGRAM
NCHRP
REPORT 493

TRANSPORTATION RESEARCH BOARD EXECUTIVE COMMITTEE 2003 (Membership as of March 2003)
OFFICERS
Chair: Genevieve Giuliano, Director and Professor, School of Policy, Planning, and Development, University of Southern California,
Los Angeles
Vice Chair: Michael S. Townes, Executive Director, Transportation District Commission of Hampton Roads, Hampton, VA
Executive Director: Robert E. Skinner, Jr., Transportation Research Board
MEMBERS
MICHAEL W. BEHRENS, Executive Director, Texas DOT
JOSEPH H. BOARDMAN, Commissioner, New York State DOT
SARAH C. CAMPBELL, President, TransManagement, Inc., Washington, DC
E. DEAN CARLSON, Secretary of Transportation, Kansas DOT
JOANNE F. CASEY, President, Intermodal Association of North America
JAMES C. CODELL III, Secretary, Kentucky Transportation Cabinet
JOHN L. CRAIG, Director, Nebraska Department of Roads
BERNARD S. GROSECLOSE, JR., President and CEO, South Carolina State Ports Authority
SUSAN HANSON, Landry University Professor of Geography, Graduate School of Geography, Clark University
LESTER A. HOEL, L. A. Lacy Distinguished Professor, Department of Civil Engineering, University of Virginia
HENRY L. HUNGERBEELER, Director, Missouri DOT
ADIB K. KANAFANI, Cahill Professor and Chairman, Department of Civil and Environmental Engineering, University of California
at Berkeley
RONALD F. KIRBY, Director of Transportation Planning, Metropolitan Washington Council of Governments
HERBERT S. LEVINSON, Principal, Herbert S. Levinson Transportation Consultant, New Haven, CT
MICHAEL D. MEYER, Professor, School of Civil and Environmental Engineering, Georgia Institute of Technology
JEFF P. MORALES, Director of Transportation, California DOT
KAM MOVASSAGHI, Secretary of Transportation, Louisiana Department of Transportation and Development
CAROL A. MURRAY, Commissioner, New Hampshire DOT
DAVID PLAVIN, President, Airports Council International, Washington, DC
JOHN REBENSDORF, Vice President, Network and Service Planning, Union Pacific Railroad Co., Omaha, NE
CATHERINE L. ROSS, Executive Director, Georgia Regional Transportation Agency
JOHN M. SAMUELS, Senior Vice President-Operations Planning & Support, Norfolk Southern Corporation, Norfolk, VA
PAUL P. SKOUTELAS, CEO, Port Authority of Allegheny County, Pittsburgh, PA
MARTIN WACHS, Director, Institute of Transportation Studies, University of California at Berkeley
MICHAEL W. WICKHAM, Chairman and CEO, Roadway Express, Inc., Akron, OH
MIKE ACOTT, President, National Asphalt Pavement Association (ex officio)
MARION C. BLAKEY, Federal Aviation Administrator, U.S.DOT (ex officio)
REBECCA M. BREWSTER, President and CEO, American Transportation Research Institute, Atlanta, GA (ex officio)
THOMAS H. COLLINS (Adm., U.S. Coast Guard), Commandant, U.S. Coast Guard (ex officio)
JENNIFER L. DORN, Federal Transit Administrator, U.S.DOT (ex officio)
ELLEN G. ENGLEMAN, Research and Special Programs Administrator, U.S.DOT (ex officio)
ROBERT B. FLOWERS (Lt. Gen., U.S. Army), Chief of Engineers and Commander, U.S. Army Corps of Engineers (ex officio)
HAROLD K. FORSEN, Foreign Secretary, National Academy of Engineering (ex officio)
EDWARD R. HAMBERGER, President and CEO, Association of American Railroads (ex officio)
JOHN C. HORSLEY, Executive Director, American Association of State Highway and Transportation Officials (ex officio)
MICHAEL P. JACKSON, Deputy Secretary of Transportation, U.S.DOT (ex officio)
ROGER L. KING, Chief Applications Technologist, National Aeronautics and Space Administration (ex officio)
ROBERT S. KIRK, Director, Office of Advanced Automotive Technologies, U.S. Department of Energy (ex officio)
RICK KOWALEWSKI, Acting Director, Bureau of Transportation Statistics, U.S.DOT (ex officio)
WILLIAM W. MILLAR, President, American Public Transportation Association (ex officio)
MARY E. PETERS, Federal Highway Administrator, U.S.DOT (ex officio)
SUZANNE RUDZINSKI, Director, Office of Transportation and Air Quality, U.S. Environmental Protection Agency (ex officio)
JEFFREY W. RUNGE, National Highway Traffic Safety Administrator, U.S.DOT (ex officio)
ALLAN RUTTER, Federal Railroad Administrator, U.S.DOT (ex officio)
ANNETTE M. SANDBERG, Deputy Administrator, Federal Motor Carrier Safety Administration, U.S.DOT (ex officio)
WILLIAM G. SCHUBERT, Maritime Administrator, U.S.DOT (ex officio)
NATIONAL COOPERATIVE HIGHWAY RESEARCH PROGRAM
Transportation Research Board Executive Committee Subcommittee for NCHRP
GENEVIEVE GIULIANO, University of Southern California,
Los Angeles (Chair)
E. DEAN CARLSON, Kansas DOT
LESTER A. HOEL, University of Virginia
JOHN C. HORSLEY, American Association of State Highway and
Transportation Officials
MARY E. PETERS, Federal Highway Administration
ROBERT E. SKINNER, JR., Transportation Research Board
MICHAEL S. TOWNES, Transportation District Commission
of Hampton Roads, Hampton, VA

TRANSPORTATION RESEARCH BOARD
WASHINGTON, D.C.
2003
www.TRB.org
NATIONAL COOPERATIVE HIGHWAY RESEARCH PROGRAM
NCHRP REPORT 493
Research Sponsored by the American Association of State Highway and Transportation Officials
in Cooperation with the Federal Highway Administration
SUBJECT AREAS
Highway Operations, Capacity, and Traffic Control
Evaluation of Traffic Signal
Displays for Protected/
Permissive Left-Turn Control
CHRIS L. B
REHMER
Kittelson & Associates, Inc.
Portland, OR
KENT C. KACIR
Siemens Energy & Automation, Inc.
Intelligent Transportation Systems
Portland, OR
DAVID A. NOYCE
University of Massachusetts
Amherst, MA
MICHAEL P. MANSER
Texas Transportation Institute
College Station, TX

NATIONAL COOPERATIVE HIGHWAY RESEARCH
PROGRAM
Systematic, well-designed research provides the most effective
approach to the solution of many problems facing highway
administrators and engineers. Often, highway problems are of local
interest and can best be studied by highway departments
individually or in cooperation with their state universities and
others. However, the accelerating growth of highway transportation
develops increasingly complex problems of wide interest to
highway authorities. These problems are best studied through a
coordinated program of cooperative research.
In recognition of these needs, the highway administrators of the
American Association of State Highway and Transportation
Officials initiated in 1962 an objective national highway research
program employing modern scientific techniques. This program is
supported on a continuing basis by funds from participating
member states of the Association and it receives the full cooperation
and support of the Federal Highway Administration, United States
Department of Transportation.
The Transportation Research Board of the National Academies
was requested by the Association to administer the research
program because of the Board’s recognized objectivity and
understanding of modern research practices. The Board is uniquely
suited for this purpose as it maintains an extensive committee
structure from which authorities on any highway transportation
subject may be drawn; it possesses avenues of communications and
cooperation with federal, state and local governmental agencies,
universities, and industry; its relationship to the National Research
Council is an insurance of objectivity; it maintains a full-time
research correlation staff of specialists in highway transportation
matters to bring the findings of research directly to those who are in
a position to use them.
The program is developed on the basis of research needs
identified by chief administrators of the highway and transportation
departments and by committees of AASHTO. Each year, specific
areas of research needs to be included in the program are proposed
to the National Research Council and the Board by the American
Association of State Highway and Transportation Officials.
Research projects to fulfill these needs are defined by the Board, and
qualified research agencies are selected from those that have
submitted proposals. Administration and surveillance of research
contracts are the responsibilities of the National Research Council
and the Transportation Research Board.
The needs for highway research are many, and the National
Cooperative Highway Research Program can make significant
contributions to the solution of highway transportation problems of
mutual concern to many responsible groups. The program,
however, is intended to complement rather than to substitute for or
duplicate other highway research programs.
Note: The Transportation Research Board of the National Academies, the
National Research Council, the Federal Highway Administration, the American
Association of State Highway and Transportation Officials, and the individual
states participating in the National Cooperative Highway Research Program do
not endorse products or manufacturers. Trade or manufacturers’ names appear
herein solely because they are considered essential to the object of this report.
Published reports of the
NATIONAL COOPERATIVE HIGHWAY RESEARCH PROGRAM
are available from:
Transportation Research Board
Business Office
500 Fifth Street, NW
Washington, DC 20001
and can be ordered through the Internet at:
http://www.national-academies.org/trb/bookstore
Printed in the United States of America
NCHRP REPORT 493
Project G3-54(2) FY 1995
ISSN 0077-5614
ISBN 0-309-08757-0
Library of Congress Control Number 2003107173
© 2003 Transportation Research Board
Price $31.00
NOTICE
The project that is the subject of this report was a part of the National Cooperative
Highway Research Program conducted by the Transportation Research Board with the
approval of the Governing Board of the National Research Council. Such approval
reflects the Governing Board’s judgment that the program concerned is of national
importance and appropriate with respect to both the purposes and resources of the
National Research Council.
The members of the technical committee selected to monitor this project and to review
this report were chosen for recognized scholarly competence and with due
consideration for the balance of disciplines appropriate to the project. The opinions and
conclusions expressed or implied are those of the research agency that performed the
research, and, while they have been accepted as appropriate by the technical committee,
they are not necessarily those of the Transportation Research Board, the National
Research Council, the American Association of State Highway and Transportation
Officials, or the Federal Highway Administration, U.S. Department of Transportation.
Each report is reviewed and accepted for publication by the technical committee
according to procedures established and monitored by the Transportation Research
Board Executive Committee and the Governing Board of the National Research
Council.

The National Academy of Sciences is a private, nonprofit, self-perpetuating society of distinguished schol-
ars engaged in scientific and engineering research, dedicated to the furtherance of science and technology
and to their use for the general welfare. On the authority of the charter granted to it by the Congress in
1863, the Academy has a mandate that requires it to advise the federal government on scientific and techni-
cal matters. Dr. Bruce M. Alberts is president of the National Academy of Sciences.
The National Academy of Engineering was established in 1964, under the charter of the National Acad-
emy of Sciences, as a parallel organization of outstanding engineers. It is autonomous in its administration
and in the selection of its members, sharing with the National Academy of Sciences the responsibility for
advising the federal government. The National Academy of Engineering also sponsors engineering programs
aimed at meeting national needs, encourages education and research, and recognizes the superior achieve-
ments of engineers. Dr. William A. Wulf is president of the National Academy of Engineering.
The Institute of Medicine was established in 1970 by the National Academy of Sciences to secure the
services of eminent members of appropriate professions in the examination of policy matters pertaining to
the health of the public. The Institute acts under the responsibility given to the National Academy of
Sciences by its congressional charter to be an adviser to the federal government and, on its own
initiative, to identify issues of medical care, research, and education. Dr. Harvey V. Fineberg is president
of the Institute of Medicine.
The National Research Council was organized by the National Academy of Sciences in 1916 to associate
the broad community of science and technology with the Academy’s purposes of furthering knowledge and
advising the federal government. Functioning in accordance with general policies determined by the Acad-
emy, the Council has become the principal operating agency of both the National Academy of Sciences and
the National Academy of Engineering in providing services to the government, the public, and the scientific
and engineering communities. The Council is administered jointly by both the Academies and the Institute
of Medicine. Dr. Bruce M. Alberts and Dr. William A. Wulf are chair and vice chair, respectively, of the
National Research Council.
The Transportation Research Board is a division of the National Research Council, which serves the
National Academy of Sciences and the National Academy of Engineering. The Board’s mission is to promote
innovation and progress in transportation by stimulating and conducting research, facilitating the
dissemination of information, and encouraging the implementation of research results. The Board’s varied
activities annually engage more than 4,000 engineers, scientists, and other transportation researchers and
practitioners from the public and private sectors and academia, all of whom contribute their expertise in the
public interest. The program is supported by state transportation departments, federal agencies including
the component administrations of the U.S. Department of Transportation, and other organizations and
individuals interested in the development of transportation. www.TRB.org
www.national-academies.org

COOPERATIVE RESEARCH PROGRAMS STAFF FOR NCHRP REPORT 493
ROBERT J. REILLY, Director, Cooperative Research Programs
CRAWFORD F. JENCKS, Manager, NCHRP
B. RAY DERR, Senior Program Officer
EILEEN P. DELANEY, Managing Editor
HILARY FREER, Associate Editor II
NCHRP PROJECT G3-54(2) PANEL
Field of Traffic—Area of Operations and Control
ROBERT E. MAKI, City of Surprise, AZ (Chair)
NADER A. AYOUB, Texas Highway Products Corporation, Round Rock, TX
GEORGE L. BUTZER, DLZ Corporation, Columbus, OH
RAJ S. GHAMAN, FHWA
JOSEPH E. HUMMER, North Carolina State University
LOUIS E. LIPP, Aurora, CO
TIMOTHY J. SZWEDO, New Jersey DOT
W. SCOTT WAINWRIGHT, FHWA
JOHN H. WARNER, DMJM + Harris Inc., Tucson, AZ
THOMAS GRANDA, FHWA Liaison Representative
RICHARD A. CUNARD, TRB Liaison Representative
AUTHOR ACKNOWLEDGMENTS
Kittelson & Associates, Inc. (KAI) performed the research proj-
ect reported herein under NCHRP Project 3-54 in association with
Siemens Gardner Transportation Systems, the University of Mass-
achusetts at Amherst (UMass), and the Texas Transportation Insti-
tute (TTI). The project was directed by Kent C. Kacir, formerly of
KAI, now of Siemens Gardner Transportation Systems, as the Prin-
cipal Investigator. Bill Kloos, also formally of KAI, now with the
City of Portland, Oregon, also provided project direction as the Co-
Principal Investigator. The other authors of this report are David A.
Noyce, former Assistant Professor of Civil Engineering at the Uni-
versity of Massachusetts at Amherst, now Assistant Professor of
Civil Engineering at University of Wisconsin-Madison, and
Christopher L. Brehmer of KAI.
The work performed at Kittelson & Associates, Inc., was con-
ducted under the direction of Kent Kacir. Wayne Kittelson, Senior
Principal at KAI, served as the Project Principal. Chris Brehmer of
KAI served as the Senior Engineer on the project. The work per-
formed at UMass was conducted under the supervision of Dr.
Noyce with the assistance of Michael A. Knodler Jr., Graduate
Research Assistant. The work performed at TTI was conducted
under the supervision of Roger J. Koppa, Associate Professor, with
the assistance of Michael P. Manser, Associate Research Scientist,
and Jacqueline Jenkins, Graduate Assistant Research. The authors
wish to recognize the invaluable contributions of the late Daniel B.
Fambro, Professor, TTI, who directed much of the study plan devel-
opment of this research project. His insights and commitment to the
project were significant to its success.
The project was guided by the panel members listed above, as
well as the following technical advisors:
Mr. Frank Dolan, Bergmann Associates
Mr. John Black, NAZTEC, Inc.
Mr. Ron Cameron, Gray Osborn
Mr. Tom Rathbun, Michigan DOT
Mr. Jim Poston, Meyer, Mohaddes Associates

This report recommends traffic signal displays for protected/permissive left-turn con-
trol. The recommendations are based on a comprehensive evaluation of the safety and
effectiveness of alternative traffic signal displays and phasing through laboratory and
field studies. These studies are summarized in the report and detailed information on
them is available on the enclosed CD-ROM, CRP-CD-35. Traffic signal designers and
operators will find the report informative, as will those interested in human factors
research. A key audience for the report will be those responsible for the Manual on Uni-
form Traffic Control Devices (MUTCD) because it is intended that the recommenda-
tions be considered for the next edition.
Protected/permissive left-turn (PPLT) traffic controls increase the left-turn capac-
ity and reduce delay at intersections by providing an exclusive turn phase for left turns
as well as a phase during which left turns can be made as opposing traffic will allow.
The protected left turn can either lead (or precede) or lag (or follow) the opposing
through signal phase. PPLT controls have been implemented in a variety of ways,
because the MUTCD provides limited guidance. At least six displays to indicate the per-
missive phase are known to exist in the United States (i.e., straight five-section head with
circular green, five-section cluster head with circular green, flashing circular red, flash-
ing circular yellow, flashing red arrow, and flashing yellow arrow). Variations also exist
in the phasing, signal displays, arrangement, signal placement, and use of supplemental
signs. There have been concerns that some of these variations may confuse motorists,
and validation of their relative operational and safety advantages was needed.
A key concern with PPLT control is the “yellow trap,” which occurs during the
change from permitted left turns in both directions to a lagging protected left turn in one
direction. The MUTCD requires that all circular signal indications on an approach to an
intersection display the same color. The left-turning driver whose permitted interval is
ending may try to sneak through the intersection on the yellow indication, not realizing
that the opposing through traffic still has a green indication. To avoid the yellow trap,
most agencies do not use leading/lagging PPLT. An innovation known as “Dallas Dis-
play” allows this operation without the yellow trap by operating the permissive left turns
simultaneously with the opposing through movement. Previous research has shown that
this operation reduces delay and improves safety, but is not easily implemented in all
situations.
Under NCHRP Projects 3-54 and 3-54(2), Kittelson & Associates and their sub-
contractors reviewed the literature and surveyed state and local transportation agencies
to determine what displays are used for PPLT and the prevalance of each. They then
assessed the safety and operational characteristics of each display qualitatively and ana-
lyzed crash data for a more quantitative assessment. Of particular interest was how the
different displays handled the yellow trap. Surveys of drivers using both static pho-
FOREWORD
By B. Ray Derr
Staff Officer
Transportation Research
Board

tographs and video were conducted to better understand how well the various displays
are comprehended. Following a meeting with the oversight panel to select the best dis-
plays for further study, driving simulator testing was used to gain a better understand-
ing of driver comprehension in a dynamic environment. Because the research conducted
pointed to the flashing yellow arrow as a promising display, pilot installations were made
in several cities to determine how well it operates in real-life conditions and to identify
implementation issues.
In the interest of brevity, this report presents only the highlights of a very compre-
hensive project. Working papers from the individual studies mentioned above are
included on the enclosed CD-ROM, CRP-CD-35.

1 SUMMARY
13 DEFINITIONS
15 CHAPTER 1 Introduction
Research Problem Statement, 15
PPLT Displays, 15
Lead-Lag Phasing with PPLT Control, 16
NCHRP 3-54 Research Objective, 17
Development of Research Plan, 19
Review of Key Work Plan Activities, 19
Identify Technical Advisors, 19
Agency Survey, 20
Photographic Driver Studies, 20
Field Traffic Operations Studies, 22
Crash Data Analysis, 22
Engineering Assessment, 22
Data Analysis and Report of Preliminary Findings, 22
Driver Confirmation Studies, 22
Field Implementation Studies, 22
Report Organization, 22
23 CHAPTER 2 Background
Modes of Left-Turn Control, 23
Current Standards for Protected/Permissive Control, 23
Signal Display Placement, 23
Operation, 26
Design, 27
Maintenance, 27
Uniformity, 27
Signal Phasing, 27
Alternative Displays Used in the United States, 29
Flashing Red Display, 29
Flashing Yellow Display, 30
Lead-Lag Displays, 30
Practices Outside the United States, 30
Canada, 31
Europe, 31
Australia, 32
The Left-Turn Problem, 32
Advantages of Protected/Permissive Left-Turn Phasing, 32
Disadvantages of the MUTCD Circular Green Display, 32
Summary, 33
34 CHAPTER 3 Research Activities and Findings
Agency Survey, 34
Objective, 34
Methodology, 34
Results, 34
Findings, 34
Photographic Driver Study, 35
Objective, 35
Methodology, 35
Results, 39
Findings, 40
Field Traffic Operations Study, 44
Objective, 44
Methodology, 44
Results, 44
Findings, 44
Field Traffic Conflict Study, 46
Objective, 46
Methodology, 46
Results, 48
Findings, 48
CONTENTS

Crash Data Analysis, 48
Objective, 48
Methodology, 48
Results, 49
Data Analysis, 49
Findings, 49
Driver Confirmation Study, 50
Objective, 51
Signal Displays Studied, 51
Simulator Environment, 51
Simulator Study Methodology, 51
Opposing Traffic, 53
Video-Based Static Evaluation, 55
Confirmation Study Sample Size, 55
Confirmation Study Findings, 55
Driving Simulator Findings, 56
Static Evaluation Findings, 57
Driving Simulator and Static Evaluation Comparison Findings, 57
Implications of Driver Comprehension Study Findings, 58
Field Implementation Study, 58
Objective, 58
Methodology, 58
Implementation Study Findings, 59
Conflict Analysis Findings, 62
Field Observations During Flashing Yellow Arrow Activation, 63
Post-Implementation Survey of Volunteer Agencies, 63
Agency Feedback, 69
Public Reaction, 69
Agencies Declining Participation, 69
Engineering Assessment, 69
Objective, 69
Methodology, 69
Findings, 74
75 CHAPTER 4 Discussion
Findings of the Confirmation Study, 75
Findings of the Field Implementation Study, 76
Operational Advantages, 76
Protected-Only Operation, 76
Protected-Permissive Operation, 76
Permissive-Protected Operation, 76
Permissive-Only Operation, 76
Other Considerations, 77
Supplemental Display Arrangements, 77
Right-Turn Overlap Display, 77
Universal Application, 78
A Need for Change, 79
Public Support for the Display, 80
Implications for Nonconforming PPLT Displays, 80
81 CHAPTER 5 Recommendations
Recommendation #1: Incorporate Flashing Yellow Arrow Display into the
MUTCD, 81
Recommendation #1A: Displays, 81
Recommendation #1B: Location, 81
Recommendation #1C: Supplemental Signs, 81
Recommendation #1D: Phasing, 81
Recommendation 2: Conduct Follow-Up Study, 82
Recommendation 3: Restrict Use of Flashing Red Indications, 82
83 REFERENCES

The NCHRP 3-54 Project is the culmination of extensive research efforts to identify
the “best” traffic signal display for protected/permissive left-turn (PPLT) control. The
research efforts respond to decades of practice wherein practitioners have experimented
with various displays and signal phasing schemes that either avoided—by design—
safety problems (e.g., yellow trap) or attempted to convey a clearer message to the
driver on the correct right-of-way (i.e., permissive movement).
Conducted over a 7-year period, the NCHRP 3-54 project is the most comprehen-
sive study of the PPLT display to date. The research team members surveyed current
practice, studied driver understanding of known permissive displays in the United
States, analyzed crash data, analyzed operational data, studied the implementation of
an experimental permissive display, and conducted a confirmation study using a full-
scale driving simulator to study driver understanding of the most promising permissive
displays.
Unlike previous research, the NCHRP 3-54 study focused heavily on human factors
and the techniques used to observe human reactions. Previous studies typically relied
on crash data to indicate how well drivers understood one display compared with other
displays or traffic control devices. However, crash data generally are unreliable for
assessing driver reaction to different displays because the level of detail of individual
crash reports typically does not identify the traffic signal control indications illumi-
nated at the time of the crash.
The NCHRP 3-54 study used modern techniques to present visual images or inter-
active situations whereby human reaction could be evaluated independently. Each of the
14 individual study tasks was successful in gathering pertinent data. The study task
results and findings led the research team to develop a concise set of recommendations.
Additionally, many findings from this study will lead to safer implementations of PPLT
control. For example, this study identified how well drivers understand multiple indica-
tions illuminated at the same time within the same display arrangement. How adjacent
signal display indication (e.g., through movement) affects drivers’ interpretations of the
left-turn display indications was also identified. Further, differences in drivers’ reactions
to flashing indications versus steady indications were explored and documented.
SUMMARY
EVALUATION OF TRAFFIC SIGNAL
DISPLAYS FOR PROTECTED/
PERMISSIVE LEFT-TURN CONTROL

RESEARCH PROBLEM STATEMENT
The increase in traffic volume on urban roadways has led engineers to develop inno-
vative means to control traffic. With an increase in traffic volume, a driver has fewer
available gaps in the opposing through traffic to execute a left-turn maneuver safely.
To alleviate this situation, signal phasing was designed to provide a protected left-turn
phase for part of the signal cycle. The resulting increase in safety came at the expense
of operational efficiency.
To regain some of the lost efficiency, traffic signals were designed to protect the left-
turn movement during a portion of the signal cycle and to allow a permissive movement
during the remainder of the signal cycle, resulting in left-turn control that is commonly
known as protected-permissive left-turn control, or simply PPLT control (or phasing).
If a protected movement is warranted, PPLT control has been shown to increase left-
turn capacity and reduce delay at intersections (as compared with protected-only con-
trol) by providing an exclusive turn phase for left turns as well as a permissive phase
during which left turns can be made if gaps in opposing through traffic will allow, all
within the same cycle. The left-turn phase (interval) can precede (lead) or follow (lag)
the through phase.
PPLT Displays
Over the years, PPLT control has been implemented in various ways. Variability
occurs in signal display arrangement, placement, and permissive indications. The vari-
ance in implementation has been consistent with the Manual on Uniform Traffic Con-
trol Devices (MUTCD) because, historically, the manual provided limited guidance. The
Federal Highway Administration (FHWA) recommends a five-section signal display.
Consistent with the FHWA’s recommendation, many states have adopted the five-
section cluster or “doghouse” signal display arrangement as their standard. The five-
section cluster is located in a shared overhead position, between the through and turn-
ing lanes, providing a green arrow indication for the protected phase and a circular green
indication for the permissive phase. The circular green indication is shared with the
through movement.
Several transportation agencies within the United States have designed and imple-
mented unique PPLT phasing displays with the intent to convey a clearer message of
drivers’ left-turn control. Several unique displays have been implemented as experi-
mental traffic control devices with approval by FHWA. To date, at least five variations
of the permissive indications are in use in the United States: the MUTCD standard cir-
cular green indication; the flashing circular red indication, the flashing circular yellow
indication, the flashing red arrow indication, and the flashing yellow arrow indication.
Lead-Lag Phasing with PPLT Control
The left-turn phase can lead or lag the opposing through movement. Traffic engi-
neers often would like to increase operational efficiency on roadways by using lead-
lag signal phasing, but cannot safely do so if PPLT control is used. The MUTCD does
not preclude the use of lead-lag left turns with PPLT control; however, doing so will
create what is known as the “yellow trap.” The yellow trap condition essentially leads
the left-turning driver into the intersection when it is unsafe to do so, even though the
signal displays are correct. During the signal change from permissive movements in
both directions to a lagging protected movement in one direction, a yellow trap is pre-
sented to the left-turning driver whose permissive left-turn phase is terminating. The
2

3
yellow trap occurs when a signal changes from the permissive left-turn intervals in both
directions to a lagging protected movement in only one direction. A driver attempting
to make a left turn on the permissive circular green indication becomes trapped in the
intersection when the circular green indication turns yellow for the change interval (for
the through traffic). The left-turn driver who is attempting to clear the intersection sees
the adjacent through lanes receive the circular yellow indication for their change inter-
val. The left-turner mistakenly believes that the opposing traffic also has the yellow
change interval and so makes the left turn, in effect becoming a “sneaker.” The yellow
trap occurs because the opposing traffic does not, in fact, receive a yellow change inter-
val, but instead has a circular green indication in the through lanes and a protected left-
turn arrow indication. The potential for serious conflict occurs between the sneaker
vehicle and the opposing, non-stopping, through traffic.
To avoid the hazardous yellow trap situation, traffic engineers use either simultane-
ous leading (lead-lead) or lagging (lag-lag) left-turn phasing. With lead-lead (protected-
permissive) left-turn phasing, both left-turn phase indications are initially illuminated
together. With most modern signal controllers, if the left-turn demand diminishes on one
side, the opposing through-lane traffic can proceed concurrently with the remaining left-
turn phase movement traffic. Conversely, for lag-lag (permissive-protected) left-turn
phasing, both left-turn phase indications may not be illuminated together; however both
left-turn phases must also terminate together. The lag-lag left-turn phasing results in a
potential decrease in capacity and increase in delay. For both the protected-permissive
(lead-lead) and permissive-protected (lag-lag) signal phasing operation, the permissive
left-turn circular green indication can be illuminated for the through movement and the
left-turn movement. The driver making the left-turn movement may proceed if there is
an acceptable gap in the opposing traffic stream. The lead-lead and lag-lag signal phas-
ing operation has been in use for many years.
Since approximately the mid-1980s, some traffic engineers have implemented an
innovative signal phasing operation known as the “Dallas Display.” The Dallas Display
permits phase overlaps and was designed to eliminate the potentially unsafe yellow trap
situation by allowing a continued permissive left-turn during the opposite approach lead-
ing and lagging protected left-turn phase. The Dallas Display advances traffic engineers’
ability to maximize signal coordination by allowing protected-permissive and lead-lag
operation within the same signal cycle.
NEED FOR RESEARCH
Traffic engineers have long cited the advantages of implementing PPLT control
(e.g., improved operational efficiency and traffic progression, reduced vehicle delay,
reduced fuel consumption, and reduced air pollution). The disadvantage, some argue,
is that PPLT control can be deployed in such a way that the yellow trap is created, and
there is potential for driver confusion. Nevertheless, many practicing agencies have
found the advantages to outweigh the potential disadvantages. Additionally, several
agencies in the United States have deployed various types of signal phasing techniques
to avoid the yellow trap and/or resolve the potential driver confusion problem. Over the
past two decades (in some limited cases, three decades), some agencies have been
granted approval from FHWA to implement unique displays, or display arrangements,
on an experimental basis. The premise for these implementations was the potential for
a safer or more efficient traffic control device. Examples of these unique displays are
the flashing red and flashing yellow circular and arrow indications.
The National Committee on Uniform Traffic Control Devices (NCUTCD), which
provides guidance to the FHWA on the MUTCD, has expressed concern that the vari-

ety of PPLT controls currently in use may confuse drivers traveling throughout the
United States and has long proposed a comprehensive national study that would vali-
date the operational advantages and safety aspects of the various PPLT control devices
and signal arrangements.
NCHRP 3-54 RESEARCH OBJECTIVE
The objective of the NCHRP 3-54 project was to evaluate the safety and effective-
ness of different signal displays and phasing for PPLT control through laboratory and
field studies. Study activities were designed to gather, analyze, and interpret data that
would serve as the basis for recommending a uniform display for PPLT control. The
study considered all current applications of PPLT control in the United States, includ-
ing arrangement, indications, placement, phasing sequence, and safety considerations
(e.g., the yellow trap).
NCHRP Project 3-54 did not develop any guidelines, warrants, or recommendations
for the use of PPLT control. The underlying assumption was that the traffic engineer
had decided that PPLT control is an appropriate left-turn treatment. The goal of this
research project was to identify the “best” or most appropriate signal display, includ-
ing arrangement and indications.
RESEARCH PLAN
NCHRP Project 3-54 consisted of individual study tasks as identified in Figure S-1. In
October of 1999, the research team and project panel met to review the study PPLT dis-
plays and to determine which displays showed the most potential. As part of the meet-
ing, several decisions were made, including the decision to reduce the number of dis-
plays to those with the most potential for further study. Additionally, the project panel
directed the research team to conduct a thorough evaluation of one particular display
through field implementation. Brief descriptions of the key study activities follow.
(Chapter 3 provides detailed information on each study task.)
Identify Technical Advisors
Before beginning the formal study effort, potential members of a Technical Advi-
sory Group were sought. The Technical Advisory Group was to consist of at least five
knowledgeable professionals who would provide the project panel with first-hand
experience and expertise in the evaluation of PPLT signal displays. Members of the
advisory group were to be well-respected and experienced traffic engineers knowl-
edgeable about the PPLT issue. The research team also sought regular interaction with
the Signals Technical Committee of the NCUTCD to provide a regular flow of infor-
mation to the full committee.
Agency Survey
To assess the current state of the practice, the research team conducted an extensive
literature review to investigate the state of the art in PPLT display. Both published and
unpublished literature was evaluated, including literature from international sources.
4

5
This task also included the administration of a survey of transportation agencies to
solicit information regarding the number and type of left-turn traffic control devices in
use across the United States. The objective of the agency survey was to identify and
quantify the different types of PPLT displays in use. The survey was administered to
transportation professionals at the state and city levels who were directly involved with
PPLT design and installations. Data on PPLT installations in all 50 states and parts of
Canada were obtained.
Agency
Survey
Photographic
Driver Studies
Field Traffic
Operations
Studies
Field Traffic
Conflict
Studies
Crash Data
Analysis
Report
of
Preliminary
Findings
Driver
Confirmation
Studies
Field
Implementation
Studies
Identify
Displays for
Further
Study
Refine
Research
Techniqu
es
2nd Interim
Report
and
2nd Panel
Meetin
g
Final Report
Findings and
Recommendations
Present
Recommendations to
NCUT
CD
Engineering
Assessmen
t
Identify
Technical
Advisor
s
Provide Input
Provide Input
Refine
Recommendatio
ns
Provide Input
Figure S-1. Final work plan.

The significant findings of the agency survey are as follows:
•
Nearly 110,000 traffic signals in the United States (29% of all signals in the United
States) have at least one approach with PPLT operation.
•
In 34 of the 50 states, the five-section cluster PPLT display is used most, with 41%
of the states reporting the use of only one PPLT as the state standard. Specifically,
63% of all PPLT displays are the five-section cluster display.
•
A total of 40% of the responding agencies always use the PPLT display for one of
the two required through movement displays, and another 37% sometimes do.
•
A total of 50% of the reporting agencies use supplemental displays (e.g., additional
pole-mounted display on the far left side of the intersection); therefore the left-turn
display can be visible to the through motorist.
•
The circular green PPLT indication was used in 165 of the 168 reporting agencies.
Other indications used were flashing circular red, flashing red arrow, flashing cir-
cular yellow, and the flashing yellow arrow.
Photographic Driver Studies
Photographic driver studies evaluated driver understanding of the circular green,
flashing yellow arrow, flashing circular yellow, flashing red arrow, and flashing circu-
lar red permissive displays in association with different arrangements, placements, and
traffic/lane configurations. Computer-generated PPLT signal displays on static back-
ground photographs were used to represent the dynamic aspects of the PPLT displays.
More than 300 drivers participated in each of eight geographic locations around the
United States. All study participants were licensed drivers.
The following findings were key to refining the research plan and developing rec-
ommendations:
•
Simultaneous illumination of two display indications significantly reduced driver
understanding.
•
The circular green indication had the lowest level of driver comprehension (nearly
50%) of all PPLT displays studied.
•
The through indication had little effect on driver comprehension of the left-turn
PPLT indication.
•
Age had a significant effect on driver comprehension. In at least one PPLT scenario,
drivers over the age of 65 only responded correctly 20% of the time. Older drivers
responded more correctly to the flashing circular red and yellow indications.
•
Flashing indications were understood better than steady indications, as evidenced
by overall time to respond to the indication in question.
•
The circular indication was better understood when compared with arrow indi-
cations.
•
The red indications were understood better than the other displays studied.
Field Traffic Operations Studies
The operations studies consisted of quantifying the capacity and delay associated
with various PPLT displays by analyzing saturation flow rates, lost times, response
times, and follow-up headways. The traffic studies were completed in the same eight
geographic locations in which the photographic driver studies were conducted to pro-
vide additional insights into driver behavior related to alternative PPLT displays. As
part of this effort, the research team worked with local traffic engineers to identify rep-
6

7
resentative sites with PPLT displays and to then gather crash, traffic, geometry, and
other relevant data for each site. More than 8 hr of conflict data per intersection were
collected at three intersections within each geographic study area.
This work activity identified that study location was a significant factor, but that
PPLT signal display arrangement and phasing was not a significant factor affecting the
saturation flow rate. Additionally, this work activity showed that signal phasing sig-
nificantly influenced the start-up lost time, but that PPLT signal display arrangement
or study location did not.
Field Traffic Conflict Studies
The traffic conflict studies focused solely on the left-turn movement. Conflict stud-
ies were completed in the same eight geographic locations as the photographic driver
and field traffic operations studies. The purpose of these studies was to quantify left-
turn conflict rates and event rates for different PPLT signal displays and indications.
The conflict studies involved the collection and analysis of 8 hr of conflict data on a
typical weekday at 24 study intersections. At each intersection, traffic conflicts were
observed and classified into one of six types.
The conflict analysis study task showed that, overall, traffic conflicts were low for
all PPLT displays evaluated, and few left-turn conflicts were associated with the PPLT
display.
Crash Data Analysis
The research team conducted a review of crash data to determine and compare left-
turn crash rates associated with various PPLT displays. In addition, selected compo-
nents of a crash database created in 1988 as part of an FHWA study were examined.
The crash analysis showed that, based on (1) the average crash rate per year and
(2) average crashes per 100 left-turning vehicles, the four-section flashing circular yel-
low indication used in Seattle, Washington, experienced the fewest number of crashes
per year. The analysis of the average crash rate by intersection indicated that the flash-
ing red arrow used in Cupertino, California, had the lowest average crash rate. The cir-
cular green indication had the highest average statistic in three of the four evaluations
studied and reported above.
Ultimately, the crash data analysis did not identify any safety problems among the
PPLT displays studied. The data showed that the flashing circular yellow indication
typically had the lowest (best) statistic and the circular green indication (MUTCD stan-
dard) had the highest (worst) statistic.
Engineering Assessment
The engineering assessment sought to identify the objective and subjective infor-
mation needed to evaluate the proposed displays. To assist the assessment, an evalua-
tion matrix was developed. The evaluation matrix included considerations addressing
the key issues of safety, operations, implementation, human factors, and versatility and
was updated as each study activity was completed.
The engineering assessment was conducted continuously over the course of the
study. At the conclusion of the research tasks discussed above, the research team made
the following assessments:
•
The flashing yellow arrow and the circular green indication can be used in both
exclusive and shared PPLT signal displays, whereas the flashing yellow circular

indication and flashing red arrow indications can only be used in an exclusive
PPLT display.
•
The flashing yellow arrow indication and circular green indication present the best
displays for further study.
Report of Preliminary Findings
Using the data collected to date, the research team prepared a comprehensive
analysis of the results obtained from the agency evaluation, photographic driver stud-
ies, conflict studies, and crash studies. This information was presented to the mem-
bers of the project panel, who in turn reviewed the findings and ultimately reduced
the number of PPLT displays for future consideration. In addition to selecting a sub-
set of promising PPLT displays to be studied further, the project panel provided
direction to complete the confirmation study and to conduct a field implementation
study.
Driver Confirmation Studies
Before the research team could make a firm recommendation on a “best” display to
be used as a national standard, the research team conducted a confirmation study
whereby human subjects (drivers) were tested in a full-scale simulator. The confirma-
tion study evaluated 12 PPLT signal display scenarios, each with a different permis-
sive indication, display face, location, and through movement indication. Each of the
PPLT signal displays included only the circular green indication and/or flashing yel-
low permissive indications. Two separate confirmation studies were conducted—one
at the University of Massachusetts and one at the Texas A&M University. The two con-
firmation studies were created to be near identical, within the practical budget limits of
the study.
The driver confirmation study demonstrated the following:
•
There was a high level of comprehension with no variation between the different
PPLT displays tested.
•
The data showed no statistical difference in driver comprehension when the data
were cross-analyzed by permissive indication, display arrangement, through indi-
cation, and/or location of the display.
•
Males and females had statistically equivalent levels of comprehension.
•
Drivers over the age of 45 had significantly fewer fail-critical responses than those
45 and younger.
•
Drivers who drive between 10,000 and 20,000 miles per year had significantly
more responses that were correct and significantly fewer fail-critical responses
than those who drove fewer than 10,000 miles per year.
•
The level of education that the drivers possessed did not have a significant effect
on comprehension.
•
PPLT displays with the four-section vertical display face resulted in a significantly
greater number of correct responses compared with the five-section vertical and
five-section cluster display arrangements.
•
The location of the PPLT signal display did not result in statistically significant
differences.
8

9
Field Implementation Studies
An experimental flashing yellow arrow display was field tested because it had shown
promise from both safety and driver comprehension perspectives in previous task activ-
ities and had ranked high in the Engineering Assessment. Volunteer agencies were
sought from across the United States to install and operate the experimental flashing
yellow arrow display. In conjunction with the use of the experimental display (which
required permission from FHWA to operate), “before” and “after” studies were com-
pleted at each intersection where the flashing yellow arrow display was installed and
at nearby control sites. These “before” and “after” studies allowed the research team to
quantify the impact of the changeover from the MUCTD circular green indication to
the flashing yellow arrow indication.
The flashing yellow arrow indication was implemented in the following six U.S.
jurisdictions:
•
Montgomery County, Maryland;
•
Tucson, Arizona;
•
Woodburn, Oregon;
•
Jackson County, Oregon;
•
Beaverton, Oregon; and
•
Broward County, Florida.
With the exception of the PPLT display implemented in Tucson, Arizona, all PPLT
displays were implemented with few problems and remain operational as of the date of
this report. As explained in greater detail in Chapter 3, the PPLT display implemented
in Tucson, Arizona, was removed from operation because of safety concerns expressed
by city management. For each of the 15 intersections under study, only the PPLT dis-
play was changed from the MUTCD standard circular green indication to the flashing
yellow arrow display.
Findings of the field implementation study include the following:
•
Review of before and after field conflict data showed no differences attributable
to the change in the PPLT display.
•
Before and after observations of follow-up headway and flow rate data for the
study and control intersections demonstrated that the change in PPLT display had
negligible impact.
•
The implementation study demonstrated that the flashing yellow arrow display can
be field implemented (albeit with minor issues) using existing traffic control hard-
ware and software. Technical implementation issues identified during the field
implementation process could be dealt with appropriately in any future develop-
ments of hardware and/or software, should the flashing yellow arrow display become
a standard.
•
Traffic engineers who participated in the implementation study (and those who
declined participation) generally expressed their approval of the flashing yellow
arrow display because of the following:
– It provides an exclusive signal display for the left-turn control.
– The indication was flashing, which attracted more attention.
– The indication provided enhanced operation control.
•
Public comments from citizens who experienced the flashing yellow arrow display
in the field were generally positive. Several implementing agencies reported

receiving e-mails or written letters from the motoring public with most, if not all,
in support of the flashing yellow arrow display.
Engineering Assessment (Update)
At the completion of the driver confirmation studies and the field implementation
studies, the research team reviewed the engineering assessment findings to reflect cur-
rent data. The final findings are reported below:
•
The flashing yellow arrow display was shown to offer the highest level of safety.
•
The circular green indication using the Dallas Display and the flashing yellow
arrow display was shown to rank “best” in the category of operations.
•
The circular green indication was shown to rank “best” as being implementable.
•
The flashing yellow arrow display was shown to be the “best” in the category of
human factors.
•
The flashing yellow arrow display was shown to have the most versatile charac-
teristics and the circular green indication was the least versatile.
RECOMMENDATIONS
Based on the results and findings of the various research activities, the research team
and the project panel identified the following three recommendations:
Recommendation 1: The flashing yellow arrow display should be included in the
MUTCD as an allowable alternative display to the circular green indication when used
in PPLT control/operation.
Displays. The four-section, all-arrow display face should be the only display allowed.
The only display that justifies an exception to this recommendation is the three-section
display face with bi-modal lens. The three-section display face with bi-modal lens should
also be allowed given that it operates the same as does the four-section display face.
Only one indication shall be illuminated at any time.
Location. The flashing yellow arrow operation shall only be used in an exclusive
signal arrangement. It is recommended, but not required, that the left-turn signal face
be placed over the left turn lane.
Supplemental Signs. Supplemental signing is not warranted with flashing yellow
arrow display. Use of supplemental signing is optional.
Phasing. When used for left-turn treatments, the flashing yellow arrow display shall
be tied to the opposing through green indication/display.
Recommendation 2: Conduct Follow-Up Study
It is recommended that a follow-up study to this project be conducted. The follow-
up study should be conducted after there has been ample time for an implementation
trial period by agencies currently participating in the field implementation as well as
other potential additional agencies that may choose to implement based on the findings
of this research effort. Sufficient time should also be allowed such that before and after
crash data can be acquired at the study intersections and corresponding control sites.
10

11
The follow-up study should
•
Analyze all available crash data for the experimental flashing yellow arrow dis-
plays implemented as part of this study;
•
Identify whether the flashing yellow arrow display should become the only dis-
play allowed in the MUTCD for PPLT operation;
•
Identify whether, if the flashing yellow arrow is selected to become the only dis-
play allowed for PPLT, the MUTCD should also be changed to add the following
prohibition: “For Permissive Only Mode operation, a signal face displaying a cir-
cular green indication shall not be located directly over or in line with a left-turn
lane”; and
•
Identify an implementation plan.
Recommendation 3: Restrict Use of Flashing Red Indications
The use of the flashing red indication should only be implemented at locations where
an engineering study has identified that all drivers must come to a complete stop before
proceeding on the permissive interval.
PROJECT FINDINGS SUMMARY
Figure S-2 illustrates the flow of work activities and the relevant findings that lead
to the study recommendations.

Agency Survey:
PPLT operation has widespread application across the U.S.
The five-section cluster is used in most PPLT displays.
The PPLT display is used often as a shared display.
Many agencies use supplemental displays to augment the main
display for the left-turn movement.
Driver Survey:
Driver understanding is reduced when two indications are illuminated
simultaneously.
The circular green indication used for the permissive left-turn
movement had the lowest level of understanding.
The circular flashing red indication had the highest level of
understanding.
Flashing indication is understood better than steady indications.
The circular indication is better understood than the arrow indication.
Field Traffic Operations Study:
The PPLT indication does not have an effect on saturation flow rate
and start up lost time.
Follow-up headways for the circular flashing red indications were a
factor of local signal operation (lead versus lag).
Conflict Study:
Few left-turn conflicts were associated with the PPLT display.
Many left-turn events associated with the PPLT display were related
to the simultaneous illumination of the circular red indication and the
protected green arrow indication.
The PPLT display has little effect on left-turn conflicts.
Crash Analysis:
The flashing circular yellow indication typically had the lowest (best)
crash statistic and the circular green indication had the highest
(worst) statistic.
Engineering Assessment:
The flashing yellow arrow and the circular green indication can be
used in both exclusive and shared PPLT signal displays, whereas the
flashing yellow ball and flashing red arrow indications can only be
used in an exclusive PPLT display.
The flashing yellow arrow indication and circular green ball indication
present the best displays for further study.
Total Population of PPLT Displays
Analysis of Findings
First Interim Report
First Panel Meeting
Identify Displays/Indications for more study
(Circular green and flashing yellow arrow indications)
Driver Confirmation Study:
High level of comprehension among all
PPLT displays studied.
No significant difference among permissive
indication, display arrangement, or location of
display.
Older drivers and drivers who drive more
have fewer fail-critical responses.
PPLT displays with the four-section vertical
face had a significantly greater number of
correct responses.
Field Implementation:
Conflict data showed no statistical differences
between circular green and flashing yellow
arrow indication.
In general, traffic engineers express their
approval of the flashing yellow arrow due to
greater operational control without a
degradation of safety.
Public reaction to the flashing yellow arrow
display has been mostly positive.
Analysis of Findings
Identify Recommendations
Second Interim Report
Second Panel Meeting
Engineering Assessment:
The flashing yellow arrow indication presented
better qualities in the categories of safety,
operations, human factors, and versatility.
The circular green indication cannot be
applied universally.
There are inherent safety problems associated
with the circular green indication.
The red indications can violate the meaning of
the stop condition.
The flashing yellow ball cannot be applied to
left- and right-turn treatment
s.
Refine Recommendations
Final Report
Recommendations:
The flashing yellow arrow display should be
included in the MUTCD as an allowable
alternative display to the circular green
indication when used in PPLT control/
operation.
Conduct a follow-up study to analyze 'after'
crash data related to study intersections.
Restrict use of flashing red indications.
Study of Many Displays
Focus on a Few Displays/ Refined Study Focus Recommendations
Figure S-2. Work flow of activities and findings that led to the development of recommendations.

13
DEFINITIONS
Exclusive Display: A display on a single approach for con-
trolling only the left-turn movement.
FHWA: Federal Highway Administration
Horizontal Arrangement: A particular arrangement of sig-
nal indications in a horizontal position. This term is the same
as the horizontal display face in the MUTCD.
Interval: A discrete portion of the signal cycle during which
the signal indications remain unchanged.
Lagging Left Turn: A phase sequence in which a protected
left-turn phase follows the opposing through-movement phase.
Lead Left Turn: A phase sequence in which a protected left-
turn phase precedes the opposing through-movement phase.
Lead-Lead Left Turn: Also called dual leading left turns.
Indicates a phase sequence in which two left-turn movements
from opposite directions of a roadway are both served by
leading protected phases. When both streets at the intersec-
tion are serviced in this manner, the operation is referred to
as quad left-turn phasing.
Lead-Lag Left Turn: A phase sequence in which one left-
turn movement is served by a leading protected phase and the
other left-turn movement (from the opposite direction of the
same street) is served by a lagging protected phase.
Lag-Lag Left Turn: A phase sequence in which two left-
turn movements from opposite directions of a street are both
served by lagging protected phases.
MUTCD: Manual on Uniform Traffic Control Devices
NCUTCD: National Committee on Uniform Traffic Control
Devices
Permissive Mode: A mode of traffic control signal opera-
tion in which left or right turns may be made on a circular
green signal indication after yielding to oncoming traffic and
pedestrians.
Phase: A part of the traffic signal time cycle allocated to any
combination of traffic movements receiving right-of-way
simultaneously during one or more intervals.
Phase Sequence: The order in which a controller cycles
through all phases.
The following list of definitions is intended to clarify the
manner in which they are used in this report. Some of the
terms listed may not appear in this document. The research
team has attempted to use terminology consistently through-
out this final report and in the various working papers docu-
menting the detailed progression of the project; however,
there has been a change in direction within the industry and,
in particular, within the National Committee on Uniform Traf-
fic Control Devices regarding terminology.
Change Interval: The yellow change interval follows the
green interval to warn traffic of an impending change in the
right-of-way assignment. The yellow change interval may be
followed by a red clearance interval.
Cluster Arrangement: Cluster arrangement refers to a par-
ticular arrangement of signal indications where four of them
are clustered in the form of a square, and the fifth signal indi-
cation (circular red) is mounted directly on the top, either
centered or off to one side.
Cycle Length: See signal cycle.
Dallas Display: Also called Dallas Phasing. Also call Per-
missive Lead-Lag. A unique signal operation designed to
eliminate the “yellow trap” situation by allowing a continued
permissive left-turn during the opposite approach lagging
protected left-turn phase. In order to accomplish this, a left-
turn circular green indication is displayed, in an exclusive
display, during the adjacent through movement green and
yellow indications and continues to be displayed during the
lagging protected left-turn green arrow and through circular
green (or straight green arrow) indications for the opposite
approach. The continuing circular green left-turn indication is
terminated by a circular yellow indication that is simultane-
ously displayed with the opposing through movement yellow
clearance. This type of operation requires the use of visibility-
limited (e.g., louvered) signal faces to shield the circular green
and yellow indications intended for the left-turn lane traffic
from the adjacent through traffic.
Display: The signal face as a unit (assembly) that conveys
the message to the driver. The display consists of the indi-
vidual section, regardless of configuration. Historically, this
term has been used in reference to the signal head.
Display Face: The part of a signal head provided for con-
trolling traffic in a single direction. Same as “signal face” and
“display.”
Doghouse: See cluster arrangement.

14
Preemption: The term used when the normal signal sequence
at an intersection is interrupted or altered in deference to a spe-
cial situation such as the passage of a train, a bridge opening,
or the granting of the right-of-way to an emergency vehicle.
Protected Mode: A mode of traffic control signal operation
in which left or right turns may be made when a left or right
green arrow signal indication is displayed.
Protected/Permissive Mode: A mode of traffic signal oper-
ation in which the left-turn movement is presented during
both the protected mode and the permissive mode on an
approach during the same signal cycle.
In this report, the term protected/permissive does not
necessarily imply a particular phasing order (i.e., protected/
permissive or permissive/protected). In practice, the phase
sequence is important.
Protected Permissive Left-Turn Display: Also referenced
as PPLT display. This term is used to reference specifically
or generically the indication or display used in conjunction
with protected permissive left-turn control.
Protected Permissive Left-Turn Control: Also referenced
as PPLT control or PPLT operation. This term is used to
identify the signal operation that uses protected permissive
signal phasing.
Shared Display: A signal display is considered to be a shared
display when it constitutes one of the two required displays
for the through movement and provides the left-turn move-
ment indication.
Signal Cycle: The total time required to complete either one
sequence of signal phases at a signalized intersection with
pretimed operation or a sequence of those phases with traffic
demand at a signalized intersection with traffic-actuated
operation.
Signal Display Arrangement: The signal arrangement as
a unit (assembly) that conveys the message to the driver.
The display arrangement consists of the individual sections,
regardless of configuration. Historically, this term has been
used in reference to the signal head.
Signal Face: The part of a signal head provided for con-
trolling traffic in a single direction. This is the same as a dis-
play face.
Signal Head: Historically, this term has referred to an assem-
bly containing one or more signal faces that may be desig-
nated as one-way, two-way, and so forth. See also signal dis-
play or signal display arrangement.
Signal Indications: The illumination of a signal lens, such
as the circular green indication.
Signal Lens: The part of a signal section through which light
from the light source or reflectors passes. In doing so, light is
directed into a prescribed pattern, is filtered to a prescribed
color, and, where necessary, is provided with a prescribed
symbol or message.
Signal Section: The assembly of a housing, lens, and light
source with necessary components and supporting hardware
providing one signal indication.
Signal System: Two or more traffic control signals operat-
ing in coordination.
Vertical Arrangement: A particular arrangement of signal
indications in a vertical position. This term is the same as the
vertical display face in the MUTCD.
Yellow Trap: A situation where the driver sees a yellow
indication for a change interval in the left-turn signal face
and the adjacent through signal face and assumes that the
opposing traffic also receives the yellow change interval.

15
CHAPTER 1
INTRODUCTION
This report is the culmination of extensive research efforts
to identify the “best” traffic signal display for protected/
permissive left-turn (PPLT) control. The research efforts
respond to decades of practice whereby practitioners have
experimented with various displays and signal phasing schemes
that either avoided—by design—safety problems (e.g., yellow
trap) or attempted to convey a clearer message to the driver
on the correct right-of-way (i.e., permissive movement).
Conducted over a 7-year period, the NCHRP 3-54 study is
the most comprehensive study of the PPLT display to date.
In the course of the study, the research team has surveyed
current practice, studied driver understanding of known per-
missive displays in the United States, analyzed crash data,
analyzed operational data, studied the implementation of an
experimental permissive display, and conducted a confirma-
tion study using a full-scale driving simulator to study driver
understanding of the most promising permissive displays.
Unlike previous research, the NCHRP 3-54 study focused
on human factors and the techniques used to observe human
reactions. Previous studies typically relied on crash data to
indicate how well drivers understood one display compared
with other displays or traffic control devices. However, crash
data are generally unreliable for assessing driver reaction to
different displays because the level of detail of individual
crash reports typically does not identify the traffic signal con-
trol indications illuminated at the time of the crash.
The NCHRP 3-54 study used modern techniques to pre-
sent visual images and interactive situations whereby human
reaction could be independently evaluated. As detailed in
Chapter 3 of this report, 14 individual study tasks were com-
pleted, and each produced useful data. Through analysis and
review of the study task results and findings, the research
team was able to develop a concise set of recommendations.
Additionally, many findings that have come from this study
will lead to safer implementations of PPLT control. For exam-
ple, this study has identified how well drivers understand
multiple indications illuminated at the same time within the
same display arrangement. The effects of adjacent signal dis-
play indication (e.g., through movement) as they relate to
driver interpretation of the left-turn display indications were
also identified. Further, differences in driver reactions to flash-
ing indications versus steady indications were explored and
documented.
As previously mentioned, this report is a culmination of
many tasks conducted over several years. Each major study
task was documented by a working paper. The reader is
encouraged to review the various working papers contained
as appendixes to this report and provided on the accompany-
ing CD-ROM for the task design, results, and findings.
The remainder of this chapter discusses the research prob-
lem statement, the need for more research, the objective of
the research project, the development of the research plan,
and an overview of study tasks completed in conjunction
with the overall study.
RESEARCH PROBLEM STATEMENT
The increase in traffic volume on urban roadways has led
engineers to develop innovative means to control traffic.
With an increase in traffic volume, a driver has fewer avail-
able gaps in the opposing through traffic to execute a left-
turn maneuver safely. To alleviate this situation, signal phas-
ing was designed to provide a protected left-turn phase for a
portion of the signal cycle. The resulting increase in safety
came at the expense of operational efficiency.
To regain some of the lost efficiency, traffic signals were
designed to protect the left-turn movement during a portion of
the signal cycle and allow a permissive movement during the
remainder of the signal cycle, thereby resulting in left-turn
control that is commonly known as protected-permissive left-
turn control, or simply PPLT control (or phasing). If a pro-
tected movement is warranted, PPLT control has been shown
to increase left-turn capacity and reduce delay at intersec-
tions (as compared with protected-only control) by providing
an exclusive turn phase for left turns as well as a permissive
phase during which left turns can be made if gaps in oppos-
ing through traffic will allow, all within the same cycle. The
left-turn phase (interval) can precede (lead) or follow (lag)
the through phase.
PPLT Displays
Over the years, PPLT control has been implemented in
various ways. Variability occurs in signal display arrange-

16
ment, placement, and permissive indications. The variance in
implementation has been consistent with the Manual on Uni-
form Traffic Control Devices (MUTCD) because the manual
historically provided limited guidance (1). The FHWA rec-
ommends a five-section signal display (2). Consistent with
the FHWA’s recommendation, many states have adopted the
five-section cluster or “doghouse” signal display arrange-
ment as their standard. The five-section cluster is located in
a shared overhead position typically between the through and
turning lanes, providing a green arrow indication for the pro-
tected phase and a circular green indication for the permis-
sive phase. The circular green indication is shared with the
through movement.
Several transportation agencies in theUnited States have
designed and implemented unique PPLT phasing displays so
as to convey more clearly drivers’ left-turn control. Several
unique displays have been implemented as experimental traf-
fic control devices with approval by FHWA. To date, at least
five variations of the permissive indications are in use in the
United States: the MUTCD standard circular green indica-
tion; the flashing circular red indication, the flashing circular
yellow indication, the flashing red arrow indication, and the
flashing yellow arrow indication. Figure 1-1 illustrates the
various permissive display indication and display arrange-
ments that have been or are in use in the United States. Chap-
ter 3 of this report provides a detailed discussion of the PPLT
displays shown in Figure 1-1.
Lead-Lag Phasing with PPLT Control
The left-turn phase can lead or lag the opposing through
movement. Traffic engineers often want to increase opera-
tional efficiency on roadways by using lead-lag signal phas-
ing but cannot safely do so if PPLT control is used. The
MUTCD does not preclude the use of lead-lag left turns with
PPLT control; however, doing so will create what is known
as the “yellow trap.” The yellow trap condition essentially
leads the left-turning driver into the intersection when it may
not be safe to do so, even though the signal displays are cor-
rect. During the signal change from permissive movements
in both directions to a lagging protected movement in one
direction, a yellow trap is presented to the left-turning driver
whose permissive left-turn phase is terminating. Figure 1-2
illustrates how the yellow trap occurs.
As shown in Figure 1-2, the yellow trap occurs when a sig-
nal changes from the permissive left-turn intervals in both
directions to a lagging protected movement in only one direc-
tion. A driver attempting to make a left turn on the permissive
circular green indication becomes trapped in the intersection
when the circular green indication turns yellow for the change
interval (for the through traffic). The left-turn driver who is
attempting to clear the intersection sees the adjacent through
lanes receive the circular yellow indication for their change
interval. The left-turning driver mistakenly believes that the
opposing traffic also has the yellow change interval and so
makes the left turn, in effect becoming a sneaker. The yellow
trap occurs because the opposing traffic does not, in fact,
receive a yellow change interval but instead has a circular
green indication in the through lanes and a protected left-turn
arrow indication. The potential for serious conflict occurs
between the sneaker and the opposing, non-stopping, through
traffic.
To avoid the hazardous yellow trap situation, traffic
engineers use either simultaneous leading (lead-lead) or lag-
ging (lag-lag) left-turn phasing. With lead-lead (protected-
permissive) left-turn phasing, both left-turn phase indications
are initially illuminated together. With most modern signal
controllers, if the left-turn demand diminishes on one side, the
opposing through-lane traffic can proceed concurrently with
the remaining left-turn phase movement traffic. With lag-lag
(permissive-protected) left-turn phasing, both left-turn phase
indications may not be illuminated simultaneously; however
both left-turn phases must always terminate simultaneously.
The lag-lag left-turn phasing results in a potential decrease
in capacity and increase in delay. For both the protected-
permissive (lead-lead) and permissive-protected (lag-lag) sig-
nal phasing operation, the permissive left-turn circular green
indication can be illuminated for the through movement and
the left-turn movement. The driver making the left-turn move-
ment may proceed if there is an acceptable gap in the oppos-
ing traffic stream. The lead-lead and lag-lag signal phasing
operation has been in use for many years.
Since approximately the mid-1980s, some traffic engineers
have implemented an innovative signal phasing operation
known as the “Dallas Display.” The Dallas Display permits
phase overlaps and was designed to eliminate the potentially
unsafe yellow trap situation by allowing a continued permis-
sive left-turn during the opposite approach leading and lag-
ging protected left-turn phase. The Dallas Display advances
traffic engineers’ ability to maximize signal coordination by
allowing protected-permissive and lead-lag operation within
the same signal cycle. Research has shown that the Dallas
Display is operationally efficient and minimizes delay while
maintaining safety (3).
Traffic engineers have long cited the advantages of imple-
menting PPLT control, such as improved operational effi-
ciency and traffic progression, reduced vehicle delay, reduced
fuel consumption, and reduced air pollution. The disadvan-
tage, some argue, is that PPLT control can be deployed in such
a way that the yellow trap is created, thereby causing potential
driver confusion. Nevertheless, many practicing agencies have
found the advantages to outweigh the disadvantages. Addi-
tionally, several agencies in the United States have deployed
various types of signal phasing techniques to avoid the yel-
low trap, resolve the potential driver confusion problem, or
both. Over the past two decades (in some limited cases, three
decades), some agencies have been granted approval from
FHWA to implement unique displays or display arrangements

17
on an experimental basis. The premise for these implementa-
tions has been the potential for a safer or more efficient traffic
control device.
The National Committee on Uniform Traffic Control
Devices (NCUTCD), which provides guidance to FHWA on
the MUTCD, has expressed concern that the variety of PPLT
controls in use may confuse drivers traveling throughout the
United States and has long proposed a comprehensive national
study that would validate the operational advantages and
safety aspects of the various PPLT control devices and sig-
nal arrangements.
NCHRP 3-54 RESEARCH OBJECTIVE
The objective of NCHRP Project 3-54 was to evaluate
the safety and effectiveness of different signal displays and
phasing for PPLT control through laboratory and field stud-
Maryland
Seattle, WA
Washington
State
Delaware
Cupertino, CA
Michigan
Area
Used
Area
Used
Lens Color
and
Arrangement
Lens Color
and
Arrangement
* Green or Yellow
Bi-modal Lens
*
Left-Turn Indication Left-Turn Indication
Protected
Mode
Protected
Mode
Permitted
Mode
Permitted
Mode
Sparks, NVReno, NV
LEFT LEFT LEFTLEFT
OR
i:\projfile\2036\cdrfiles\figures\Figure_1-1.cdr
Indicates Flashing
Figure 1-1. Variations in PPLT displays.

18
ies. Study activities were designed to gather, analyze, and
interpret data that would serve as the basis for recommend-
ing a uniform display for PPLT control. The study con-
sidered all current applications of PPLT control in the
United States, including arrangement, indications, place-
ment, phasing sequence, and safety considerations (e.g., the
yellow trap).
NCHRP Project 3-54 did not develop any guidelines,
warrants, or recommendations for the use of PPLT control.
The underlying assumption was that the traffic engineer had
decided that PPLT control is an appropriate left-turn treat-
ment. The goal of this research project was to identify the
“best” or most appropriate signal display, including arrange-
ment and indications.
1
Opposing
Through Signal
Opposing
Left-Turn Display Not Shown
All Red
Protected Left Turn
Clearance Interval
(End Protected Left-Turn)
Permissive Phase
Change Interval
(Yellow Trap)
Opposing Through
Phase Indication Still Green
2
3
4
5
6
i:\projfile\2036\cdrfiles\figures\Figure_1-2.cdr
Figure 1-2. Yellow trap with MUTCD 5-section PPLT display.

19
DEVELOPMENT OF RESEARCH PLAN
The NCHRP 3-54 study was conducted in two distinct
phases. Phase 1 was exploratory in nature and focused on the
development of the study plan to be carried out in Phase 2.
Phase 1 study activities included the following:
•
Review relevant literature,
•
Define appropriate study factors,
•
Identify and recommend study approach, and
•
Document results.
The research team developed the Phase 2 work plan using the
systems engineering approach. The work plan started with a
study of all known PPLT displays and would methodically
reduce the number PPLT displays being studied to a select few
that would receive more concentrated study. The basic ele-
ments of the proposed work plan were (1) a survey of current
PPLT use across the United States and at several international
locations, (2) a study of driver understanding of known PPLT
displays, (3) the use of computer simulation on a select num-
ber of PPLT displays, and (4) field studies. Figure 1-3 depicts
how the work plan in Phase 2 would systematically narrow
the number of displays being studied to a point where the
“best” display would be identified.
Building on the systems engineering approach, a revised
Phase 2 work plan was developed as shown in Figure 1-4.
The project’s initial study activities were designed to help
refine the number of displays studied in the following study
tasks. Subsequent activities focused on a select number of
displays that were studied with laboratory and field techniques
that confirmed earlier findings and answered questions that
would ultimately lead to recommendations.
Throughout the study, the research team solicited advice
and comments from a team of technical advisors. These advi-
sors were selected from the traffic engineering community
because of their hands-on experience with various applica-
tions of PPLT control and unique permissive displays.
Because many questions of a practical application could
not be answered with a laboratory test, the research team
designed an Engineering Assessment study task. This Engi-
neering Assessment task augmented the findings of other
study tasks, including many field implementation issues. The
Engineering Assessment task started in the initial stages of
the project and continued through to the final stages of the
project. In its final form, the NCHRP 3-54 study consisted of
individual study tasks as identified in Figure 1-5. In October
of 1999, the research team and project panel met to review
the study PPLT displays and to determine which displays
showed the most potential. As part of the meeting, several
decisions were made, including the decision to reduce the
number of displays to those with the most potential for fur-
ther study. Additionally, the project panel directed the
research team to conduct a thorough evaluation of one par-
ticular display through field implementation.
REVIEW OF KEY WORK PLAN ACTIVITIES
As previously stated, the NCHRP 3-54 study was structured
into individual study tasks that consisted of data collection
activities, reporting, and meetings with the project panel. Key
individual study activities are discussed in Chapter 3 of this
report. The greatest amount of detail related to each of the key
study activities is found in the project working papers, which
are appendixes to this report and are provided on the accom-
panying CD-ROM. Below are brief descriptions of nine key
study activities; the other five tasks were panel meetings and
documentation.
Identify Technical Advisors
Before beginning the formal study effort, potential mem-
bers of a Technical Advisory Group were sought. The Tech-
nical Advisory Group was to consist of at least five knowl-
edgeable professionals who would provide the project panel
with first-hand experience and expertise in the evaluation of
PPLT signal displays. Members of the advisory group were
to be well-respected, experienced, traffic engineers knowl-
edgeable about the PPLT issue. The research team also had
Uniform
Display
Field Studies
Computer
Simulation
Focus Groups and
Expert Panels
Study of Driver Understanding
drive through, conflict
analysis, and accident studies
Figure 1-3. Conceptual work flow of the original Phase 2
work plan.

20
regular interaction with the Signals Technical Committee of
the NCUTCD in order to provide a regular flow of informa-
tion to the full committee.
Agency Survey
To assess the current state of the practice, the research team
conducted an extensive literature review and administered a
survey of transportation agencies. The literature review iden-
tified the current state of the art in PPLT displays and included
published and unpublished literature (including material from
international sources).
The agency survey solicited information on the number and
type of left-turn traffic control devices in use across the United
States. The objective of the agency survey was to identify and
quantify the different types of PPLT displays in use. The sur-
vey was administered to transportation professionals at the
state and city levels who were directly involved with PPLT
design and installations. Data on PPLT installations in all 50
states and parts of Canada were obtained.
Photographic Driver Studies
Photographic driver studies evaluated drivers’ under-
standing of the circular green, flashing yellow arrow, flash-
ing circular yellow, flashing red arrow, and flashing circular
red permissive displays in association with different arrange-
ments, placements, and traffic/lane configurations. Computer-
generated PPLT signal displays on static background pho-
tographs were used to represent the dynamic aspects of the
Assessment
Engineering
Analysis
Crash Data
Driver
Observation
Studies
Draft Video
Driver
Surveys
Agency
Driver
Studies
Survey
Photographic
Identify
Technical
Advisors
Provide Input
Provide Input
Provide Input
1st Interim
Report
1st Panel
and
Meeting
Driver
Video
Survey
Identify Displays
for Further
Study
NCUTCD
Recommendations to
Submit
Final
Report
Recommendations
Refine
Meeting
2nd Panel
and
Report
2nd Interim
Recommendations
Findings and
Figure 1-4. Proposed Phase 2 work plan.

21
Assessment
Engineering
Analysis
Crash Data
Studies
Field Traffic
Conflict
Studies
Operations
Field Traffic
Agency
Driver
Studies
Survey
Photographic
Identify
Technical
Advisors
Provide Input
Shading indicates
modification to work plan
(refer to Figure 1-4
for comparison)
Provide Input
Provide Input
1st Interim
Report
1st Panel
and
Meeting
Refine
Techniques
Research
Identify Displays
for Further
Study
NCUTCD
Recommendations to
Submit
Final
Report
Recommendations
Refine
Meeting
2nd Panel
and
Report
2nd Interim
Studies
Driver
Confirmation
Recommendations
Findings and
Studies
Field
Implementation
Figure 1-5. Final Phase 2 work plan.

22
PPLT displays. Over 300 drivers participated in each of eight
geographic locations around the United States for a total of
more than 2,400 drivers. All study participants were licensed
drivers.
Field Traffic Operations Studies
Another major focus involved completion of (1) several
traffic operations studies to determine the effects of the PPLT
signal display types and (2) a traffic conflict study to deter-
mine the safety effects of each of the PPLT displays. The
observation studies included quantifying the capacity and
delay associated with various PPLT displays by analyzing
saturation flow rates, lost times, response times, and follow-
up headways. Field traffic conflict studies focused solely on
the left-turn movement.
The traffic observation studies were conducted in the same
eight geographic locations as the photographic driver studies
in order to provide additional insights into driver behavior
related to alternative PPLT displays. As part of this effort, the
research team worked with local traffic engineers to identify
representative sites with PPLT displays and to then gather
crash, traffic, geometry, and other relevant data for each site.
More than 8 hours of conflict data per intersection were col-
lected at three intersections within each geographic study
area for a total of 192 hours.
Crash Data Analysis
The research team conducted a review of crash data to
determine and compare left-turn crash rates associated with
various PPLT displays. In addition, selected components of
a crash database created in 1988 as part of a FHWA study
were examined.
Engineering Assessment
The Engineering Assessment sought to identify the objec-
tive and subjective information needed to evaluate the pro-
posed displays. To assist in the assessment, an evaluation
matrix was developed. The evaluation matrix included con-
siderations addressing safety, operations, implementation,
human factors, and versatility and was updated as each study
activity was completed.
Data Analysis and Report of Preliminary
Findings
Using the data collected from the agency evaluation, pho-
tographic driver studies, conflict studies, and crash studies,
the research team prepared a comprehensive analysis of the
results obtained to that point in the research project. This
information was presented to the project panel, which in turn
reviewed the findings and ultimately reduced the number of
PPLT displays for future consideration. In addition to select-
ing a subset of promising PPLT displays to be further stud-
ied, the panel provided direction to complete the confirma-
tion study and to conduct a field implementation study.
Driver Confirmation Studies
Using full-scale dynamic driving simulators located at the
University of Massachusetts (UMass) and the Texas Trans-
portation Institute (TTI), the research team developed a vir-
tual driving environment to further test driver understanding
of select PPLT displays and associated behavior. Study par-
ticipants were required to navigate a virtual world containing
various signal displays, different arrangements and locations,
and opposing traffic, with the intent of evaluating driver per-
formance at pre-selected intersections controlled by PPLT
displays in an actual driving environment. The researchers at
UMass and TTI were tasked with each testing 200 drivers of
various demographic backgrounds for a total of 400 drivers.
Field Implementation Studies
Field implementation of an experimental flashing yellow
arrow display was conducted to field test a display that had
shown promise in safety and driver comprehension in previous
task activities and had ranked high in the Engineering Assess-
ment. Volunteer agencies were sought from across the United
States to install and operate the experimental flashing yellow
arrow display. In conjunction with use of the experimental
display (which required permission from FHWA to operate),
“before” and “after” studies were completed at each inter-
section where the flashing yellow arrow display was installed
and at nearby control sites. These “before” and “after” stud-
ies allowed the research team to quantify the impact of the
changeover from the MUCTD circular green indication to
the flashing yellow arrow indication.
REPORT ORGANIZATION
Chapter 2 of this report provides background material
and sets the stage for discussion of the study methodology,
findings, and recommendations as presented throughout the
remainder of the report. Chapter 2 presents a detailed descrip-
tion of PPLT control, key issues related to this type of signal
phasing, and a description of current practices to mitigate
some of the known disadvantages of using PPLT.
Chapter 3 summarizes the results of the individual project
work elements, including the findings derived from each of
the major project activities and the implications those findings
had on the direction of the project. Chapter 4 provides a more
in-depth discussion of findings surrounding one of the exper-
imental PPLT displays, the flashing yellow arrow. Chapter 5
presents the final recommendations derived from the research
project.

23
CHAPTER 2
BACKGROUND
This chapter provides a general overview of left-turn con-
trol, advantages and disadvantages of PPLT signal phasing,
current standards for PPLT control, and some of the previ-
ously documented variations in PPLT displays used around
the world. Much of the material presented herein was gath-
ered through a review of published literature and current
industry practice.
For decades, traffic engineers have relied on the MUTCD
(1) to provide guidance regarding the installation and opera-
tion of all types of traffic control devices, including left-turn
signal display and phasing. To be effective, the MUTCD must
be specific enough to ensure uniformity, while allowing lat-
itude to adapt the traffic control device to specific needs. For
left-turn control, the MUTCD addresses the design and appli-
cation of traffic control signs, pavement markings, traffic
signal installations, and traffic islands. The MUTCD identi-
fies several possible combinations of left-turn and through-
movement signal lens arrangements (or displays) and provides
some general guidelines for locating signal heads and advi-
sory signing. The choice of left-turn control depends on sev-
eral factors that must be evaluated by the traffic engineer using
design guidelines and engineering judgment.
MODES OF LEFT-TURN CONTROL
The MUTCD defines four modes of left-turn control: per-
missive, protected, protected/permissive, and variable left-
turn mode as described below.
Permissive left-turn control typically is used at locations
without left-turn signals. Under permissive operation, the
MUTCD does not require an exclusive signal indication or
signal face for left turns. Consequently, one signal display
can be used for all traffic movements on a single approach
and the circular green indication permits left turns to be made
after drivers yield to oncoming traffic and pedestrians.
Protected left-turn control is used where there is an exclu-
sive display for left-turn movements. With this type of traf-
fic control, left turns may be made only when a green arrow
indication is displayed.
Under PPLT control, left-turning traffic is protected from
oncoming traffic during the protected interval, during which
the green arrow indication is displayed. In another part of the
cycle, during which the circular green indication is typically
displayed, left-turn movements may be made after drivers
yield to oncoming traffic and pedestrians.
Variable left-turn mode describes a situation in which the
operating mode changes among the protected-only mode, the
permissive-only mode, and/or the protected/permissive mode
during different periods of the day.
Combinations of signal arrangements used with the vari-
ous left-turn controls cited above (as defined in the MUTCD)
are illustrated in Figure 2-1. The application of these displays
depends on the availability of an exclusive left-turn lane, the
traffic signal phasing, and the mode of signal operation.
CURRENT STANDARDS FOR
PROTECTED/PERMISSIVE CONTROL
The MUTCD is the mandated source for determining traf-
fic control devices for left-turn maneuvers (1). It is not a legal
requirement to install any device identified in the MUTCD;
however, if a traffic control device is installed, it must com-
ply with the provisions of the MUTCD subject to mandatory,
advisory, or permissive requirements.
The PPLT mode of operation, as currently defined in the
MUTCD, has a protected, left-turn interval indicated by a
green arrow during part of the signal cycle and a permissive
left-turn interval indicated by a circular green indication dur-
ing another part of the cycle where the left turn must yield to
opposing traffic.
To ensure that these basic requirements are met, the
MUTCD identifies five considerations for the employment
of traffic signal displays and other traffic control devices:
placement, operation, design, maintenance, and uniformity.
These considerations are discussed below.
Signal Display Placement
To understand the placement needs of a PPLT display, it
is first important to understand how general traffic signal
placement is governed and how left-turn signal displays are
located for permissive mode only and protected mode only.

24
General Traffic Signal Display Placement Criteria
A traffic signal display should be placed to ensure that it is
within the driver’s cone of vision so that it will unmistakably
command attention. The display should also be positioned in
relation to the point, object, or situation to which it applies to
help convey the proper meaning. In addition to being suitably
legible, the display must be located so that a driver traveling
at normal speed has adequate time to observe the display,
comprehend its meaning, and make the proper response.
As illustrated in Figure 2-2, the MUTCD indicates that the
traffic signal display should be located not less than 40 ft nor
more than 150 ft beyond the stop line. The signal “shall be
located between two lines intersecting with the center of the
approach lanes at the stop line, one making an angle of approx-
imately 20 degrees to the right of the approach extended and
the other making an angle of approximately 20 degrees to the
left of the center of the approach extended” (1). Previous
research has suggested that this 20-deg “cone of vision” be
reduced to 10 deg to improve conspicuity (4).
Beyond the basic horizontal signal face location require-
ments shown in Figure 2-2, specific placement criteria are
identified in the MUTCD; these criteria depend on the type
of left-turn control. These requirements are described below.
a.
b. c. d.
e.
f. g. h.
i. j. k. l.
m. n. o. p.
q. r. s. t. u.
Figure 2-1. MUTCD arrangements of traffic signal displays.

25
12 m
(40 ft)
Location of signal heads within these areas:
200 mm (8 in) or 300 mm (12 in)
signal lenses
300 mm (12 in) signal lenses, unless
a near-side signal face is used
Minimum distance of signal faces from stop line.*
*
**
**
***
***
Maximum distance from stop line for 200 mm (8 in)
signal faces, unless a near-side signal face is used.
Maximum distance from stop line for 200 mm (8 in)
signal faces when near-side supplemental signal
face is used, and maximum distance from stop line
for 300 mm (12 in) signal faces, unless a near-side
signal face is used.
35 m
(120 ft)
45 m
(150 ft)
3m (10 ft)
CENTER
OF APPROACH
X/2
X
20 20
Figure 2-2. MUTCD criteria for horizontal location of signal faces.

26
Left-Turn Signal Display Placement Criteria
for Permissive Mode Only
The MUTCD does not require an exclusive signal display
for the left-turn movement if the left turn is going to be made
in the permissive mode only. In this mode, the left-turning
vehicle is directed by the through-traffic signal indication (a
circular green) that is terminated with a circular yellow fol-
lowed by a circular red.
Left-Turn Signal Display Placement Criteria
for Protected Mode Only
The protected-only left-turn signal phase requires an exclu-
sive signal face to control the left-turn movement. This sig-
nal face is normally located in line with the center of the left-
turn lane, either overhead on the far side of the intersection
or ground mounted in the median. The MUTCD does not
require dual signal indications and 8 ft of horizontal separa-
tion between signal faces for protected-only left-turn signal
indications and the adjacent signal indications; however, the
MUTCD does require that a signal face mounted on a span
wire or mast arm be located as near as practical to the driver’s
normal view line (1).
Left-Turn Signal Display Placement Criteria
for PPLT Mode
Because a PPLT display controls both the permissive left-
turn movement and the protected left-turn movement, there
is flexibility in the location of the display. Figure 2-3 illus-
trates two potential overhead signal display placement alter-
natives allowed by the MUTCD for PPLT control. In addi-
tion to the alternatives shown in Figure 2-3, post-mounted
median and farside display placements are also used. The
placement of a given PPLT display ultimately depends on
the type of display used. In some instances, PPLT control is
implemented without the benefit of having an exclusive left-
turn lane.
Operation
The traffic signal display should be operated in conjunc-
tion with the appropriate traffic control devices and equip-
ment to meet traffic requirements at a given location (1). Fur-
ther, “the display must be placed and operated in a uniform
and consistent manner to ensure that drivers can respond
properly to the display, given their previous exposure to sim-
ilar traffic control situations.” (1)
Center
of Lane
Optional
Placement
Lane
Line
Figure 2-3. Overhead PPLT display placement options.

27
Design
Features such as size, contrast, colors, shape, composition,
and lighting or reflectorization should be combined to draw
attention to the display (4). The shape, size, and colors of the
display should produce a clear meaning. Legibility and size
should be combined with placement to permit adequate
response time. The display’s uniformity, size, legibility, and
comprehensibility should command respect from drivers
when the display is encountered.
The PPLT signal display must provide for both protected
left turns and permissive left turns during the signal cycle.
The most commonly used signal displays are the five-section
cluster, vertical, or horizontal, shown in Figures 2-1 -o, -m,
and -n, respectively. As shown in Figures 1-1 and 2-4, the
signal indications for PPLT mode left turns are provided by
either a shared signal face or an exclusive signal face used
only by left-turn traffic.
Shared PPLT Display Arrangement
In a shared application, the signal face indicating a pro-
tected left-turn movement is one of the two required signal
faces for the approach and is usually not directly over the
left-turn lane. It displays a left-turn green arrow signal indi-
cation and the adjacent through movement indication (circu-
lar red or circular green) simultaneously. The MUTCD fur-
ther requires that the signal faces for the through traffic on
the opposing approach simultaneously display circular red
signal indications. During the permissive left-turn movement,
all signal faces on the approach display circular green signal
indications. At any point in the signal cycle, all signal faces
on the approach are required to simultaneously display the
same color of circular indications to both through and left-
turn road users (variations are allowed when louvered signals
are used as explained later in this chapter) (1).
Exclusive PPLT Display Arrangement
In applications using an exclusive signal display arrange-
ment for the left-turn movement, a separate signal face, usu-
ally located directly over the left-turn lane, is provided in addi-
tion to the minimum two required signal faces for the through
movements. The separate face is required to simultaneously
display a left-turn green arrow signal indication and a circular
red signal indication for the protected phase of the signal cycle.
A circular green indication is displayed for the permissive
interval. The MUTCD further requires that the signal faces for
the through traffic on the opposing approach simultaneously
display circular red signal indications. During the permissive
left-turn movement, the left-turn signal face displays a circu-
lar green signal indication (1).
Maintenance
Traffic signal displays should be well maintained to ensure
that legibility is retained and the display is visible. The display
should be removed if it is no longer needed (1). Clean, legible,
and properly mounted displays, in good working condition,
command the respect of every travel mode at the intersection.
In addition to regular maintenance, traffic displays should be
adjusted regularly to address current conditions. The fact that
a display is in good working order should not be a basis for
deferring needed replacement or change. Conversely, poor
maintenance can destroy the value of a group of traffic signal
displays by minimizing the respect commanded by individual
displays.
Uniformity
Uniformity means treating similar traffic situations in the
same way. Uniform traffic signal displays aid the road user by
simplifying recognition and understanding (1). Uniform dis-
plays also help road users, police and enforcement personnel,
and traffic courts interpret appropriate driver behavior. Uni-
form traffic control displays are also economical because con-
sistent manufacturing, installation, maintenance, and admin-
istration processes can be used.
Signal Phasing
Various signal phase sequences can be used for the PPLT
mode such as leading or lagging protected turn intervals, with
adjacent through traffic either moving concurrently with the
left turn or stopped. The MUTCD requires that all same-color
circular indications in all signal faces on an approach be simul-
taneously illuminated when PPLT operation is used with one
exception: when using an exclusive left-turn signal face with
circular green and circular yellow signal indications that are
visibility limited from the adjacent through movement, the
left-turn signal is not required to simultaneously display the
same color of circular indication as the faces for the adjacent
through movement. Further, in this visibility limited arrange-
ment, a circular green signal indication for the permissive left-
turn movement can be displayed while the signal faces for the
adjacent through movement display a circular red indication
and the opposing left-turn displays a left-turn green arrow indi-
cation for a protected left-turn movement (1). This arrange-
ment, commonly referred to as the Dallas Display (or Dallas
Phasing), is used to eliminate the previously acknowledged
yellow trap. Figure 2-5 illustrates a typical Dallas Display.
In situations where an exclusive left-turn signal face is
provided and the left-turn signal face does not simultane-
ously display the same color circular indication as the adja-
cent through movement, the MUTCD requires that a combi-
nation of a LEFT TURN SIGNAL sign (R10-11) and a LEFT

28
MUTCD
4-Section Horizontal
MUTCD
5-Section Horizontal
MUTCD
5-Section Vertical
Used in Texas, Nebraska,
and others
Used in Texas, Nebraska,
and others
Used in Texas and
most Western States
Area
Used
Lens Color
and
Arrangement
Left-Turn Indication
Protected
Mode
Permitted
Mode
Variation
of 5-Section Cluster
MUTCD
Typical
5-Section Cluste
r
Figure 2-4. Variations in PPLT displays.
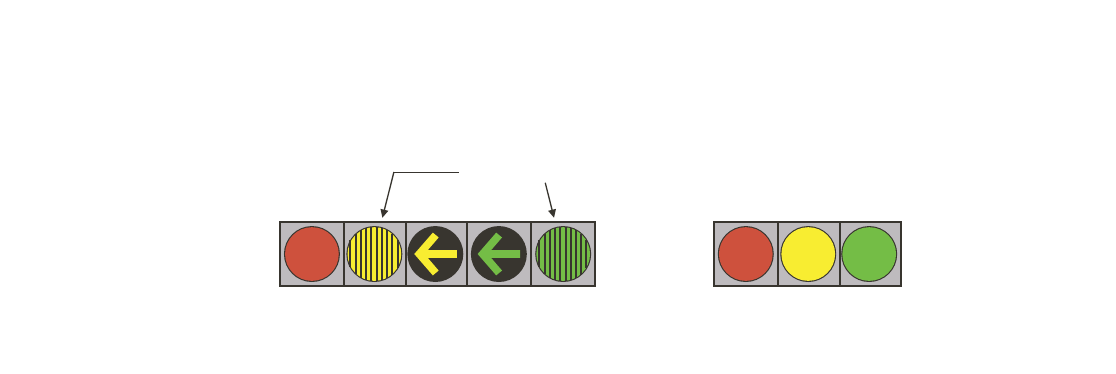
29
ing circular red indication, a circular yellow or yellow arrow
indication, and a green arrow indication for left-turn move-
ments from the top of the “T” to the stem of the “T.” Because
many of these intersections are freeway on-ramps, the leg on
the top of the “T” in the same direction as the left turn may
not have signal indications. The signal rests in flashing red
for the left-turn driver with green for opposing traffic. After
the left-turning vehicle occupies the left-turn bay for a set
period, the driver receives a protected phase. Michigan uses
PPLT phasing with flashing circular red indications. The left-
turn lane has an exclusive three-section display consisting of
a circular red indication, a circular yellow indication, and a
green arrow indication for left-turn movements. In some cases,
a yellow arrow is used in place of the circular yellow indica-
tion. The left-turn movements are operated in a PPLT (dual
lagging) mode. The circular red indication is flashed during
the permissive interval. A protected left-turn green arrow indi-
cation is provided only if left-turn demand exists at the end
of the permissive phase.
The flashing permissive circular red operation has been
used in Michigan since about 1975. One of the earliest instal-
lations of the flashing red is believed to have been in Ann
Arbor, Michigan. The Michigan Department of Transporta-
tion (MDOT) estimated that the State of Michigan operates
the flashing circular red indication at 100 locations, mostly
in urban areas. Another 200 installations are operated locally
by Wayne and Oakland Counties. In the greater Grand Rapids
area, 72 additional locations use this PPLT indication.
Delaware uses the flashing red arrow indication in a four-
section, left-turn display. The display consists of a red arrow
indication next to a circular red indication, with a yellow
arrow indication and a green arrow indication centered under
the red indications. The permissive interval is indicated by a
flashing red arrow.
The Delaware DOT estimated that approximately 100 loca-
tions in Delaware have the flashing red arrow permissive
phase, with the first installations dating to the early 1980s.
Most locations operate with a leading protected phase. After
the red arrow flashing permissive interval, a solid circular red
indication is displayed to the left-turning vehicle, rather than
again displaying a yellow arrow indication (a change inter-
val is not provided). Delaware has also developed controller
TURN YIELD ON GREEN (symbolic circular green indica-
tion) sign (R10-12) be used (1).
In some applications, use of protected, permissive, or PPLT
operations at a given location may be changed by time of day
to reflect changes in the traffic conditions. In these instances,
in addition to meeting the previously documented criteria, the
MUTCD stipulates that (1) the circular green and circular yel-
low signal indications shall not be displayed when operating
in protected-only mode and (2) the left-turn green arrow and
left-turn yellow arrow signal indications shall not be displayed
when operating in the permissive-only mode. Although no
specific signing for a time of day application is identified, the
MUTCD notes that “additional appropriate signal indications
or changeable message signs may be used to meet the require-
ments for the variable left-turn mode” (1).
ALTERNATIVE DISPLAYS USED
IN THE UNITED STATES
Several innovative displays and phasing arrangements have
been created within the past 20 years. Five variations of the
display indicating the permissive phase are known to exist,
only one of which includes the use of the MUTCD standard
circular green indication. These include use of the flashing cir-
cular red, the flashing red arrow, the flashing circular yel-
low, and the flashing yellow arrow indications. Figures 1-1 and
2-4 illustrate the various PPLT displays used throughout the
United States. There have also been some innovative advances
in signal phase sequence, such as the “Dallas Display,” which
alleviate the yellow trap. The manner of use and frequency
of occurrence for each type of display are discussed in the
following subsections and reflect data collected in 1998.
Flashing Red Display
Flashing red displays are used in Maryland (flashing cir-
cular red indication), Michigan (flashing circular red indica-
tion), Delaware (flashing red arrow indication), and Califor-
nia (flashing red arrow indication). The flashing circular red
indication as currently used in Maryland is primarily applied
at two-phase “T” intersections (approximately 13 locations).
This display consists of a three-section display with a flash-
5-SECTION “DALLAS DISPLAY”
PPLT with “Dallas Phasing”
eliminating yellow trap
ADJACENT THRU
HEAD
Louvered
Signal
Lens
Figure 2-5. Illustration of Dallas display.

30
logic to omit the left-turn phase call until the opposing queue
is dissipated.
The City of Cupertino, California, has installed a flashing
red arrow permissive indication in at least three locations.
The City uses a vertical, four-section display with a circular
red indication, a flashing red arrow indication, a yellow arrow
indication, and a green arrow indication. Typically, one left-
turn display is median mounted with a second left-turn dis-
play post mounted on the far left side of the intersection.
Flashing Yellow Display
The City of Seattle, Washington, uses the flashing circular
yellow indication to communicate the permissive left-turn
interval at approximately 20 installations, with additional
intersections still being added periodically. Seattle is using a
four-section vertical display that has a circular red indication,
a circular yellow indication, a flashing circular yellow indi-
cation, and a dual indication yellow arrow/green arrow sec-
tion. Typically, these locations are low volume and operate
in a PPLT mode throughout the day. The flashing circular
yellow indication has been in use in the City of Seattle since
about 1966 and has also been installed in a few other loca-
tions in the Seattle metro area. The staff at the City of Seat-
tle promotes the use of the flashing circular yellow indication
because this indication provides high contrast during the night-
time hours of operation. It is during the nighttime hours that
the City has identified a reduction in crash rates over the use
of the circular green display (5). The implementation of the
flashing circular yellow indication was before light-emitting
diode (LED) lens technology met acceptable standards for
widespread deployment.
The City of Reno, Nevada, installed a flashing yellow arrow
permissive display at five locations around the City. The typ-
ical implementation design used a four-section vertical dis-
play with a red arrow indication, a yellow arrow indication,
a yellow flashing arrow indication, and a green arrow indi-
cation. The display was mounted on a mast arm over the left-
turn lane, with a second left-turn display post-mounted on the
far left side of the intersection. Because of a change in the
City of Reno’s Traffic Engineering staff, the City elected to
remove the flashing yellow arrow displays so that all per-
missive displays were uniform within the city.
In April 1998, the nearby City of Sparks, Nevada, installed
a flashing yellow arrow permissive display at six locations
with approval from FHWA. The City has continued to install
the flashing yellow arrow display at more locations. The exper-
imental design uses an exclusive five-section cluster display
arrangement, with the flashing yellow arrow in the standard
yellow arrow location. The circular green indication is illu-
minated simultaneously with the flashing yellow arrow indi-
cation during the permissive left-turn interval. By design, the
flashing yellow arrow is a supplemental indication to the cir-
cular green indication; therefore, two indications essentially
convey the same information. To accomplish the flashing yel-
low output, the city installed specially designed logic control
units in the controller cabinet. The display is accompanied
with the supplemental sign R10-1 LEFT TURN YIELD ON
GREEN (circular green indication symbol). The supplemen-
tal sign is consistent with standard practices and consistent
with the MUTCD.
Lead-Lag Displays
A traffic control technique designed to avoid the yellow
trap is known as “Dallas Display” operation. The Dallas Dis-
play, developed in the mid 1980s (1986-1987) by a group of
traffic engineers in Dallas County, Texas, requires the stan-
dard three-section signal display for the through movement
and an exclusive, five-section left-turn signal display. First
implemented in the cities of Dallas and Richardson, Texas,
the five-section signal display is typically centered over the
left-turn lane in a vertical, cluster, or, most often, horizontal
configuration. The circular green indication and circular yel-
low indication in the left-turn display are overlapped with
both through movements and are shielded so that they can be
seen only by the left-turning traffic.
An alternative to the Dallas Display was developed in
Arlington, Texas, and is sometimes called the “Arlington Dis-
play.” The Arlington Display uses the same Dallas Display
concept, except that the lagging protected left-turn direction
does not receive a permissive interval during the leading direc-
tion protected interval. This permissive interval is excluded for
two reasons. First, the permissive direction is usually facing
an opposing through queue that is just starting to dissipate,
making it unlikely that the permissive left-turn maneuver can
be made safely. Second, some practitioners believe that the
display of the permissive interval without the same-direction
through traffic receiving a circular green indication is con-
fusing to drivers.
The Dallas or Arlington PPLT displays are used at more
than 600 locations in Texas. The Dallas Display operation has
recently been installed at several locations in Las Vegas and
Carson City, Nevada. Las Vegas has programmed several other
locations for conversion to PPLT phasing in the near future.
Most recently, the cities of Los Angeles and Upland, Califor-
nia, have installed the Dallas Display at several intersections.
As noted within the previous discussion of display applica-
tions, the 2000 MUTCD allows for the use of visibility-limited,
left-turn signal faces that implement the Dallas Display.
PRACTICES OUTSIDE THE UNITED STATES
The United States is not the only country trying to increase
drivers’ understanding of the permissive left-turn display.
Practices from other countries that were identified for this
report are discussed below.

31
Canada
Within Canada, there has been a concerted effort among
many of the provinces to gain uniformity in the displays used
for the protected, permissive, and PPLT control. Many areas
of Canada use a flashing indication, but for different reasons
than the United States. For example, the provinces of British
Columbia, Alberta, and Saskatchewan use the flashing green
left-turn arrow indication for the protected left-turn phase,
whether it is protected only or protected/permissive. Ontario
communicates a protected left-turn movement using the flash-
ing circular green indication at some intersections and a solid
green arrow indication (same as the United States) at other
locations.
In 1997, the Transportation Association of Canada adopted
new traffic signal standards aimed at increasing driver safety
and signal operating efficiency. The most significant changes
involve the introduction of one arrow display (flashing green
arrow indication) for all protected left- and right-turn signal
displays, removal of the nonstandard flashing circular green
indication for protected turn indications, introduction of the
steady amber arrow change interval, provision of a minimum
of two traffic signal heads for through and left-turn move-
ments, and provision of a flashing DON’T WALK change
interval for pedestrian displays. The steady circular green
indication is used to display the permissive interval.
Based on telephone interviews conducted by the research
team in 1995 and a 2002 follow-up conversation, support for
the flashing display centered on the following issues: (1) the
flashing indication provides a more visible message to the
driver; (2) the flashing indication assists drivers with color
vision problems (color anomalous/color deficient); and (3) the
indication has been associated with increased saturation flow
rates for the left-turn movement. Proponents of the flashing
display also acknowledge that there are disadvantages,
including the following: (1) the display is not consistent with
the steady green arrow indication currently used in many
areas throughout Canada and the United States and (2) there
is no uniform meaning for a flashing indication.
To support the hypothesis that the flashing display increases
saturation flow, there were limited studies of the left-turn sat-
uration flow for the flashing display versus the non-flashing
display (6). In a 1991 study, the saturation flow for the two
displays was studied in Edmonton, Alberta, and Victoria,
British Columbia. The data confirmed the hypothesis that the
flashing display increases the saturation flow. It is believed
that the flashing indications demand more attention from
drivers. It should be noted that the NCHRP 3-54 study also
studied saturation flow rate for different signal displays and
indications and did not reach similar findings.
In many provinces, left-turn indications are being displayed
through a variable (fiber-optic or LED) lens. The green arrow
indication will terminate to the yellow change interval using the
same lens. In response to concern that drivers with color vision
problems would have difficulty in distinguishing between the
two indications, the flashing indication was proposed. The
Canadian Association of Optometrists supports use of a flash-
ing indication (7). It was believed that a flashing green dis-
play would allow all drivers, regardless of their vision con-
ditions, to better discriminate between the different displays.
There is some resistance in Canada to the use of the flashing
protected left-turn indication. For example, Ontario already
uses a steady green for simultaneous leading PPLT phasing.
Ontario has thousands of signalized left turns and the cost to
convert has been estimated to be high.
Standard specifications were approved by the Council for
Traffic Control Signals in 1997. Part B of the Manual of Uni-
form Traffic Control Devices for Canada was subsequently
completed and adoption has been underway across the coun-
try. The British Columbia Ministry of Transportation standard
for protected only left-turn movements was a display consist-
ing of a three-section head (steady green arrow, steady yellow
arrow, and a solid circular red indication). The Ministry’s stan-
dard for PPLT displays incorporated a flashing green arrow
and then a steady yellow arrow, resulting in a four-section
signal. The administrative staff of Highway Safety at the
British Columbia Ministry of Transportation estimates imple-
mentation of the new standards should be completed within
10 years. It has been estimated that the cost of implementa-
tion is $35 million (1992 Canadian dollars) (8).
Europe
Several European countries are experimenting with the
use of the flashing yellow indication for the permissive left
turn. In Heidelberg, Germany, the flashing yellow arrow indi-
cation is used on the Neckarstaden at the Congress House
and Stadhalle for the permissive interval of PPLT phasing.
The flashing yellow arrow indication is also used for the per-
missive interval in Bern, Switzerland. In Strasbourg, France,
the flashing yellow indication is used for right-turning traffic
to indicate “yield to pedestrian traffic.” In Spain, there is some
use of the flashing yellow arrow indication for the permissive
left-turn interval.
There has been a concerted effort by practicing European
traffic engineers to develop a European standard for the use
of the flashing yellow arrow indication, though efforts to
implement nationwide across Switzerland were unsuccessful
because of concerns expressed by the Swiss federal police
department.
A European research study concluded that (1) turning vehi-
cles cause accidents, because they periodically misinterpret
the prevailing signals’ “full green” and “green” indication with
flashing light (In Switzerland, the Ordinance for Road Signals
stipulates that a flashing warning signal be positioned beside
the green signal to caution drivers about on-coming vehicles.)
as a “go ahead”; and (2) the “flashing yellow arrow” proves
to be a simpler and more uniform signal—drivers of turning

32
vehicles understand it better and at least some accidents are
prevented (9, 10).
A more in-depth study of the flashing yellow arrow indica-
tion in 1990 compared the accident statistics at 35 signal instal-
lations with flashing yellow arrows in Zurich, Switzerland, and
St. Gallen, Germany, with a control study of 22 intersections
without flashing yellow arrows in Zurich, Switzerland, and
Winterthur, Germany (11). Accident data were analyzed for
a 2.5-year period before the flashing yellow arrow indication
was installed and for a 1.5-year period afterwards. Accord-
ing to this study, the traffic signals with the flashing yellow
arrows led to a significant accident reduction at the 35 survey
installations.
Australia
Researchers at the University of Adelaide, Australia, con-
ducted a three-part study of six traffic signal displays, includ-
ing a flashing yellow arrow indication. Their efforts focused
on analysis of crash data at intersections with the study dis-
plays, a driver survey, and a reaction time experiment com-
paring speed and accuracy of responses to computer-based
animation of the traffic light displays. Overall, the study deter-
mined that there were no conclusive findings demonstrating
superiority of the flashing indication as compared with other
traditional display applications. The research report conclu-
sion section identifies that the flashing yellow arrow indica-
tion shows promise and offers a recommendation that the
use of a flashing yellow arrow display be further investigated,
potentially through dialog with researchers from the NCHRP
3-54 project being conducted in the United States (12).
THE LEFT-TURN PROBLEM
As evidenced by the multiple phasing and display options
identified in the previous sections, accommodating left-
turning vehicles at signalized intersections has been an ongo-
ing concern for transportation engineers as they seek a balance
between intersection capacity and safety through signal phas-
ing techniques. After deciding that a left-turn phase is required,
one of the major decisions faced in timing traffic signals is to
appropriately assign time for left-turn movements. As the
number of left-turning vehicles increases, average delay and
accident potential for both through and left-turning vehicles
also increases. Exclusive left-turn lanes and protected left-
turn phases are commonly used to minimize the impact of
left-turning vehicles. When a protected left-turn phase is used,
however, the time to provide that phase must be taken from
the through phases, or the cycle length must be extended.
Other decisions the engineer must make concern the type of
left-turn phasing that best satisfies the left-turn demand and
the left-turn phase sequence that maximizes progression, par-
ticularly if the intersection is located on an arterial street.
ADVANTAGES OF PROTECTED/PERMISSIVE
LEFT-TURN PHASING
Transportation professionals have chosen PPLT phasing
for many reasons, including minimizing delay, improving
progression, and reducing fuel consumption and air pollu-
tion. From an operational standpoint, an agency might con-
sider using PPLT phasing to increase the operational effi-
ciency of an intersection. PPLT phasing can reduce delay for
left-turning vehicles under low-to-moderate traffic volume
conditions. PPLT phasing is especially effective in reducing
left-turn vehicle delay when it is operated with a coordinated
signal system.
Many jurisdictions use the lead-lag left-turn phase sequence
at intersections within a signal system to improve progres-
sion. The benefits of the lead-lag left-turn phasing are further
enhanced with protected/permissive lead-lag phasing. By
allowing vehicles to turn left during the permissive interval,
required left-turn green phase time can be reduced, allowing
more green time for the coordinated movements. This tech-
nique is especially effective for coordinated arterial signals
where the progressed platoons in each direction do not pass
through the signal at exactly the same time. Several studies
(3, 13, 14) on lead-lag PPLT operation have found intersec-
tion delay and crashes are reduced over traditional PPLT
operation. A comprehensive evaluation of the impacts of
PPLT phasing associated with coordinated signal timing was
completed in western San Bernardino County, California (15).
The City of Upland, California, where much of this study
was completed, was using the Dallas Display. The researcher
documented a 30 to 50% reduction in vehicle delay when
comparing protected-only to PPLT phasing (15). PPLT phas-
ing can also improve the air quality. The California study
showed that increasing average speed, reducing overall travel
time, and reducing the number of stops resulted in a significant
reduction in mobile source emissions. The study documented
a reduction in reactive organic compounds (ROC), carbon
monoxide (CO), and nitrogen oxide (NO
x
) emissions by 9 to
12% per day when comparing protected (lead-lag) with
protected/permissive (lead-lag) left-turn phasing (Dallas
Display).
DISADVANTAGES OF THE MUTCD CIRCULAR
GREEN DISPLAY
Although there are many reasons to use PPLT control,
some disadvantages have not been resolved. First, many traf-
fic and safety engineers question whether drivers fully under-
stand the meaning of the permissive indication. Their obser-
vations suggest that drivers may be confused about how to
make the left turn safely, particularly when PPLT phasing is
used. They have also observed that some left-turning traffic
at intersections with PPLT control does not use the permis-
sive phase (even when adequate gaps in the opposing traffic

33
are available) and instead turn left only when given the pro-
tected left-turn arrow indication. In other locations, left-turn
drivers may interpret the circular green as a protected display.
A second disadvantage of PPLT lead-lag phasing is the
“yellow trap.” The yellow trap can occur in a number of other
situations, such as during signal preemption for emergency
vehicles, during signal preemption for railroad grade cross-
ings, during re-service of lead left-turn phases, or during an
overlapping green extension for “slot” (or inside) clearance
at an offset intersection.
SUMMARY
Through a review of published literature and industry
practice, this chapter has provided an overview of the current
use of left-turn control, specifically focusing on PPLT control.
Basic advantages and disadvantages of PPLT signal phasing
and some of the previously documented variations in PPLT
displays used around the world were identified. Chapter 3
builds on this basic information as detailed elements of the
NCHRP 3-54 project are presented.

34
CHAPTER 3
RESEARCH ACTIVITIES AND FINDINGS
The research project encompassed 14 individual tasks; 8
study tasks and 6 meeting/report tasks. The eight study tasks
are discussed below:
•
Agency Survey,
•
Photographic Driver Study,
•
Field Traffic Operations Study,
•
Field Traffic Conflict Study,
•
Crash Data Analysis,
•
Driver Confirmation Study,
•
Field Implementation Study, and
•
Engineering Assessment.
Each of these work activities is discussed in general detail
below. The work activity objective, methodology, results,
and findings are identified. A complete description and find-
ings for each of these work activities can be found in the
working papers included in the accompanying CD-ROM.
AGENCY SURVEY
The discussion in Chapter 2 demonstrated that there is a
wide variation in the use and application of the PPLT control
throughout the United States and abroad. To identify and quan-
tify the different types of PPLT control displays adequately,
the research team administered an agency survey. The survey
was mailed to all 50 state traffic engineers for DOTs and to
traffic engineers in 275 of the largest city and county trans-
portation agencies in the United States and Canada.
Objective
The objective of the agency evaluation effort was to iden-
tify and quantify the different PPLT displays, design, and phase
sequencing used in the United States.
Methodology
A survey was developed to collect information about the
use of PPLT signal displays in the United States. The survey
consisted of three sections having a total of 15 questions.
The first section of the survey, General Information,
included two questions to determine how many signalized
intersections were located in the jurisdiction and to what
extent the PPLT signal display was used.
The second section of the survey included nine questions
about the use of the PPLT signal display, including inquiries
about the display arrangement, mounting type and location,
use of secondary PPLT signal displays, and the type of sig-
nal indication used for the permissive phase of the PPLT.
The third section of the survey included questions about
how the agency uses PPLT signal displays for different geo-
metric roadway conditions, if the agency uses any special
technique(s) to avoid the yellow trap, and if there are any local
laws or ordinances governing the use of PPLT signal displays.
The survey responses were summarized and analyzed to
determine to what extent PPLT signal displays are being used
in the United States.
Results
One hundred and eighty (55%) of the surveys were returned,
including six from Canada and six from agencies not using
PPLT signal displays. Excluding the Canadian surveys (Cana-
dian use of PPLT signal displays is discussed in Chapter 2 of
this report) and the jurisdictions not using PPLT displays, the
remaining 168 returned surveys were used to develop the
findings summarized below.
Findings
•
Collectively, the 168 agencies identified 107,219 signal-
ized intersections. Of those, 30,870, or 29%, used PPLT
signal phasing.
•
The five-section cluster display was the predominant
arrangement used in 34 states and represented 63% of all
reported PPLT signal displays. The next most commonly
used PPLT signal display arrangement was the five-
section vertical, which accounted for approximately 19%
of all reported PPLT signal displays.
•
The five-section horizontal display was used predomi-
nantly in two states and accounted for approximately
9% of the reported PPLT signal displays. Use of the

35
four-section and three-section PPLT signal displays were
less common. They were found to be in use in a few states
and accounted for less than 10% of all reported PPLT sig-
nal displays.
•
A total of 41% of the agencies reported use of a single
(consistent) PPLT signal display arrangement through-
out their jurisdictions. Most agencies used a combination
of post-mounted five-section vertical displays in median
applications and five-section vertical or five-section clus-
ter displays for mast arm or span wire mounting.
•
Thirty-three agencies identified a total of 1,650 PPLT
signal displays with bimodal arrow indications. These
agencies explained that the bimodal indications reduced
the space requirement of the signal display (by elimi-
nating one signal section/lens), resulting in energy sav-
ings. The remaining 135 agencies did not use bimodal
indications.
•
Mast arm and span wire mounting was used predomi-
nantly in combination with the cluster PPLT signal dis-
play. Use of pole mountings was primarily reported with
vertical PPLT signal displays for median applications.
•
A total of 52% of the responding agencies mounted the
overhead PPLT signal display on the lane line between
the left-turn lane and the adjacent through lane, while
40% mounted the PPLT signal display over the center
of the left-turn lane.
•
The use of secondary or additional PPLT signal displays
was nearly evenly split—49% of the agencies respond-
ing to the survey used a secondary PPLT signal display
(which was usually pole mounted on the far side of the
intersection), while 51% did not.
•
Of the responding agencies, 40% always used the
PPLT signal display as one of the two MUTCD-required
through movement displays, while 37% sometimes did
and 23% never did.
•
The circular green permissive indication was used by
165 of the 168 agencies for left turns. Other permissive
indications in use included the flashing circular yellow
indication, flashing yellow arrow indication, flashing cir-
cular red indication, and flashing red arrow indication.
•
PPLT signal displays were generally used with exclu-
sive left-turn lanes—89% of left-turn lanes were exclu-
sive, 8% were shared, and 3% were a combination of
exclusive and shared lanes.
•
There was little consistency in the use of supplemental
signs among the responding agencies—49% of the agen-
cies always use signs, 34% use signs only in certain con-
ditions, and 17% do not use signs. When signs are used,
more than 75% of the signs are the MUTCD R10-12 sign.
•
A total of 83% of the signalized intersections using
PPLT signal phasing employed a leading sequence, while
11% used a lagging sequence and 6% used a lead/lag
sequence.
•
A total of 53% of the responding agencies indicated that
they did not use any special phasing or techniques to
avoid the yellow trap, while 5% of the agencies indi-
cated that they use Dallas or Arlington Display, 18% use
exclusive left lead with PPLT lag, and 25% indicated
that they used some other method.
•
All off the responding agencies referred to state statutes
or local ordinances that require either specific display
types, display indications, or compliance with state man-
uals; however, only 7% of the agencies indicated that
there was a law or ordinance that required certain prac-
tices in the use of PPLT phasing.
PHOTOGRAPHIC DRIVER STUDY
This section of the report summarizes a photographic
driver survey that was undertaken as part of the research
study. Several human perceptions affect drivers’ under-
standing of the traffic control signal. The visual search
processes, perception and reaction, and recognition and
comprehension that drivers exhibit can be investigated and
used to evaluate PPLT signal displays. Drivers’ expectation
and the complexity of the traffic control signal also influ-
ence drivers’ understanding and can be incorporated into the
evaluation.
Objective
The objective of the photographic driver study was to eval-
uate the different PPLT signal displays used in the United
States (as identified through the literature review and agency
survey). The evaluation explored driver understanding of the
signal indication under various conditions. The conditions
varied through the use of protected left-turn indications, per-
missive left-turn indications, through-movement indications,
and PPLT signal display arrangements.
Methodology
A computer-based study tool using both dynamic and
static elements was developed and used to collect data about
drivers’ understanding of the different PPLT signal indica-
tions and displays. To create a reasonable simulation of the
driver’s view, photographs of existing signalized intersec-
tions were incorporated into the computer software. These
photographs acted as the background scenes for different
PPLT signal displays. Over 100 photographs were catego-
rized into three groups based on the mounting type, location
of the PPLT signal display, and intersection geometry. Six
photographs (two from each group) were selected to be used
in the study and were incorporated into the software. Five of

36
the six selected photos contained a vehicle in the opposing
through lane(s). Because of the static nature of the photo, it
was impossible to determine if the opposing vehicle was sta-
tionary or proceeding through the intersection. The remain-
ing photo, without a vehicle in the opposing through lanes,
was used as a control photo providing a means of analyzing
the effect that the presence of a vehicle in the opposing
through lane had on survey responses. Figures 3-1 through
3-6 illustrate each of the six background photos used in the
evaluation.
Two hundred unique scenarios were produced using the
six selected photographs and combinations of protected left-
turn indications, permissive left-turn indications, through-
movement indications, and PPLT signal display arrangements.
An all-red scenario was also created for each of the PPLT sig-
nal display arrangements. A randomizer function was added to
Figure 3-1. Photographic driver survey—background picture 1.
Figure 3-2. Photographic driver survey—background picture 2.

37
the software, which allowed a subset of 30 of the 200 sce-
narios to be randomly presented to each driver participating
in the study.
Survey Tool
One of the objectives in the development of the photo-
graphic driver survey was to make it as self-explanatory and
self-administering as possible, requiring little input from the
survey administrator as each driver completed the survey. To
meet this objective, all survey instructions were included as
a sound track within the survey software. Along with the gen-
eral survey instructions, the computer operations necessary
to complete the survey were demonstrated through an exam-
ple survey question.
The use of laptop computers in the photographic driver
study provided the opportunity to include three additional fea-
Figure 3-4. Photographic driver survey—background picture 4.
Figure 3-3. Photographic driver survey—background picture 3.

38
tures in the software design. First, the computer clock time was
recorded for each survey response, measured from the time the
scenario was presented on the computer screen to the time a
response was selected. Response time data were used as a sur-
rogate measure of driver understanding; longer response times
were correlated to lower levels of driver understanding. Aver-
aging the response times for each scenario minimized bias
related to distractions, guessing, and other time variances not
related to understanding.
The second feature added to the software was an initial
screen that allowed the survey administrator to enter the com-
puter number, the location of the survey, and the number of
scenarios to be randomly selected and presented to each
driver. This screen was only active when the software was
initially loaded at the start of each survey session. The final
feature added to the software was a file writing procedure
for processing the survey data. As each survey response was
recorded, the location, date, computer number, demographic
Figure 3-6. Photographic driver survey—background picture 6.
Figure 3-5. Photographic driver survey—background picture 5.

39
data, scenario number, response time, and response were
written as a single row of data in a text file.
With respect to the actual operation of the survey instru-
ment, the driver was asked “If you want to turn left, and you
see the traffic signals shown, you would . . .” as each study
scenario was presented. The driver used the computer key-
board to select what he or she believed to be the appropriate
response. Options were as follows:
•
Go.
•
Yield. Wait for gap.
•
Stop, then wait for gap.
•
Stop.
The driver also could choose not to respond.
In addition, drivers were asked additional demographic
questions, including their sexes, ages, and educational levels;
whether they live in a city, suburb, or rural area; and how many
miles they drove the previous year.
Survey Locations
The study was administered to respondents in Dallas, Texas;
Dover, Delaware; Oakland County, Michigan; College Sta-
tion, Texas; Seattle, Washington; Portland, Oregon; Cuper-
tino, California; and Orlando, Florida. Through the study
methodology, a sample size of 2,400 participants was sought.
The study was conducted primarily at local drivers licensing
facilities. Photographs of the driver study being administered
at various locations are provided in Figures 3-7 and 3-8. Data
were compiled into a single spreadsheet database and were
then analyzed to determine the drivers’ understanding of the
different PPLT signal displays and indications, using both
descriptive and statistical procedures.
Results
A total of 2,465 drivers participated in the study, exceed-
ing the target of 2,400 participants. At least 300 drivers com-
pleted the study at all but one of the eight locations. Because
each study respondent was presented with 30 scenarios, a
total of 73,950 responses were recorded.
Of the 2,465 drivers, 58% were male, 41% were female,
and the balance (1%) did not respond to the gender question.
A total of 27% were less than 24 years of age, 44% were
between 25 and 44, 21% were between 45 and 65, and 7%
were over 65. The remaining respondents (1%) did not pro-
vide their ages. In total, 58% of the participating drivers lived
in a city, 30% in a suburban location, 11% in a rural location,
and 1% did not respond. In total, 5% of the respondents indi-
cated that they did not drive at all last year; 31% drove fewer
than 10,000 miles; 44% drove between 10,000 and 20,000
miles; 19% drove more than 20,000 miles; and 1% did not
respond. Education levels among the participants were rela-
tively uniform—29% of the drivers had a high school or
equivalent education, 35% had some college education, and
35% had a college degree, with 1% not responding.
Figure 3-7. Example of driver evaluation study workstation at Department of
Motor Vehicles.

40
Findings
Analyses were performed to evaluate the drivers’ under-
standing of three signal indications: all-red, protected, and
permissive. (For further information on these analyses, con-
sult Working Paper No. 3, which is included in the appen-
dixes on the accompanying CD-ROM.) Understanding was
measured by the percentage of correct responses to the study
scenarios. The results of statistical analyses presented in the
following sections were all conducted using analysis of vari-
ance (ANOVA) procedures at a 95% level of confidence.
An overall analysis of the demographic characteristics of
the drivers in relation to the total number of survey scenarios
evaluated and percentage of correct responses is presented in
Table 3-1. Note that these results contain responses to all dis-
play types.
All-Red Indication Findings
•
Figure 3-9 summarizes the percentage of correct
responses to all-red indications. Statistical analysis of
Figure 3-8. Example of driver evaluation study workstations at shopping center.
PPLT Signal Displays
Percent Correct Response
93.6
91.2
96.6
94.0
94.3
50
60
70
80
90
100
5-Section
Horizontal
5-Section
Vertical
5-Section
Cluster
4-Section
Cluster
3-Section
Vertical
Figure 3-9. Driver understanding of all-red indications in PPLT
signal displays.

41
the data determined that PPLT signal display type did
not affect driver understanding with all-red indications.
•
There was a significant difference in response times
among gender and age groups. Female drivers (93.5%)
had a slightly higher correct response rate than male
drivers (92.8%). Drivers over the age of 65 had a 90.0%
correct response rate compared with a 93.8% correct
response rate for the under-24 age group.
Protected Indication Findings
•
Figure 3-10 summarizes the percentage of correct
responses to protected indications in the PPLT displays.
•
As suggested by Figure 3-10, a statistically significant
difference was found between display arrangements
when considering protected indications, particularly
when simultaneous displays were used in the same dis-
play arrangement. Simultaneous indications were not
presented with the three and four-section displays.
•
Driver understanding was significantly lower when a
green arrow and a circular red indication were pre-
sented simultaneously within all five-section PPLT sig-
nal displays.
•
When the green arrow and circular red indications were
shown simultaneously in a five-section signal display,
driver understanding was lowest with the horizontal dis-
play. Locating the green arrow to the right of the circu-
lar red indication in a five-section horizontal display
arrangement as required by the MUTCD appeared to
increase confusion.
•
When the green arrow and circular green indications are
shown simultaneously, the five-section horizontal dis-
play has the lowest level of driver understanding.
•
When only a green arrow indication is provided in a left-
turn signal display, driver understanding of the protected
indications was not affected by the through movement
indication.
•
Age was found to be statistically significant because
drivers over the age of 65 had an 82.5% correct response
rate compared with an 88.6% correct response rate for
drivers aged 24 to 44. In general, the percentage of cor-
rect responses decreased as driver age increased.
TABLE 3-1 Summary of survey scenario demographics (as a function of
total number of surveys evaluated for all display types)
Demographic Level
Number of
Responses
Percentage of
Correct Responses
Dallas
9,299
Dover 75.6
68.5
Oakland Count
y
9,722
9,722
70.7
Colle
g
e Station 9,034 74.6
Seattle
78.5
Portland
71.5
Cu
p
ertino 69.7
Location
Orlando
66.7
Male
72.7
Female
71.3
Gender
Not Provided 456
68.9
< 24 19,942
72.2
24 – 44 32,191
73.1
45 – 65 15,171
71.1
> 65 4,958
67.3
Age
Not Provided 508
74.2
Cit
y
42,063 71.8
Suburb
72.8
Rural
71.8
Residence
Not Provided 299
67.9
None
62.7
< 10,000 22,523
70.2
10,000 to 20,000 32,746
74.1
> 20,000 13,916
72.4
Miles Driven
Not Provided 241
77.2
No
72.3
Yes
66.1
Color Vision
(Have trouble seeing
red or green?)
Not Provided 181
80.7
Hi
g
h School 20,738 67.4
Some College
25,849
College Degree 25,891
74.6
Education
Not Provided 292
66.8
9,658
8,869
8,923
8,226
42,189
30,125
21,880
8,528
3,344
69,217
3,372
73.3
42
•
The average response time associated with the five-
section PPLT signal display arrangement was greatest and
was longer than the average of all response times for all
PPLT signal display arrangements. The longest response
time was associated with the five-section horizontal PPLT
signal display. This higher average response time corre-
lates with the lower correct response rate attributed to the
simultaneous illumination of the green arrow and the solid
circular red indication.
•
When the protected left-turn indication was exclusive
(from the through-movement indication), the through-
movement indication did not significantly affect driv-
ers’ understanding of the left-turn indication. The
highest correct response rates were associated with
the four-section and three-section PPLT signal display
arrangements. These results support the use of an exclu-
sive head.
Permissive Indication Findings
•
Figures 3-11 and 3-12 summarize the percentage of
correct responses to permissive indications in the PPLT
displays. As shown in Figure 3-11, the circular green
50
60
70
80
90
100
93.3
92.4
92.0
93.3
92.9
91.2
89.0
61.6
91.5
79.2
73.1
90.2
PPLT Signal Displays
Percent Correct Response
5-Section
Horizontal
5-Section
Vertical
5-Section
Cluster
4-Section
Vertical
3-Section
Vertical
4-Section
Cluster
Through Movement - Red Through Movement - Green
Figure 3-10. Driver understanding of protected indications in PPLT signal displays.
40
45
50
55
60
65
70
63.8
Flashing Red Ball
56.6
Flashing Yellow
Arrow
61.7
Flashing Yellow
Ball
50.4
Green Ball
55.6
Flashing Red Arrow
Permitted Indication
Percent Correct Response
Figure 3-11. Percentage of correct responses for the permitted indications in PPLT
signal displays.
43
indication had the lowest level of driver comprehen-
sion, at 50%.
•
Figure 3-12 provides more detailed information on the
percentage of correct responses to permissive indica-
tions in PPLT signal displays by display type. The dif-
ferences among the arrangements were determined to be
directly related to the permissive indications used within
each signal display.
•
The correct response rate for male drivers was 57.7% as
compared with a 54.8% correct response rate for female
drivers. This difference was statistically significant. Age
was found to be statistically significant because drivers
over the age of 65 had a 51.4% correct response rate
compared with a 57.5% correct response rate for drivers
aged 24 to 44.
•
Drivers over the age of 65 had extremely low correct
response rates with the permissive circular green indi-
cations. When the permissive circular green indication
and the circular red through-movement indication were
shown, less than 29% of older drivers correctly responded.
•
Drivers over the age of 65 had a higher correct response
rate with the flashing circular red indication and flash-
ing yellow permissive indications than all other age
groups. A total of 70% of drivers over the age of 65 cor-
rectly understood the flashing circular red indication.
•
Average response time was generally lower for the flash-
ing permissive indications. A trend in average response
time by age was very evident as drivers over the age of
65 took between 2 and 4 sec of additional time to respond
when compared with drivers under the age of 24.
•
The analysis of the permissive left-turn indication reveals
that a flashing indication is better understood than a solid
indication, and a circular indication is better understood
than an arrow indication.
General Findings
•
Drivers’ understanding of the PPLT signal displays
was evaluated by combining the results from the all-
red, protected left-turn, and permissive left-turn sce-
narios. The cluster arrangement was associated with
the largest number of correct responses and the fewest
fail critical responses of the five-section PPLT signal
display arrangements. (For further information on these
analyses, consult Working Paper No. 3, which is included
in the appendixes on the accompanying CD-ROM.) The
overall highest correct response rate was associated with
the three-section vertical PPLT arrangement that uses a
flashing circular red indication as the left-turn permissive
indication.
•
There was no evidence to suggest that the placement of
the PPLT signal display influenced drivers’ understand-
ing of the PPLT signal display.
•
The influence of the intersection geometry could not be
measured because the study simulated only exclusive
left-turn lane configurations.
40
45
50
55
60
65
70
64.5
61.1
55.3
54.3
59.9
56.0
51.4
48.1
54.8
48.5
53.5
44.5
PPLT Signal Displays
Percent Correct Response
5-Section
Horizontal
5-Section
Vertical
5-Section
Cluster
4-Section
Vertical
3-Section
Vertical
4-Section
Cluster
Through Movement - Red
Through Movement - Green
Figure 3-12. Percentage of correct responses to permissive indications by PPLT
display type.

44
FIELD TRAFFIC OPERATIONS STUDY
Capacity and delay are two common measures of effec-
tiveness in evaluating signalized intersection operations (16).
Capacity is defined as the maximum rate of flow at which
vehicles can be reasonably expected to traverse a point, a uni-
form segment of a lane, or a roadway during a specific period
under prevailing roadway, traffic, and control conditions.
Delay is the additional travel time experienced by a driver
beyond what would reasonably be desired for a given trip.
Left-turn capacity at a signalized intersection is calculated
using the saturation flow rate. Saturation flow rate is defined
as the maximum rate of flow that can pass through a given
lane group under prevailing traffic and roadway conditions,
assuming that the lane group has 100% of green time avail-
able (16). Saturation flow is usually reached after the fourth
vehicle in a queue has entered the intersection.
At the beginning of each protected left-turn movement, the
first several vehicles in the queue experience start-up time
losses that result in their movement at less than the saturation
flow rate (16). This time loss is referred to as the start-up lost
time, which is made up of the perception and reaction time
(response time) to the change in signal indication along with
the vehicle acceleration time to free-flow speed. Start-up lost
time is important in evaluating left-turn lane capacity and
driver reaction to the traffic signal indication. Reaction time
was considered to include the perception time in addition to
the reaction time to the onset of the green arrow indication.
Gap acceptance and follow-up headway also affect left-
turn capacity and delay. Gap acceptance refers to the time
headway in the opposing traffic stream that left-turn drivers
are willing to turn through during the permissive left-turn
phase. The median time headway between two successive
vehicles in opposing traffic streams accepted by left-turn
drivers during the permissive left-turn phase is referred to as
the critical gap. Follow-up headway is the time between the
departure of a permissive left-turn vehicle and the departure
of the next vehicle using the same gap under a condition of
continuous queuing. Left-turn delay can be evaluated by
quantifying each of the operational variables and applying
the procedures included in Chapter 16 of the Highway Capac-
ity Manual (16).
Objective
The objective of the traffic operations study was to quan-
tify the capacity and delay effects of PPLT signal displays
and indications currently used in the United States. This
objective was achieved through analysis of saturation flow
rates, lost times, response times, and follow-up headways.
This analysis was used to describe the driver understanding
associated with the PPLT signal displays and indications.
Methodology
Field traffic operations data were collected at eight study
locations: Dallas, Texas; Dover, Delaware; Oakland County,
Michigan; College Station, Texas; Seattle, Washington; Port-
land, Oregon; Cupertino, California; and Orlando, Florida.
These locations provided a range of PPLT signal displays
and left-turn permissive indications and were the same sites
as the photographic driver study.
With the assistance of local transportation officials, a total
of 26 study intersections were identified. Intersection selec-
tions were based on left-turn lane geometry, PPLT display
arrangement, and left-turn phasing. At each intersection, a
video camera was installed to record the left-turn traffic flow.
In addition to video taping the left-turn traffic, a researcher
at the intersection simultaneously operated a portable com-
puter and the software program HEADWAY to collect data.
The data collected using the HEADWAY program were then
used to compute left-turn saturation flow rate, start-up lost
time, response time, and follow-up headway.
Results
Saturation flow rate, lost time, response time, and follow-
up headway data were collected for 26 intersections located
throughout the eight study locations. Two additional site loca-
tions were studied in Texas to evaluate the green indication
used in the Dallas Display in a lead-lead and lag-lag phase
sequence. The PPLT signal indications investigated included
the circular green, flashing circular yellow, flashing red arrow,
and flashing circular red indications. At the time the field
observation studies were prepared, no flashing yellow arrow
display was available for study (the field studies were com-
pleted before implementation of the Sparks display in April
of 1998).
Findings
The detailed findings of the field traffic operations stud-
ies are documented in Working Paper #4. General findings
include the following:
•
As shown in Table 3-2, analysis of the observed satura-
tion flow rate data determined that the geographic loca-
tion was a significant contributor to the variance in the
average saturation flow rates. The PPLT signal display
arrangement and phasing were not statistically significant.
•
Analysis of the start-up lost time data showed that the
differences in average start-up lost time were signifi-
cantly influenced by the PPLT signal phasing and were
not significantly influenced by the PPLT signal display
arrangement or study location.

45
TABLE 3-2 Saturation flow rate data
Saturation Flow
Rate (vphgpl)
City ID
1
PPLT
Display
2
PI
3
Left-Turn
Phasing
Average SD
4
Rank
Order
1 5-Vert. GB Lead 2,201 36.55 6
2 5-Horz. GB Dallas-Lead 2,211 36.09
5
3 5-Horz. GB Dallas-Lag 2,320 97.50
3
4 5-Horz. GB Dallas-Lead 2,091 98.38
8
Dallas,
TX
5 5-Horz. GB Dallas-Lag 2,063 58.97 1
2
6 4-Cluster FRA Lead 2,214 151.91
4
7 4-Cluster FRA Lead 1,977 19.75
16.5
Dover,
DE
8 4-Cluster FRA Lead 1,999 118.21
15
9 3-Vert. FRB Lag 2,168 111.09
7
10 3-Vert. FRB Lag 2,399 86.51
2
Oakland
County, MI
11 3-Vert. FRB Lag 2,402 52.54
1
12 5-Horz. GB Lead 1,973 60.65
18
13 5-Horz. GB Lead 2,025 78.42 1
4
College Station,
TX
14 5-Cluster GB Lag 2,045 57.13
13
15 4-Vert. FYB Lead 1,773 3.00
22
16 4-Vert. FYB Lead --- ---
24.5Seattle, WA
17 4-Vert. FYB Lead --- ---
24.5
18 5-Cluster GB Lead --- ---
24.5
19 5-Cluster GB Lead 1,871 40.13
21
Portland, OR
20 5-Cluster GB Lead 1,977 7.00
16.5
21 4-Vert. FRA Lead 2,065 48.26 1
1
22 4-Vert. FRA Lead 1,944 146.93
20
Cupertino, CA
23 4-Vert. FRA Lead --- ---
24.5
24 5-Cluster GB Lead 2,067 42.58
10
25 5-Cluster GB Lead 2,072 61.8
79
Orlando, FL
26 5-Cluster GB Lead 1,963 102.93
19
1. Intersection Identification Number
2. Number of signal display sections (3, 4, or 5) - arrangement (Horizontal, Vertical, or Cluster)
3. Permitted Indication - G = Green; Y = Yellow; R = Red; B = Ball (circular indication); A = Arrow; F = Flashing
4. Standard Deviation

46
•
Analysis of the response time data indicated differ-
ences in average response time to be significantly influ-
enced by the PPLT signal arrangement and phasing and
by the study location, although most of the variability
was explained by the effect of the PPLT signal phasing.
•
Analysis of the follow-up headway data considered the
effect of the PPLT signal display and the left-turn per-
missive indication. The results of this analysis are shown
in Table 3-3.
As shown in Table 3-3, the follow-up headway associated
with the flashing red PPLT indication used in Dover was longer
than all other observed follow-up headways. The follow-up
headway associated with the flashing red PPLT indication
used in Michigan was comparable to the follow-up headway
associated with the circular green, flashing circular yellow,
and flashing red arrow indications.
FIELD TRAFFIC CONFLICT STUDY
Traffic conflicts involve the interaction of two or more
drivers where one or more drivers take evasive action to
avoid a collision (17, 18, 19). Traffic conflict studies provide
one of the most effective ways to supplement crash studies
in estimating the crash potential of various PPLT signal dis-
plays. In addition, traffic conflict studies can be used to esti-
mate traffic safety when crash rates are not available.
Collecting traffic conflict data can also be valuable in iden-
tifying whether unsafe vehicle maneuvers are prevalent at
an intersection. Conflict studies also provide an effective way
to study specific geometric applications at PPLT intersections.
Conflicts can be considered vehicle interactions that may
lead to crashes. For a conflict to occur, the road users must
be on a collision course (17, 18, 19). The primary require-
ment of a traffic conflict is that the action of one user places
another user on a collision path unless evasive action is taken.
Collisions and near-miss situations that occur without evasive
maneuvers, or when the evasive action is inappropriate or
inadequate for conditions, are also recorded as conflicts.
Conflict studies are used to evaluate safety, as well as to
select signal phasing. An Institute of Transportation Engineers
(ITE) study found that 33% of reporting agencies used a left-
turn conflict rate of four conflicts per 100 left-turning vehicles
as a warrant for implementing PPLT signal phasing (20).
Objective
The objective of the traffic conflict study was to quantify
left-turn conflict rates and event rates for different PPLT
signal displays and indications. Traffic events are unusual,
dangerous, or illegal non-conflict maneuvers such as red indi-
cation violations, backing, hesitation on signal change, and
slowing considerably in a traffic lane.
Methodology
Conflict studies were conducted in Dallas, Texas; Dover,
Delaware; Oakland County, Michigan; College Station, Texas;
Seattle, Washington; Portland, Oregon; Cupertino, California;
and Orlando, Florida. These locations provided a range of
PPLT signal displays and left-turn permissive indications and
were the same locations where the photographic driver study
and operations studies were conducted.
With the assistance of local transportation officials, a total
of 26 study intersections were identified. Specific intersec-
tions were selected based on the left-turn lane geometry,
PPLT display arrangement, and left-turn phasing.
At each intersection, conflict data were recorded on a data
collection form. Each intersection was observed for 8 hr on
a weekday between 7:00 a.m. and 6:00 p.m. To back up real-
time observations, a video camera was also installed at each
intersection. The videotape was reviewed to clarify any dis-
crepancy in the manually recorded field data.
Observed conflicts were categorized as follows:
•
Type 1—opposing left-turn conflicts;
•
Type 2—left-turn/same direction conflicts;
•
Type 3—left-turn/lane change conflicts; and
•
Type 4—secondary conflicts, such as those involving a
pedestrian or bicyclist or resulting from a lane overflow.
Figure 3-13 illustrates the conflict types.
The observed traffic events were also categorized by type
as follows:
•
Type 1—driver hesitating on the left-turn protected
indication
•
Type 2—driver hesitating on the left-turn permissive
indication
•
Type 3—driver going through the circular red indication
•
Type 4—driver backing a vehicle out of the intersec-
tion, back into the left-turn lane
TABLE 3-3 Rank order of PPLT signal display by average
follow-up headway
PPLT Signal
Display
Location Permissive Indication
Rank
Orde
r
5-Section Vertical Dallas, TX Circular Green
3
4-Section Vertical Seattle, WA Flashing Circular
Yellow
4
4-Section Vertical Cupertino, CA Flashing Red Arrow
6
3-Section Vertical
Oakland County,
MI
Flashing Circular Red
5
5-Section
Horizontal
College Station,
TX
Circular Green
2
5-Section Cluster Portland, OR Circular Green
1
4-Section Cluster Dover, DE Flashing Red Arrow
7

47
Type 1: Opposing left-turn conflict
Type 3: Lane-change conflict
Type 4: Left-turn ped/bicycle far/near side conflict
Type 2: Left-turn, same direction conflict
Type 4: Opposing right-turn-on-red conflict
Type 4: Left-turn
overflowlane
Figure 3-13. Illustration of conflict types.

48
Results
A total of 11 hr of data were collected at each of the 24
study intersections for a total of 264 hr of observation time.
During the observation period, the research team observed
approximately 22,000 vehicles; of which 5,000 were left-
turn vehicles; and 17,000 were through vehicles.
A total of 166 left-turn conflicts were observed: 155
Type 1, 9 Type 2, and 2 Type 3 conflicts. No Type 4 conflicts
were observed.
Of a total of 242 traffic events observed, 147 were Type 1,
53 were Type 2, 5 were Type 3, and 37 were Type 4.
Findings
•
Overall, the left-turn conflict rates were low for all PPLT
displays evaluated.
•
Few left-turn conflicts were associated with the PPLT
display.
•
Most left-turn events were related to hesitation at the
onset of the green indication.
•
Aggressive driving appeared to be the cause of 146 of
the 155 Type 1 conflicts. Drivers continued to make left-
turn maneuvers during the yellow and all-red phase fol-
lowing the protected left-turn phase and were in conflict
with the opposing through traffic.
•
Eight Type 1 conflicts appeared to be the result of the
driver’s assuming the right-of-way when the left-turn
permissive circular green indication was illuminated.
Two of these conflicts occurred at intersections with the
five-section horizontal PPLT arrangement and the
remainder occurred at intersections with the five-
section cluster PPLT arrangement.
•
One Type 1 conflict appeared to be the result of the
driver’s assuming the right-of-way when the left-turn
permissive flashing red arrow indication was illumi-
nated on a four-section cluster arrangement.
•
The nine Type 2 conflicts were primarily the result of a
driver’s hesitating to turn left on the left-turn permissive
indication. The sudden hesitation would cause a con-
flict with the following vehicles. There appeared to be
a relationship between the driver’s understanding of the
permissive circular green indication and the observed
Type 2 conflicts.
•
The two Type 3 conflicts were a result of driver error
and not the lack of understanding of the PPLT signal
display.
•
The largest occurrence of Type 1 traffic events involved
the five-section horizontal PPLT signal display arrange-
ment. The simultaneous illumination of the green arrow
and the circular red indications appeared to increase the
workload of the driver, resulting in an increase in driver
uncertainty.
•
Type 2 traffic events were observed at each of the study
intersections. The occurrence did not appear to be related
to the PPLT signal arrangement or phasing or indication.
•
Numerous drivers were observed proceeding through
the all-red indication (i.e., red light runners). Therefore,
Type 3 events were recorded only when the action was
clearly a function of driver misunderstanding. For this
reason, only five Type 3 events were recorded, and the
occurrences showed no pattern to suggest an influence
of the PPLT signal display, indication, or phasing.
•
Of the 37 observed Type 4 events, 33 were associated
with a flashing permissive indication. The driver would
enter the intersection during the permissive phase and
not have the opportunity to make the left-turn maneu-
ver. The driver would then choose to back up.
CRASH DATA ANALYSIS
Given the the extensive use of crash data in many past
studies in the evaluation of left-turn control, the research
team conducted a limited study of crash history related to the
unique displays used in PPLT control. The project panel and
research team recognized that current crash reporting tech-
niques do not adequately document causes of a crash as they
relate to traffic signal operation, much less the particular sig-
nal display. To overcome this short coming, the research
team identified a work plan that would compare the various
PPLT control displays against one another and make judg-
ments as to whether a particular display was more or less
prone to increased crash occurrence.
Objective
The objective of the crash analysis was to determine and
compare left-turn crash rates associated with various PPLT
signal displays. The details of the crash data analysis are
described in the following sections.
Methodology
To accomplish the objective of the crash data analysis,
three tasks were conducted. Those tasks are listed below:
•
Perform a literature review to obtain background infor-
mation on crash data analysis procedures and to review
the results of previous studies;
•
Obtain traffic volumes, geometric design, signal display
information, and 3 years’ of crash data for the study
intersections (the same intersections studied in the oper-
ational study and the conflict study were evaluated in the
crash analysis). In addition, crash data were sought from
agencies around the United States;
•
Reduce the data and analyze the results.

49
Results
Since the mid-1970s, more than 40 reports have been pub-
lished on the use and operational impacts of the PPLT signal
control treatment. Several of these reports were spurred by
the increase in the use of PPLT phasing. In general, many of
these reports identified trends in vehicle delay, vehicle con-
flicts, and vehicle crashes. Further, these studies related the
effects of PPLT phasing to geometric and physical condi-
tions, such as traffic volume, number of opposing lanes, sig-
nal displays, and the use of supplemental signing. Over 30%
of the reports are focused on warrants or guidelines related
to the use of PPLT phasing.
The purpose of the literature review was to identify how
crash data were evaluated and what crash statistic should be
used for this study. The literature review was selective in that
not all reports related to PPLT phasing were studied. Certainly,
many good reports are available as a resource. The literature
review identified reports that were key to this study because of
the significance related to their findings and/or the strict focus
related to PPLT phasing. Specifically some reports focused
on the PPLT indications, display arrangement, and/or display
location—all of which are study factors for this NCHRP study.
The select literature review identified several key findings
related to PPLT phasing:
•
Hummer determined that the crash frequency is higher
for PPLT intersections with leading left-turns compared
with lagging left-turns (21). However, Upchurch deter-
mined that this was true for intersections with three
opposing lanes of traffic (22). Upchurch determined that
the lagging PPLT had the worst crash record when there
were two opposing lanes of traffic.
•
Almost all literature shows that the leading protected
left-turn phasing has the lowest crash rate (22, 23).
•
Upchurch (22) and Hauer et al. (24) both determined
that crash frequency relationship to traffic demand is
nonlinear.
•
Bonneson and McCoy determined there was no statisti-
cal difference in crash frequency among the most com-
mon PPLT display arrangements (25).
•
The Washington Section of ITE determined the flashing
circular yellow display was safer than the circular green
permissive display (26).
•
Agent (27, 28, 29) determined that the use of PPLT phas-
ing can reduce left-turn delay by 50% and total delay by
24%, compared with protected-only phasing.
Although not all reports agree with one another, the gen-
eral findings related to the use in PPLT phasing, in aggregate,
suggest the following:
•
Vehicle delay decreases,
•
Fuel usage decreases,
•
Vehicle progression is improved, and
•
Vehicle crashes increase.
The use in PPLT phasing should be applied on a case-by-
case basis, because not all intersection approaches are candi-
dates for PPLT phasing.
Data Analysis
For the purpose of this study, the research team identified
three sources of crash data for analysis. First, crash data were
obtained from the same 24 study intersections examined in the
operational and conflict studies. Specifically, crash data were
obtained for each of the following eight geographic regions
of the United States (three intersections per geographic loca-
tion): College Station and Dallas, Texas; Portland, Oregon;
Seattle, Washington; Detroit, Michigan; Cupertino, Califor-
nia; Dover, Delaware; and Orlando, Florida. The crash data
were requested for the most recent 3 years.
The second source of crash data was from the network of
volunteers identified through the Agency Survey. Without
exception, these data represented the circular green permis-
sive display (as allowed in the MUTCD).
For the third source of crash data, the research team evalu-
ated the database created in 1988 as part of a previous FHWA
study of PPLT displays (23). This third source of data was
identified as a potential source of historical data, in that some
of those intersections were thought to still be in operation as
they were in 1988. The research team intended to use the
information in the database as additional analysis locations
and thus as new data points or for comparative analysis. It
was later determined that none of the intersections in the data-
base were using the same PPLT display and the same inter-
section geometry and, as a result, no further analysis of the
database was prepared.
Findings
Crash Analysis of the 24 Study Intersections
The research team calculated several different crash sta-
tistics as follows: (1) average number of crashes per year per
intersection, (2) the average number of crashes per year per
100 left-turning vehicles, (3) the average number of crashes
per year per 100,000 left-turning times opposing through
vehicles, and (4) the average rate for the intersection based
only on left-turn crashes. The findings of these analyses are
presented below.
•
The analysis of the average crash rate per year indicated
that the four-section (dual indication) flashing circular
yellow indication used in Seattle experienced the fewest
number of crashes (per year) at 0.75. The highest aver-

50
age crash rate per year occurred in Oakland County,
Michigan. Ranking by city is summarized in Table 3-4.
•
An analysis of average crashes per 100 left-turning
vehicles indicated again that the flashing circular yellow
indication used in Seattle was the lowest. The highest
average statistic was 2.29 in College Station, Texas,
which had a circular green indication. Ranking by city
is summarized in Table 3-5.
•
An analysis of the average crashes per [100,000 left-
turning vehicles multiplied by opposing through vehi-
cles] indicated yet again that the flashing circular yellow
indication used in Seattle had the lowest statistic and
that the circular green indication in College Station had
the highest statistic. Ranking by city is summarized in
Table 3-6.
•
An analysis of the average left-turn crash rate by inter-
section indicated that Cupertino, California, had the low-
est average at 0.28. The highest average crash rate by
intersection was College Station, Texas, at 0.70. Rank-
ing by city is summarized in Table 3-7.
In the aggregate, the crash analysis findings show that the
PPLT displays studied did not perform consistently within a
selection of four crash statistics. The ranking of one crash
statistic did not match that of another crash statistic. Two par-
ticular displays, the flashing circular yellow indication used
in Seattle and the circular green indication used in College
Station, did rank similarly among most of the crash statistics.
Further, there was no correlation between the crash rate analy-
sis and the conflict study results in rank ordering.
Crash Analysis of the Intersections Identified
Through Volunteer Agencies
Six volunteer agencies responded to a request to supply
crash data: the City of Modesto, California; the Mississippi
DOT; the North Carolina DOT; the Texas DOT; the Wash-
ington DOT; and the Wisconsin DOT. A total of 135 inter-
sections of crash data were received, of which 120 intersec-
tions were used in the analysis. These crash data represented
a total of 284 intersection approaches using PPLT control.
All of these intersections used the five-section cluster or five-
section vertical display arrangement. The crash analysis con-
sisted of computing the average crash rate for the intersec-
tion and resulted in a rate that represents the overall average
accident rate for the PPLT design type, calculated as the aver-
age of the intersection accident rates.
In general, most of the intersections yielded results similar
to those found in Portland, Orlando, Dallas, and College Sta-
tion (locations that also use the circular green indication).
Several intersections yielded average crash rates of 1.5 and
higher (which may indicate a safety problem). No meaningful
trends were identified.
DRIVER CONFIRMATION STUDY
The driver confirmation study was conducted using fully-
interactive dynamic full-scale driving simulators located in
the Human Performance Laboratory on the University of
Massachusetts—Amherst (UMass) campus and at the Texas
Transportation Institute (TTI) at Texas A&M University. An
evaluation of the same PPLT signal displays in a static envi-
ronment was also completed at both locations to provide
TABLE 3-4 Ranking of PPLT performance based on
crashes per year
City
PPLT Indication
Crash Rate
Seattle Circular Flashing Yellow
0.75
Cupertino Flashing Red Arrow
0.83
Dover Flashing Red Arrow
0.85
Portland Circular Green
1.04
Orlando Circular Green
1.48
Dallas Circular Green
2.06
College Station Circular Green
2.53
Oakland County
Flashing Circular Red
2.92
TABLE 3-5 Ranking of PPLT performance based on
crashes per 100 left-turning vehicles
City
PPLT Indication
Crash Rate
Seattle Circular Flashing Yellow
0.47
Portland Circular Green
0.71
Orlando Circular Green
0.73
Cupertino Flashing Red Arrow
0.87
Dover Flashing Red Arrow
0.96
Dallas Circular Green
1.10
Oakland County Flashing Circular Red
1.23
College Station Circular Green
2.29
TABLE 3-6 Ranking of PPLT performance based on
crashes per [100,000 left turn opposing through vehicles]
City
PPLT Indication
Crash Rate
Seattle Circular Flashing Yellow
0.87
Cupertino Flashing Red Arrow
0.91
Orlando Circular Green
0.92
Oakland County Flashing Circular Red
1.18
Dover Flashing Red Arrow
1.85
Portland Circular Green 2.2
7
Dallas Circular Green
4.56
College Station Circular Green
6.75

51
comparison data to the simulator experiment as well as to the
photographic driver study.
Objective
The objective of the driver confirmation study was to eval-
uate drivers’ comprehension of the most promising types of
PPLT signal displays using full-scale driving simulators. The
following sections summarize the development and adminis-
tration of the driving simulation experiment and the follow-
up static evaluation completed at both universities.
Signal Displays Studied
The previous research activities were used collectively to
identify the displays studied in this research task. Following
lengthy and detailed discussions of study results, the research
team and project panel identified 12 PPLT signal displays for
further evaluation. The selected displays differed in permis-
sive indication, display face, location, and through movement
indication. Each of the PPLT signal displays included only
the circular green indication and/or flashing yellow arrow
permissive indications.
The flashing red permissive indications and the circular
yellow permissive indication were not evaluated in this effort.
The flashing red arrow and circular red indications were
eliminated by the project panel from future consideration
after much discussion with the research team because of the
message that these indications presented (i.e.,“stop, then pro-
ceed if a gap is available” rather than the more typical PPLT
“proceed if a gap is available” message). Additionally, the
flashing permissive red indications may dilute the meaning
of other red stop indications. The circular yellow indication
was eliminated because the flashing yellow arrow display
had nearly the same level of driver comprehension and the
flashing yellow arrow could be applied to either left- or right-
turn treatments.
The circular green permissive indication represented the
current state of the practice, and the flashing yellow arrow
permissive indication represented the most promising alter-
native, based on study findings to date and panel recommen-
dations. Figure 3-14 illustrates the PPLT displays evaluated
in the driving simulation experiment.
As shown in Figure 3-14, the research team included a
unique PPLT display that was currently in operation in Sparks,
Nevada. This “Sparks Display” uses an exclusive left-turn
signal display (five-section cluster) and simultaneously illu-
minates the circular green indication and the flashing yellow
arrow indication during the permissive left-turn interval. In
this application, the flashing yellow arrow indication is sup-
plemental information to the circular green indication.
Simulator Environment
Similar driving simulators at UMass and TTI were used
to complete the experiment. The two simulators are briefly
described below.
A fixed-base, fully interactive dynamic driving simulator,
housed in the Human Performance Laboratory on the UMass
campus, was used to complete the driving simulation exper-
iment. The vehicle base of the driving simulator is a 1995,
four-door Saturn sedan. Drivers can control the steering, brak-
ing, and accelerating similar to the actual driving process; the
visual roadway adjusts according to the driver’s actions. Three
separate images were projected to create the “visual world”
on a large semi-circular projection screen creating a field-of-
view that subtends approximately 150 deg. The simulator
also featured a surround audio system, a 60-Hz refresh rate,
and a resolution of 1024 x 768 dots per inch. The UMass
driving simulator is pictured in Figure 3-15.
At TTI, the apparatus used for the experiment was a driving
environment simulator (DESi). Almost identical to the UMass
simulator, DESi consisted of three white screens 2.28 m (90 in)
in height and width, a 1995 Saturn SC2 complete vehicle,
three image-generation personal computers, one data collec-
tion personal computer, and three liquid crystal display Prox-
ima 6810 projectors. The three separate images projected
onto the screens were aligned so they appeared to the driver
as one single image covering a 150-deg field of view hori-
zontally and a 50-deg field of view vertically. Consistent with
the UMass simulator, participants sat in the center of the DESi
in the driver’s seat of the Saturn, from which they could con-
trol the steering, braking, and accelerating similar to the
actual driving process. The TTI driving simulator is pictured
in Figure 3-16. Figure 3-17 depicts a typical PPLT intersec-
tion in the UMass driving simulator experiment.
Simulator Study Methodology
Each driver was presented with a practice course before
the execution of the actual experimental modules. The prac-
tice course was provided to familiarize the driver with the
simulator environment. Oral communication between the
TABLE 3-7 Ranking of PPLT performance based on
average left-turn crash rate
City
PPLT Indication
Crash Rate
Cupertino Flashing Red Arrow
0.28
Dover Flashing Red Arrow
0.29
Dallas
Seattle
Circular Green
Circular Flashing
Yellow
0.34
0.3
4
Oakland County Flashing Circular Red
0.44
Orlando Circular Green
0.49
Portland Circular Green 0.52
College Station Circular Green
0.70

52
Scenario
a
b
1, 2
3, 4
5, 6
7, 8
9, 10
11, 12
Lens Color
and
Arrangement
Left-Turn Indication
Protected
Mode
Permitted
Mode
i:\projfile\2
036\cdrfiles\figures\Figu
re_3-5.cdr
R
YY
GG
R
YY
GG
G
GGG
GG
GG
YY
Y
Y
GG
G
YY
Y
Y
or or or
RR
R
R
G
Y
Y
YY
Y
GG
G
G
R = RED Y = YELLOW G = GREEN = FLASHING YELLOWY
1, 3, 5, 7, 9, 11 -GB through indication; 2, 4, 6, 8, 10, 12 - RB through indication
a
b
The indication illuminated for the
g
iven mode is identified b
y
the color letter
Figure 3-14. PPLT displays evaluated in driver simulator experiment.

53
research team and the driver was avoided. Therefore, drivers
navigated through the modules by using guide signs provided
on each intersection approach. In addition, drivers were asked
to observe speed limit signs (30 mph), providing a higher
level of realism and speed control during the experiment. The
driving portion of the experiment, including the practice
module, required between 15 and 20 min to complete.
Drivers’ response to each PPLT signal display scenario
presented was recorded manually as correct or incorrect by
two members of the research team. Incorrect responses were
further classified as being fail-safe or fail-critical. A fail-safe
response was one in which the driver did not correctly
respond to PPLT signal display but did not infringe on the
right-of-way of the opposing traffic. A fail-critical response
was an incorrect response in which the driver incorrectly
responded to PPLT signal display and impeded the right-of-
way of opposing traffic, creating the potential for a crash.
Throughout the study, drivers were asked to express their
thoughts out loud about anything they observed. Research
team members were present to record the results of the sim-
ulation, including responses at each intersection and other
driving-related factors such as indecision, unnecessary brak-
ing, or pertinent verbal comments. Each experiment was
recorded on videotape allowing the researchers to verify
and review the manually collected data.
Opposing Traffic
Each of the PPLT signal displays was evaluated with oppos-
ing traffic at the intersection. The introduction of opposing
traffic required drivers to evaluate simultaneously the PPLT
signal display, traffic movement, and opposing gaps to com-
plete a safe permissive left-turn maneuver. This methodology
was used to replicate the decision process required during
actual operation of a motorized vehicle within the roadway
system.
All gaps in opposing traffic were consistently applied at
intersections where drivers were required to make a permit-
ted left-turn maneuver. Six opposing vehicles were used.
Two vehicles were always positioned at the stop bar in the
two through lanes opposing the left-turn driver. The remain-
ing four were positioned further upstream in a specified gap
sequence. Gaps were set at 3 and 7 sec in a series of 7-3-7-7;
therefore, opposing vehicles crossed the intersection 7, 10,
17, and 24 sec behind the two initially queued opposing vehi-
Figure 3-15. UMass Human Performance Laboratory driving simulator.

54
cles. The critical gap concept was used to select the gap sizes.
The Highway Capacity Manual indicates that a critical gap
value of approximately 5.5 sec for permitted left-turn maneu-
vers in the design of a four-lane roadway is acceptable (16).
Therefore, a 3-sec gap was selected because it was small
enough that most drivers will not accept it, and a 7-sec gap
was selected because it was generally acceptable to most driv-
ers. Providing a consistent sequence of 3- and 7-sec gaps
prevented gap selection from being a significant variable in
the PPLT analysis.
The only difference in the driving simulator experiments
at UMass and TTI was the initial method of introducing
the opposing traffic. For simplification, the methods will be
referred to as the Release Method of Opposing Traffic (RMOT)
and the Continuous Method of Opposing Traffic (CMOT).
The RMOT is the methodology described above. A trigger
in the simulator model, similar to that used to change the sig-
nal indications, was placed near the left-turn stop bar at each
PPLT intersection to release the opposing traffic. By placing
the opposing traffic release trigger approximately 5 ft from
the stop bar, left-turn drivers were required to make a decision
as to the meaning of the PPLT signal indication and desired
action before knowing the actions of the opposing traffic.
At TTI, the research team explored the effects of a slightly
different opposing vehicle method. A total of 116 drivers
completed the experiment, which used the CMOT traffic. The
CMOT method of opposing traffic had the opposing traffic
moving as the driver approached the intersection. All gaps in
opposing traffic were consistent with the RMOT method and
applied at each intersection where drivers were required to
make a permitted left-turn maneuver.
The opposing traffic consisted of three vehicles. As the
driver approached the intersection, a trigger in the simulation
located approximately 400 ft upstream of the left-turn stop bar
released the opposing traffic. At this time, the first opposing
vehicle was located approximately 950 ft downstream of the
driver. The opposing vehicle was set to match the speed of
the driver. In this setup, the first opposing vehicle approached
the intersection, almost mirroring the driver so that they
reached the intersection at approximately the same time. The
next two vehicles followed the initial opposing vehicle 3 and
10 sec after the first vehicle; therefore, the driver observed a 3-
and a 7-sec gap after the initial opposing vehicle had passed.
Using two methods of opposing traffic allowed for an eval-
uation of opposing traffic impacts on driver comprehension
of PPLT signal displays. To determine the geographical
Figure 3-16. TTI driving environment simulator (DESi).

55
effects of drivers in the simulated environment, the last 93 driv-
ers at TTI completed the experiment observing the RMOT
opposing traffic. Therefore, experimental methodology and
the information observed by drivers in the simulation were
identical.
Video-Based Static Evaluation
After completing the driving portion of the study, drivers
were asked to participate in a static evaluation of PPLT
signal displays. The static evaluation was administered
using videocassette recordings of the screen captures for
the 12 PPLT displays. The driver was shown each display
for 30 sec and asked to choose one of four responses to the
traffic signal displays. Similar to the earlier Photographic
Driver Study research effort, the four potential responses
were as follows:
•
Go, you have the right-of-way.
•
Yield, then go if a gap in the opposing traffic exists.
•
Stop first, then go if a gap in the opposing traffic exists.
•
Stop and wait for the appropriate signal.
Once drivers responded with one of the four possible
choices, they were asked to indicate their confidence in the
answer. Additionally, any comments made by the drivers
regarding the displays were manually recorded.
Confirmation Study Sample Size
The approved research plan stipulated that 400 drivers
complete the driving simulator experiment, of which 200
subjects would be tested at UMass and 200 subjects would
be tested at TTI. To represent the general driving population,
four age groups of drivers were identified. In addition, an
attempt was made to include an equal number of male and
female drivers and a range of educational and ethnic back-
grounds. A total of 464 drivers participated in the study, of
which 432 completed all experimental elements, yielding
4,613 individual evaluated PPLT scenarios (5,230 PPLT sce-
narios with the static evaluation).
Of the 432 participants who completed the study, the data
for 316 became the focus of the report findings. The 316
drivers were a combination of the UMass drivers along with
the TTI drivers who completed the experiment using the pre-
viously described RMOT method.
Confirmation Study Findings
Driver comprehension was determined from the distribution
of correct and incorrect responses for each of the selected
PPLT signal displays. Several categories of incorrect responses
were used to further evaluate these data. Analysis of variance
(ANOVA) statistical techniques were used to analyze all col-
lected data to evaluate drivers’ comprehension related to the 12
selected PPLT signal displays.
Left Thru Thru
Driver Movement: Permitted Left
Figure 3-17. Screen capture of typical intersection in simulator at UMass.

56
Driving Simulator Findings
Based on analysis of the 316 (223 at UMass and 93 at TTI)
driver evaluations (3,402 displays) that were obtained in a
procedurally equivalent manner, several key findings were
made. These findings are presented below as they relate to
geographical effects comparing drivers from Massachusetts
and Texas, effects of display type, driver demographics, first-
time reactions, and learned behavior.
Statistical comparisons were made to evaluate whether
there were detectable geographic effects between drivers in
Texas and Massachusetts. When considering the 12 experi-
mental PPLT signal displays in each geographic location,
there were no statistically significant differences between
locations. Because no statistically significant differences were
found between drivers from Texas and Massachusetts, the
two databases were combined for further analysis.
With respect to display type, the following findings were
then made:
•
In the aggregate, the data showed a high level of com-
prehension with no variation between the different
PPLT displays tested. Drivers responded correctly 91%
of the time with no statistical difference between the 12
PPLT displays
•
The percentage of correct responses showed no statistical
difference in driver comprehension when the data were
cross-analyzed by permissive indication, display arrange-
ment, through indication, and location of the display.
•
There was no statistical difference in the percentage of
correct responses between permissive indication (circular
green indication, flashing yellow arrow, circular green
indication/flashing yellow arrow), signal display arrange-
ment (five-section cluster, four-section vertical, or five-
section vertical), PPLT display location (shared or exclu-
sive), or adjacent through indication (circular green
indication or circular red indication). Additionally, there
were no significant differences by the various PPLT dis-
play components in terms of the percentage of fail criti-
cal responses.
Demographic factors such as sex, age, driver experience,
and education were all expected to influence driver under-
standing of the PPLT displays. When evaluated on the basis
of demographic effects, the following findings were made:
•
The data showed that the overall level of correct responses
to each permissive indication was not significant when
analyzed by sex, age, number of miles driven annually,
or education.
•
Combined analysis of the data showed an interaction
effect between sex and age. In this analysis, there was a
statistically significant difference between the three age
groups (ages under 24, ages 24–45, ages over 45) within
the female drivers and the percentage of correct responses.
•
There were no statistically significant differences in the
percentage of correct or fail critical responses for the sex
demographic across the 12 PPLT signal displays evalu-
ated. Males and females had statistically equivalent lev-
els of comprehension.
•
Considering failure responses, the age demographic
resulted in statistically significant differences. Drivers
over the age of 45 had significantly fewer fail critical
responses. Overall, older drivers were more cautious in
the driving simulator experiment, often opting to wait for
all opposing vehicles to pass before completing the per-
missive left-turn maneuver.
•
Drivers who had driven between 10,000 and 20,000
miles in the previous year had significantly more correct
responses and significantly fewer fail critical responses
than those who drove fewer than 10,000 miles in the
previous year.
•
Education level of the drivers was not statistically sig-
nificant in determining comprehension levels in terms
of the percentage of correct responses. However,
PPLT Scenario 3 (five-section cluster in a shared loca-
tion with a flashing yellow arrow permissive indica-
tion and circular green through indication) was com-
prehended significantly more by drivers with only a
high school diploma than drivers with a higher educa-
tion level.
Another area of interest in evaluating drivers’ responses to
the PPLT displays presented in the simulator environment
was the manner in which drivers responded the first time they
were presented a given PPLT display. Such an evaluation
was expected to provide insight as to the intuitive nature of
the PPLT display(s). In addition, comparison of results for
the same driver reacting to each permissive indication were
reviewed to assess whether any detectable learning occurred
as they proceeded through the virtual world. Each of the
PPLT signal displays was equally likely to be the first PPLT
display evaluated because of the balanced design of the
experiment. Consequently, each of the 316 drivers in this
dataset had an equally likely chance of observing any of the
12 PPLT signal displays first. Findings of the evaluation
include the following:
•
Analysis of the first observed PPLT display encountered
by each of the 316 drivers determined that the number
of correct responses was not significantly different across
the 12 PPLT signal displays.
•
When reviewing driver responses to the first observed
PPLT signal display, there were significantly more fail
critical responses when using the five-section cluster in
a shared location with a flashing yellow arrow permis-
sive indication and circular green through indication
than when using a five-section cluster in a shared loca-

57
tion with a circular green permissive indication and cir-
cular green through indication.
•
It was noted that the five-section cluster with circular
green permissive indication and circular green through
indication has been commonly used in both Massachu-
setts and Texas, and it was deemed reasonable to assume
that drivers had encountered this display prior to partic-
ipating in the experiment.
Static Evaluation Findings
Based on analysis of 436 driver evaluations (5,230 dis-
plays), the findings of the video-based static evaluation exper-
iment included the following:
•
Overall driver comprehension was high—83% of 5,230
scenarios were evaluated correctly.
•
The permissive indication resulted in statistically sig-
nificant differences of correct and fail critical responses.
In contrast to the previously described driver simulator
findings, displays with the flashing yellow arrow permis-
sive indication and the circular green/flashing yellow
arrow simultaneous permissive indication had signifi-
cantly more correct responses than displays with the cir-
cular green permissive indication. Displays with the cir-
cular green permissive indication were associated with
significantly more fail critical responses than displays
with either the flashing yellow arrow or circular green/
flashing yellow arrow permissive indications.
•
PPLT displays with the four-section vertical display face
had a significantly greater number of correct responses
compared with the five-section vertical and five-section
cluster displays. However, only the flashing yellow arrow
permissive indication was evaluated in this display face,
and it is likely this combination that accounts for the
increased percentage of correct responses.
•
Scenarios that contained circular red indications in the
through movement signal heads resulted in a signifi-
cantly lower percentage of correct responses to the PPLT
displays than when the circular green through indica-
tions were presented. PPLT displays associated with the
circular red through indication also resulted in signifi-
cantly more fail critical responses. The research team
considered the lower correct response rate to result from
unfamiliarity. It is not common to use a permissive
green indication for the left-turn lane and a red indica-
tion for the through movement. This demonstrated again
that simultaneously displaying conflicting indications
causes confusion.
•
The location of the PPLT signal display (whether it was
a shared or an exclusive display) did not result in statis-
tically significant differences in correct responses.
•
In contrast to the previously described driver simula-
tor findings, statistically significant differences were
observed within age, education, and driving experience
demographics. Drivers over the age of 45 had a signifi-
cantly lower comprehension of the PPLT signal displays.
Drivers with only a high school diploma had a signifi-
cantly lower comprehension than drivers with a higher
education level. Interestingly, those who drove between
10,000 and 20,000 miles in the previous year had sig-
nificantly more correct responses than those who drove
fewer than 10,000 miles and those who drove over 20,000
miles the previous year.
Driving Simulator and Static Evaluation
Comparison Findings
The results of both the driving simulator and static eval-
uation were compared for each driver and for all drivers
combined. This analysis was completed to see how basic
driver comprehension (as demonstrated by the static evalua-
tion) compared with driver actions when presented the same
signal display scenario, but with the addition of all of the
dynamic elements associated with driving. Combining the
results of both the driving simulator experiment and video-
based static evaluation led to the following conclusions:
•
Driver comprehension in the simulator experiment was
significantly higher than the static evaluation. The results
validate two important beliefs:
– Driver decision making during a left-turn maneuver
incorporates much more than comprehension of the
PPLT display. In fact, drivers often based their deci-
sion on opposing vehicle movements rather than the
PPLT display. Drivers who do not completely com-
prehend the meaning of the PPLT display use other
available information to make their decision.
– What drivers say they will do (based on comprehen-
sion of the PPLT display alone) and what they actu-
ally do in the driving environment are not always
consistent.
•
The biggest inconsistencies occurred for displays with
the circular green permissive indication. In the simula-
tor experiment, the four scenarios with the circular green
permissive indication resulted in fail critical responses
6% of the time. By contrast, the same four scenarios in
the static evaluation resulted in fail critical responses
19% of the time. Drivers are confused by the circular
green indication and often assume it provides right-of-
way during the permissive left-turn interval. This lack
of comprehension is not directly reflected in left-turn
crash statistics, because drivers compensate for com-
prehension deficiencies by considering other informa-
tion, such as following the lead vehicle, gauging oppos-
ing traffic, and choosing acceptable gaps.
•
In the simulator experiment, the through indication had
little effect on driver comprehension, while in the static

58
evaluation, the circular red through indication resulted
in lower comprehension levels. Based on driver com-
ments throughout the entire experiment, drivers often
did not observe the through indication in the simulator
but noticed the through indication in the static evalua-
tion. This behavioral pattern was explainable, because,
in a pure evaluation of comprehension, drivers search
for all available information. The only information in
the static evaluation was the left-turn and through indi-
cation. Therefore, if the driver was unsure about the
meaning of the left-turn indication, he or she used the
through movement and prior experiences in order to
decide how to act. Many times, this practice still led to
an incorrect response.
•
Comparing all types of responses in both of the experi-
ments, it can be said that many drivers base their left-turn
decision on surrounding traffic, specifically the opposing
traffic, instead of the signal indication. This was shown
to result primarily from a lack of driver understanding
of the indication. Under experimental conditions, sev-
eral drivers made left-turn decisions without any con-
sideration of the PPLT display.
Implications of Driver Comprehension Study
Findings
Collectively, the study data showed a high level of com-
prehension with no variation between the different PPLT dis-
plays tested. There was no statistical difference in driver com-
prehension when the data were cross-analyzed by permissive
indication, arrangement, through indication, and location of
the display. The lack of significant differences documented in
this study is in itself a significant finding. Given that the con-
firmation studies found no difference in display types, there is
evidence to suggest that the PPLT indication is only one of
many elements that the driver takes into account when mak-
ing left-turn decisions. This result also explains why low level
of comprehension related to the circular green permissive
indication is not consistent with left-turn crash frequencies.
FIELD IMPLEMENTATION STUDY
To address the lack of real-world applications of the flash-
ing yellow arrow PPLT display, the project panel approved
the study of the flashing yellow arrow display in the field as
part of the NCHRP 3-54 (02) amended study. The project
panel thought that this task was needed before such a display,
if deemed “best understood,” could be recommended to the
NCUTCD.
Objective
The objective of the field implementation study was to doc-
ument the implementation of the flashing yellow arrow dis-
play, associated technical and non-technical issues, and safety
and cost implications associated with implementing this dis-
play. The following sections summarize the development and
administration of the implementation study, the field data col-
lected, and the results.
Methodology
The field implementation study was initiated, at the request
of the project panel, to collect actual field data on the flash-
ing yellow arrow display. The implementation study collected
before and after data relevant to the implementation of a
flashing yellow arrow PPLT display (e.g., conflict data) to
record the safety performance associated with the flashing
yellow arrow display. The implementation study also collected
field operational data, such as start-up lost time and satura-
tion flow rate data, to quantify the operational impacts. The
implementation study monitored field installation by the oper-
ating agency and documented techniques as well as the issues
resolved (e.g., control logic) for successful implementation
to be achieved. In addition, agency assistance was sought to
help quantify other implementation issues, such as field per-
sonnel reaction, as well as labor, hardware, and software costs.
The following sections discuss background information on
how the study locations were identified and what was required
of the volunteering agencies and the research team.
Implementation Plan
The research team sought the participation of volunteer
agencies on a national basis. In August 2000, the research
team issued a Request for Proposal for an Implementation
Plan for submittal to volunteer agencies, identifying the proj-
ect goals and objectives, project requirements, and responsi-
bilities of both the volunteer agencies and the research team.
A copy of the Implementation Plan is included in Working
Paper No. 8 on the accompanying CD-ROM.
The research team was very specific about the characteris-
tics of the study and control intersections, as well as the dis-
play that would be used in the implementation study.
Each volunteer agency implementing the flashing yel-
low arrow display was required to first request (and receive)
approval for experimentation of a traffic control device
though FHWA.
Characteristics of Study Intersections
The intersections selected for evaluation currently oper-
ated PPLT signal phasing and were considered typical inter-
sections containing no unique geometric or operational fea-
tures. Specific features sought in study intersections included
the following:

59
•
Right angle intersections with four approaches,
•
Exclusive left-turn lane(s) on the study approach,
•
Current use of the green arrow indication for the pro-
tected left-turn movement, and the circular green indi-
cation for the permissive left-turn indication
•
Relatively flat approach grades,
•
Lane widths of 12 ft,
•
No on-street parking, and
•
No other variables that directly affect the left-turn move-
ment being evaluated.
Each agency that volunteered to participate in the study was
asked to identify at least three intersections for improvement
(i.e., installation of the new flashing yellow arrow PPLT sig-
nal display). An additional three intersections were identified
within each study region that did not receive any improve-
ments during the study period. These intersections served as
control sites. Therefore, at least six study sites were requested
at each study region (study regions sometimes involved mul-
tiple agencies).
Proposed Flashing Yellow Arrow Display Face
The research team, in partnership with project panel and
Technical Advisory Group members, identified several dis-
play faces that research demonstrated as having good driver
understanding. Four possible PPLT signal displays were rec-
ommended for installation of the flashing yellow arrow dis-
play at locations where there was an exclusive left-turn lane,
and the left-turn display was an exclusive display (not used by
the adjacent through movements). Those alternative displays
are shown in Figure 3-18 below. As shown in Figure 3-18, the
display could be implemented in four different configura-
tions, using three or four sections and horizontal or vertical
alignments. The three-section display options involve shared
use of a bi-modal section by the green and flashing yellow
arrows. The three-section display face may be desired for
clearance purposes or for ease of implementation, if an exist-
ing three-section display face is available. The signal display
face could be mounted either vertically or horizontally.
In the exclusive display application, one, and only one, of
the four arrows was illuminated at any time. The flashing yel-
low arrow was illuminated during the permissive phase when
traffic could turn after yielding to opposing through traffic
and/or pedestrians. The other three arrows were used for the
normal three-color exclusive left turn display. The red arrow
indication was displayed when a left-turn movement was pro-
hibited. The green arrow indication was displayed when the
left-turn movement could be made with no conflicting simul-
taneous vehicle or pedestrian movement (protected operation).
The steady yellow arrow indication was illuminated for a few
seconds as a clearance indication following both the green
arrow indication and the flashing yellow arrow indication.
Implementation Study Findings
Participating Agencies
Beginning in August 2000, the research team contacted
over 35 agencies from across the United States. Of those 35
agencies, 9 submitted a request to FHWA for experimenta-
tion of the flashing yellow arrow display. Two of those nine
study implementation locations withdrew from participation
because of controller logic issues or implementation proce-
dures not consistent with the project objectives.
1. 2. 3.
4.
Indicates Flashing
Figure 3-18. Exclusive flashing yellow arrow display faces.

60
The first agency to respond to the volunteer solicitation was
Montgomery County, Maryland. In September 2000, Mont-
gomery County implemented the flashing yellow arrow dis-
play at three intersections. Maryland’s participation in the
implementation study was subsequently followed by other
agencies as summarized in Table 3-8.
Other Agency Participation
In addition to the agencies listed in Table 3-8 that have
implemented the experimental flashing yellow arrow dis-
play, three other agencies requested and received FHWA
approval to participate in the study. Two of the agencies were
ultimately unable to participate and one agency was not able
to implement within the time frame allotted to the research
project; further details are as follows:
•
The City of Kennewick, Washington, received FHWA
approval to implement and planned to do so by October
2001, but later withdrew from the study because of sig-
nal controller complications that could not be resolved
to the city traffic engineer’s satisfaction.
•
The City of Carson City, Nevada, submitted its request
for implementation to FHWA; however, the proposed
implementation included a supplemental sign explaining
the meaning of the flashing yellow arrow display. After
discussions with the research team, it was decided that
FHWA would approve the installation if the supplemen-
tal sign was dropped from the implementation. As the
completion of the research project approached, Carson
City had not responded to FHWA and it remained unclear
how or if the City would proceed with implementation.
•
Snohomish County, Washington, received FHWA
approval for implementation and planed to implement at
one intersection; however, implementation was delayed
by traffic signal controller software issues that were not
resolved by the software manufacturer prior to comple-
tion of the research project.
Summary of Field Implementation Locations
Montgomery County, Maryland. Montgomery County
implemented the flashing yellow arrow display in September
2000 at three intersections. A four-section vertical all-arrows
display was used. The flashing yellow arrow indication was
tied to the opposing through green indication. The County
used Econolite NEMA controllers for local intersection man-
agement, and implementation required special external logic.
The County did not issue a media press release prior to imple-
mentation but did use variable message signs in advance of
the intersections for a period of 48 hr. The County has had
minimal citizen feedback during the more than 2 years of
deployment.
Tucson, Arizona. The City of Tucson, Arizona, was the
only agency to implement and then discontinue use of the
flashing yellow arrow display. The City implemented flash-
ing yellow arrow on May 30, 2001, at two intersections,
replacing PPLT displays with a five-section vertical display
face. The City of Tucson used the flashing yellow arrow for
their right-turn overlaps for more than 10 years without any
problems. The City’s local intersection management soft-
ware was used with Econolite ASC/2 controllers. The City
used an external flashing circuit tied to the flashing yellow
arrow indication, which did not conflict with the controller’s
conflict monitor.
Within 1 week of implementation of the flashing yellow
arrow, there was a crash at one of the study intersections. The
city manager directed the city traffic engineer to rescind par-
TABLE 3-8 Summary of implementation study sites
Agency Implementation Date
Number of
Implementation Sites
Montgomery County, Maryland September 2000
3
City of Tucson, Arizona May 2001
3
Jackson County, Oregon May 2001
1*
Oregon Department of Transportation June 2001
2
City of Beaverton, Oregon April 2002
3
Broward County, Florida June 2002
3**
*One site in Jackson County met the NCHRP 3-54 study requirements. The County implemented non-conforming
displays at five other locations in the County with FHWA approval.
**In September 2002, Broward County received approval from FHWA to implement the flashing yellow arrow display
at two additional intersections bringing the total number of flashing yellow arrow implementation sites to five.

61
ticipation in the implementation study. The flashing yellow
arrow was not reported to be directly linked to the cause of the
crash. Based on feedback from the operations engineer, the
intersection operations performed well during the time that
the flashing yellow arrow display was in effect. The flashing
yellow arrow display continues to be used for the right-turn
overlap movements, as it has for more than 10 years.
Jackson County, Oregon. Jackson County, Oregon, pur-
sued a different path with its implementation of the flashing
yellow arrow display. The county traffic engineer for Jackson
County approached the research team to implement the flash-
ing yellow arrow display in the county. The County had only
one intersection that could be converted from existing PPLT
to the flashing yellow arrow display that met the research proj-
ect’s requirements. The County submitted the FHWA request
for experimentation and it was approved by FHWA. The sin-
gle intersection began operating with a flashing yellow arrow
display using a four-section all-arrow vertical display face.
Since initial implementation in 2001, Jackson County
converted five existing exclusive (protected only) left-turn
operations to PPLT control with a flashing yellow arrow dis-
play. However, in these installations, the County used a three-
section vertical display face—the center indication was used
for the yellow arrow clearance (following the circular green
indication) and the flashing yellow arrow (permissive period)
indication. The County pursued this approach to eliminate
the costs of a new display face (four-section) and running
additional wire cable and to address vertical clearance issues.
The County submitted a request to FHWA for approval to
implement the three-section arrangement of the flashing yellow
arrow display. The request was originally denied by FHWA
but later approved by FHWA after FHWA staff reviewed
video of the intersection showing the operation. The video
showed the adjacent through signals going to yellow at the
same time as the flashing yellow arrow changed to a steady
yellow arrow in the same section. The ability of left-turn driv-
ers to see the through signals changing to yellow made it less
necessary for the change from the flashing yellow arrow to
the steady yellow arrow to be positional. Accordingly,
FHWA issued a letter authorizing the County to implement
the three-section PPLT flashing yellow arrow display. Fig-
ures 3-19 and 3-20 illustrate Jackson County’s retrofit of a
three-section display and the corresponding operation of the
signal.
The County received very positive feedback from the local
police department and citizens. The County’s local inter-
section management was a Type 170 controller with Wapiti
W4IKS firmware. Special command box logic was required
to implement the flashing yellow arrow indication.
Woodburn, Oregon. The Oregon Department of Trans-
portation (ODOT) implemented the flashing yellow arrow
display in June 2001 at two intersections in Woodburn, Ore-
gon. A four-section vertical all-arrows display was used. The
local intersection management was a Type 170 controller
with Wapiti W4IKS firmware. Special command box logic
was required to implement the flashing yellow arrow indica-
tion. ODOT and the local City government (City of Wood-
burn) staff reported receiving minimal public feedback regard-
ing the flashing yellow arrow displays.
Beaverton, Oregon. The City of Beaverton, Oregon,
implemented the flashing yellow arrow display at three study
locations in April 2002 after having been granted authority
to implement the flashing yellow arrow display from the City
Traffic Commission and the Mayor’s office. A four-section
all-arrows display was used. The local intersection manage-
ment was controlled by a Type 170 controller with Wapiti
W4IKS firmware. Special command box logic was required
to implement the flashing yellow arrow indication. The City
was able to use the same basic logic developed by ODOT for
the Woodburn site in their implementation. At the time this
report was prepared, no problems had been experienced at
the intersections.
Broward County, Florida. Broward County was first
approached by the contractor to implement the flashing yel-
low arrow display in May 2000. It was not until May 2002
that the County implemented the experimental display. This
2-year relationship between the contractor and implementing
agency is an example of the many challenges that agencies
faced in participating in this study as well as making future
changes. Implementation in Broward County was delayed by
many factors, most of which could be attributed to limited
County staff resources (time) and the desire to implement a
Red Arrow (Stop)
Bi-modal Flashing Yellow Arrow (Permissive Left-Turn)
and Clearance Steady Yellow Arrow
Green Arrow (Protected Left-Turn)
Figure 3-19. Jackson County, Oregon—3-section retrofit to flashing
yellow arrow PPLT display.

62
different display from that requested by the research project
(which required an additional FHWA approval process).
Ultimately, the County implemented a five-section vertical
display, with the top two indications being a circular red indi-
cation and a circular yellow indication. The bottom three indi-
cations were all arrows with the flashing yellow arrow con-
tained in the middle section as shown in Figure 3-21. It was the
County’s desire to clear the approach with all circular yellow
indications, rather than clearing the left-turn movement with a
yellow arrow indication, as the research team proposed.
In October 2002, the County received approval from FHWA
to implement the flashing yellow arrow display at two addi-
tional intersections, bringing the total number of intersec-
tions with the flashing yellow display to five.
Conflict Analysis Findings
As part of the field implementation study effort, before and
after studies were conducted at each of the flashing yellow
arrow implementation study sites. The local jurisdiction and/or
research team members videotaped 16 hr of before/after data.
The research team reviewed the videotapes to conduct a con-
flict rate analysis.
1
6
Opposing
Through Signal
All Red
All Red
Protected Left-Turn
Change Interval
Permissive Phase
(Flashing Yellow Arrow)
Change Interval
(Steady Yellow Arrow)
2
3
4
5
Indicates Flashing
Figure 3-20. Operation of Jackson County, Oregon’s 3-section flashing yellow arrow
PPLT display.

63
The before and after conflict analysis focused on conflicts
and events specifically related to the left-turn signal display.
This typically included driver hesitation on a permissive indi-
cation (circular green indication or flashing yellow arrow) or
driver hesitation on a protected indication (green arrow).
Driver hesitation in either instance provided an indication
about drivers’ comprehension of the presented indication.
Left-turn conflicts, such as a driver failing to yield the right
of way to opposing traffic on a permissive indication, were
also observed because such conflicts provided the research
team with additional information about drivers’ comprehen-
sion of the particular left-turn indication. Although many con-
flicts were observed, this analysis focused on only those
related to the left-turn signal display. The results of the con-
flict analysis are shown in Tables 3-9 and 3-10 for the before
and after analysis periods, respectively.
As shown by the two tables, there was little notable dif-
ference in the before and after conflict rate and no difference
that could be attributed to the change in PPLT display.
Follow-up headway information and corresponding flow
rate were also evaluated for the permissive left-turn move-
ments. The headways between queued permissive left-turn
vehicles selecting the same gap in opposing traffic were
determined from the field videos. Tables 3-9 and 3-10 also
show the follow-up headway findings. At many intersec-
tions, few instances with two permissive left-turns being
made in the same gap were observed, and the corresponding
headway and flow rate information is based on only a small
sample size. Based on the data available, the change in PPLT
display to the flashing yellow arrow had a negligible impact
on follow-up headway. A site-by-site summary of the analy-
sis findings is documented in Working Paper 8.
Field Observations During Flashing Yellow
Arrow Activation
In addition to the before and after data collection and analy-
sis, members of the research team were present as the flash-
ing yellow arrow permissive indication was activated at six
of the site locations. The premise for these visits was to
observe whether there was any evidence of initial driver
confusion that might not be apparent from observation of the
after videos, particularly if drivers had learned the meaning
of the experimental display before the video data were col-
lected. Researchers present at the three Beaverton, Oregon,
flashing yellow arrow installation sites observed no unusual
or significant findings at the time the display was activated.
Similar results were observed at the three Broward County,
Florida, experimental sites as the flashing yellow arrow indi-
cation was activated. The observations made at the time the
flashing yellow arrow display was switched on are consistent
with both the before and after video data at these intersections,
indicating no significant difference when changing from a cir-
cular green to a flashing yellow arrow permissive indication.
The research team conducted on-site observations of flashing
yellow arrow operation used in Montgomery County, Mary-
land, and Woodburn, Oregon. Conditions similar to those in
Beaverton, Oregon, and Broward County, Florida, were
observed.
Post-Implementation Survey of Volunteer
Agencies
A post-implementation survey was administered to the
agencies that participated in the implementation study. The
survey sought to identify issues that had to be dealt with to
implement the flashing yellow arrow display, the cost to the
agency to implement the flashing yellow arrow display, and
whether there was support within the agency and outside the
agency for the flashing yellow arrow display.
Overall, each of the participating volunteer agencies expe-
rienced favorable results with the flashing yellow arrow dis-
play implementation. The most commonly reported problem
was overcoming the current design of controllers and conflict
monitors. In all cases, the participating agencies had to use
either internal logic (e.g., command box in the Wapiti firm-
ware for the Type 170 controller) or some type of external
logic or relay device to implement the flashing yellow arrow
display. These changes were necessary because the permis-
sive flashing yellow arrow and circular green through move-
ment indications could not illuminate simultaneously (prior
to conversion, the circular green indication was used to com-
municate both the through and permissive movements). It is
assumed that new controller software and any significant
upgrade of existing controller software will include this func-
tionality so that, over time, external logic will no longer be
needed. The special logic described above can be imple-
mented using a “logic box” external to the signal controller,
or with software enhancements in the signal controller.
The cost to implement the flashing yellow arrow display
was relatively low (approximately $750 for new signal heads
and about 200 staff-hours total). All agencies received sig-
12345
Clear with adjacent
through lanes
6
Indicates Flashing
Figure 3-21. Broward County flashing yellow arrow
display arrangement.

64
TABLE 3-9 Study intersection conflict data before flashing yellow arrow implementation—Page 1 of 2
GB=Circular Green Indication
GA=Green Arrow Indication
Observational Safety Analysis (Display
Based)
Event
State
Observation
Period
Location Intersection
Site
Type
PPLT
Display
Data
Source
Hours of
Video
Reviewed
Conflicts
Hesitation on
GB
Hesitation on
GA
Follow-Up
Headway
(veh/hr) /
Sample Size
Woodburn
Hwy 99 @
Hardcastle St.
Study
5-Section
Cluster
ODOT 16 0 0 0 N
A
Woodburn
Hwy 99 @ Lincoln
St.
Study
5-Section
Cluster
ODOT 17 0 1 0
1,321 (12)
Woodburn
Hwy 99 @ Young
St.
Control
5-Section
Cluster
ODOT 26 0 3 1
1,440 (10)
OR May 2001
McMinnville
Hwy 99 @ Baker
Creek Rd.
Control
5-Section
Cluster
ODOT 22 0 2 0
1,460 (9)
Beaverton
SW Allen Blvd. @
Wilson Ave.
Study
5-Section
Cluster
UMass 23 0 2 3
1,545 (40)
Beaverton
SW Allen Blvd. @
Menlo Dr.
Study
5-Section
Cluster
UMass 23 0 0 4
1,410 (32)
Beaverton
SW 125
th
St. @
Longhorn Ln.
Study
5-Section
Cluster
UMass 21 0 0 3
1,470 (18)
Beaverton
SW 72
nd
St. @
Bonita St.
Control
5-Section
Cluster
UMass 24 1 10 12
1,790 (35)
Beaverton
SW Oleson St. @
Vermont St.
Control
5-Section
Cluster
UMass 20 0 1 0 1,750 (25)
OR April 2002
Beaverton
NW Murray Rd. @
Science Park Rd.
Control
5-Section
Cluster
UMass 16 1 1 0
1,661 (25)
AZ May 2001 Tucson
Ajo Way @ Park
Ave.
Study
5-Section
Vertical
Tucson 24 0 0 0
1,408 (15)

65
TABLE 3-9 Study intersection conflict data before flashing yellow arrow implementation—Page 2 of 2
Observational Safety Analysis (Display
Based)
Event
State
Observation
Period
Location Intersection Site Type
PPLT
Display
Data
Source
Hours of
Video
Reviewed
Conflicts
Hesitation on
GB
Hesitation on
GA
Follow-Up
Headway
(veh/hr) /
Sample Size
Mont. Cty
Cecil St. @ E.
Gude Dr.
Study
5-Section
Cluster
County 16 0 1 0
1,925 (64)
Mont. Cty
E. Randolph Rd @
Fairland Rd.
Study
5-Section
Cluster
County 16 0 0 0
1,809 (83)
MD August 2000
Mont. Cty
Montrose Rd. @
Tower Oaks Blvd
Study
5-Section
Cluster
County 16 1 1 0
1,800 (28)
Broward Cty
Broward Blvd. @
SW 69
th
Ave.
Study
5-Section
Cluster
UMass 8 1 3 2
1,470 (77)
Broward Cty
Coral Springs Dr.
@ Wiles Rd.
Study
5-Section
Cluster
UMass 8 1 0 13
1,598 (13)
Broward Cty
Sample Rd. @
Riverside Dr.
Study
5-Section
Cluster
UMass 8 1 6 4
1,933 (17)
Broward Cty
Broward Blvd. @
SW 70
th
Ave.
Control
5-Section
Cluster
UMass 8 3 0 9
1,735 (37)
Broward Cty
University Dr. @
Wiles Rd.
Control
5-Section
Cluster
UMass 8 0 7 1
1,711 (20)
FL January 2002
Broward Cty
Sample Rd. @
Rock Island Rd.
Control
5-Section
Cluster
UMass 8 0 2 1
1,931 (21)
GB=Circular Green Indication
GA=Green Arrow Indication

66
TABLE 3-10 Study intersection conflict data after flashing yellow arrow implementation—Page 1 of 3
Observational Safety Analysis (Display
Based)
Events
State
Observation
Period Location Intersection
Site
Type
PPLT
Display
Data
Source
Hours of
Video
Reviewed Conflicts
Hesitation on
FYA
Hesitation on
GA
Follow-Up
Headway
(veh/hr) /
Sample Size
Woodburn
Hwy 99 @
Hardcastle St.
Study
4-Section
Vertical
ODOT 12 0 3 0
1,375 (15)
Woodburn
Hwy 99 @
Lincoln St.
Study
4-Section
Vertical
ODOT 12 0 1 0
1,465 (19)
Woodburn
Hwy 99 @ Young
St.
Control
5-Section
Cluster
ODOT 12 0 1 (GB) 0
1,535 (45)
OR
December
2001
McMinnville
Hwy 99 @ Baker
Creek Rd.
Control
5-Section
Cluster
ODOT 12 0 1 (GB) 0
1,962 (10)
Beaverton
SW Allen Blvd. @
Wilson Ave.
Study
4-Section
Vertical
UMass 16 0 4 0
1,650 (47)
Beaverton
SW Allen Blvd. @
Menlo Dr.
Study
4-Section
Vertical
UMass 16 0 1 0
1,415 (9)
Beaverton
SW 125
th
St. @
Longhorn Ln.
Study
4-Section
Vertical
UMass 15 0 1 0 N
A
Beaverton
SW 72
nd
St. @
Bonita St.
Control
5-Section
Cluster
UMass 20 0 6 (GB) 9
1,728 (35)
Beaverton
SW Oleson St. @
Vermont St.
Control
5-Section
Cluster
UMass 18 0 0 0
1,760 (24)
OR June 2002
Beaverton
SW Murray Rd.
@ Science Park
Rd.
Control
5-Section
Cluster
UMass 18 1 0 1
1,603 (22)
FYA=Flashing Yellow Arrow Indication
GA=Green Arrow Indication

67
TABLE 3-10 Study intersection conflict data after flashing yellow arrow implementation—Page 2 of 3
Observational Safety Analysis (Display
Based)
Events
State
Observation
Period Location Intersection
Site
Type
PPLT
Display
Data
Source
Hours of
Video
Reviewed Conflicts
Hesitation on
FYA
Hesitation on
GA
Follow-Up
Headway
(veh/hr) /
Sample Size
Jackson Cty
Hamrick Rd. @ E.
Pine St.
Study
4-Section
Vertical
UMass 20 0 6 3
1,550 (61)
Jackson Cty
E. Pine St. @
Peninger St.
Study
3-Section
Vertical
UMass 17 1 0 8
1,440 (35)
Jackson Cty
Table Rock Rd.
@ Vilas Rd.
Study
3-Section
Vertical
UMass 19 0 1 1
1,584 (15)
OR June 2002
Jackson Cty
Stewart St. @
Columbus St.
Control
5-Section
Cluster
UMass 16 0 0 6 N
A
AZ June 2001 Tucson Ajo Way @ Park
Ave.
Study
5-Section
Vertical
Tucson 12 0 0 0
1,735 (14)
Mont. Cty
Cecil St. @ E.
Gude Dr.
Study
4-Section
Vertical
County 16 0 0 0
1,818 (38)
Mont. Cty
E. Randolph Rd
@ Fairland Rd.
Study
4-Section
Vertical
County 16 0 0 0
1,827 (70)
MD October 2000
Mont. Cty
Montrose Rd. @
Tower Oaks Blvd
Study
4-Section
Vertical
County 16 1 1 0
1,800 (42)
FYA=Flashing Yellow Arrow Indication
GA= Green Arrow Indication

68
TABLE 3-10 Study intersection conflict data after flashing yellow arrow implementation—Page 3 of 3
Observational Safety Analysis (Display
Based)
Events
State
Observation
Period Location Intersection
Site
Type
PPLT
Display
Data
Source
Hours of
Video
Reviewed Conflicts
Hesitation on
FYA
Hesitation on
GA
Follow-Up
Headway
(veh/hr) /
Sample Size
Broward Cty
Broward Blvd. @
SW 69th Ave.
Study
4-Section
Vertical
UMass 17
12 5
1,644 (31)
Broward Cty
Coral Springs Dr.
@ Wiles Rd.
Study
4-Section
Vertical
UMass 23
02 4
1,492 (12)
Broward Cty
Sample Rd. @
Riverside Dr.
Study
4-Section
Vertical
UMass 19
05 1
1,933 (35)
Broward Cty
Broward Blvd. @
SW 70th Ave.
Control
5-Section
Cluster
UMass 16
0 2 (GB) 2
1,593 (33)
Broward Cty
University Dr. @
Wiles Rd.
Control
5-Section
Cluster
UMass 20
0 2 (GB) 10
1,803 (24)
FL July 2002
Broward Cty
Sample Rd. @
Rock Island Rd.
Control
5-Section
Cluster
UMass 18
10 1
2,016 (20)
GA=Green Arrow Indication
FYA=Flashing Yellow Arrow Indication

69
nificantly more positive than negative comment from the pub-
lic and from their own staffs.
Agency Feedback
In addition to the formal written survey response com-
ments, there was considerable anecdotal evidence that pro-
vided preliminary insight into the agencies’ perspectives on
use of the flashing yellow arrow display. The overall response
to the flashing yellow arrow display from traffic engineers
around the county was positive. In general, traffic engineers
expressed their approval of the flashing yellow arrow display
because of the following:
•
The configuration provided an exclusive signal display
for the left-turn control.
•
The indication was flashing, which attracted more atten-
tion.
•
The traffic engineers had more operational control.
In general, local law enforcement agencies were support-
ive of the flashing yellow arrow display; however, there was
some hesitation from city councils and county commission-
ers because of concern about trying something new that was
not formally part of the MUTCD.
Public Reaction
Public comments from citizens who experienced the flash-
ing yellow arrow display in the field were generally positive.
Several volunteer agencies reported receiving e-mails or writ-
ten letters from the motoring public with most, if not all, in
support of the flashing yellow arrow display.
As part of the ongoing study activities, the research team
observed driver reaction to the flashing yellow arrow display
immediately upon implementation in the field. The drivers’
responses to the new displays suggest there was very little con-
fusion, with most drivers driving through the intersection as if
nothing were changed. Interestingly, at least one agency that
has implemented the flashing yellow arrow display reported
that drivers waiting to make a permissive left turn now stop
behind the stop bar and wait for a gap in opposing traffic
(rather than entering the intersection before stopping).
Agencies Declining Participation
A significant challenge encountered by the research team
was the recruitment of volunteer agencies to participate in
the field implementation study. The research team solicited
involvement from 35 individual operating agencies, of which
26 declined for various reasons. Through the course of ver-
bal discussions with agency representatives and responses to
a follow-up survey that the research team conducted, the pri-
mary reason cited by agencies for not participating was their
lack of resources. Other explanations for not participating in
the implementation study included controller capabilities,
changes in management staff, and/or lack of technical and/or
managerial staff.
ENGINEERING ASSESSMENT
In the initial stages of the research, the research team devel-
oped an engineering assessment intended to explore the many
subjective elements affecting the use of traffic signal dis-
plays that were not measured through scientific experiment.
To perform the Engineering Assessment, the research team
considered practical issues related to how an agency would
actually implement a particular signal display or indication.
The discussion below presents the final engineering assess-
ment that was developed after completion of the Driver Con-
firmation and Field Implementation studies.
Objective
The Engineering Assessment considered scientific and non-
scientific implementation issues in the following areas: safety,
operations, implementability, human factors, and versatility.
The updated engineering assessment identified objective and
subjective information needed in order to evaluate the signal
displays/indications. The assessment provided a thorough eval-
uation based upon sound engineering practice and the findings
of the various elements composing the research project.
Methodology
The research team identified and answered questions related
to safety, operations, implementability, human factors, and
versatility. Experiences of practicing traffic engineers and
basic engineering judgment were applied when appropriate.
Two significant tables were developed in the engineering
assessment. The first table, Table 3-11, lists each of the
major categories (e.g., safety and operations) and each ques-
tion within each category. Each answer to each question was
rated from highest to lowest. By design, quantitative scores
were not associated with any display and/or indication (indi-
vidual questions were not weighted equally). Therefore, judg-
ment was used to assess which displays and/or indications
performed better than others. Many of the questions in Table
3-11 require further explanation or clarification of intent
and/or meaning. Each question in Table 3-11 is explored in
more detail in the full technical report documented in Work-
ing Paper No.1, Engineering Assessment, included in the
appendixes on the accompanying CD-ROM.
The second table, Table 3-12, identified allowable combi-
nations of placement, display faces, and left-turn phasing. This

70
TABLE 3-11 Engineering assessment evaluation matrix—Page 1 of 4
Solid Circular Green Indication
# Questions to be answered
Traditional
Five-
Section
Circular
Green +
Flashing
Arrow
Dallas
Display
Flashing
Yellow
Arrow
Comments
SAFETY
S-1
Does it fail safe? Is a misunderstanding of the indication likely
to result in a safe action?
The driver
simulation/confirmation study
has shown safer operation for
the flashing yellow arrow
S-2
Can the indication eliminate the yellow trap under all
operational and field condition
s?
S-3 Can a red clearance be displayed after leading left
?
S-4 Can the start of permissive indication be delayed?
S-5
Does it avoid dilution of the safety or meaning of other
indication
s?
S-6 Are traffic violations minimized?
S-7 Are accident costs reduced
?
S-8 Are conflicts reduced?
OPERATIONS
O-1
Does the indication increase total delay to the driver due to
indecision, increased start-up lost times, reduced travel
speeds, and/or lower saturation flow
rates?
O-2 Does the indication impact pedestrian movements?
All indications mean yield to
left-turn driver
O-3 Can the indication be used with lead/lag operation?
O-4 Does the indication impact opposing left-turning traffi
c?
O-5
Does the indication allow the skipping of all side-street
phas
es?
O-6 Is the indication consistent with flashing indication
s?
O-7
Does operating the intersection in flashing mode provide
negative consequences?
O-8 Does the indication lead to false starts or related driver errors?
Ranking scale: = highest/best; = lowest/worst

71
TABLE 3-11 Engineering assessment evaluation matrix—Page 2 of 4
Solid Circular Green
# Questions to be answered
Traditional
Five-
Section
Circular
Green +
Flashing
Arrow
Dallas
Display
Flashing
Yellow
Arrow
Comments
IMPLEMENTABILITY
I-1
Are there significant issues with installation? Can the
indication be placed to meet with the current MUTCD
requirements?
Circular Green + Flashing Arrow
and flashing yellow arrow will
require amendment of MUTCD
I-2
Are there issues with conversion of existing indications?
-Convert a signal currently using traditional five-section
indication?
-Convert a signal currently using permissive-only?
-Convert a signal currently using protected-only?
I-3
Are there legal issues to consider including the Uniform
Vehicle Code and state and local laws?
I-4
Does the signal indication permit maximum number of
signal phasing strategies?
HUMAN FACTORS
H-1
Is the indication universally understood? Does the
indication meet both a priori and ad hoc driver
expectancies?
H-2 Do drivers respond correctly to the information presented?
H-3
Do drivers accept the indication? Does the indication
increase driver workload, reduce conspicuity, or increase
driver error?
H-4 Are supplemental signs required for understanding?
H-5
Do drivers exposed to the "new" indication easily learn the
meaning?
H-6
Does the signal indication fail safe? What are the
consequences of a driver misinterpreting the signal
indication message?
Ranking scale: = highest/best; = lowest/worst

72
TABLE 3-11 Engineering assessment evaluation matrix—Page 3 of 4
Solid Circular Green
# Questions to be answered
Traditional
Five-
Section
Circular
Green
+Flashing
Arrow
Dallas
Display
Flashing
Yellow
Arrow
Comments
VERSATILITY
V-1 Does it allow permissive-only operation?
V-2 Does it allow protected-only operation?
V-3
Does it allow change between mode of operation by
time of day?
V-4 Can it be used on curved approaches?
V-5
Does it allow two far-side LT heads in customary
locations?
V-6 Does it allow use of any phase sequ
ence?
V-7 Is it applicable to right turns as well as left
?
V-8 Can it be used with span wire-mounted sign
als?
V-9
Can heads be in same location as permanent
protected-only heads for easy conversio
n?
V-10
Can heads be in same location as permanent
permissive-only heads for easy conv
ersion?
V-11
Does it allow use of all of the opposing through green
time for permissive turns?
V-12
Can it be used when the left-turn lane is shared with
through traffic?
V-13
Can permissive, turning traffic proceed legally without
stopping?
V-14
Could it replace all current standard and non-standard
PPLT indicatio
ns?
V-15
Can it be used where there is no adjacent through
movem
ent?
V-16
Can it be used where the adjacent through movement
is unsignalize
d?
Ranking scale: = highest/best; = lowest/worst

73
TABLE 3-11 Engineering assessment evaluation matrix—Page 4 of 4
Solid Circular Green
# Questions to be answered
Traditional
Five-
Section
Circular
Green +
Flashing
Arrow
Dallas
Display
Flashing
Yellow
Arrow
Comments
VERSATILITY (continued)
V-17
Can it be used when the left-turn slot is physically
separated or on different alignment than through lane
(wide median, etc.)?
V-18
Can the signal indication be placed horizontally or
vertically in the same arrangement?
V-19 Does it work under all preemption scenarios?
V-20
Does it avoid the yellow trap situation under all
circumstances?
V-21
Can the permissive indication be easily applied to other
than PPLT situations?
V-22
Will practitioners likely use the indication if made the
standard, or allowed alternat
e?
Ranking scale: = highest/best; = lowest/worst

74
table identified the practical considerations regarding display
or indication, based on (1) whether the display/indication
could be used in a shared display face or an exclusive display
and (2) whether the display/indication could be used in a
lead-lead, lag-lag, or lead-lag left-turn signal operation.
Findings
The Engineering Assessment material presented in Table
3-11 focused on key issues surrounding safety, operations,
implementability, human factors, and versatility. The find-
ings of this assessment are highlighted below:
•
Within the category of safety, the assessment findings
suggest that the flashing yellow arrow display offered the
highest level of safety, followed by the circular green
indication using the Dallas Display.
•
Within the category of operations, the circular green
indication display using the Dallas Display performed
similarly to the flashing indications, with the remaining
circular green indication displays performing at lesser
levels.
•
Within the category of implementability, the circular
green indication was identified as being easiest to imple-
ment. This finding reflects the status of the circular green
indication as being the current standard for most agen-
cies. By comparison, the flashing yellow arrow display
was found to be easier to implement than a standard cir-
cular green indication in an exclusive left-turn display
and, overall, nearly equal to the implementability of a cir-
cular green indication display using the Dallas Display.
•
Within the category of human factors, the flashing yel-
low arrow display was found to rank the best.
•
Within the category of versatility, the flashing yellow
arrow display was clearly shown to offer the most ver-
satility while the standard circular green display shared
with a through lane offered the least.
Table 3-12 identified allowable combinations of place-
ment, display face, and left-turn phasing and highlights the
fact that only the circular green indication and the flashing
yellow arrow can be used in both the shared display and in
the exclusive left-turn display. The circular green indication
has some limitations in the shared display placement (e.g., it
cannot be used for lead-lag phasing, must serve both lagging
lefts at the same time, and has yellow trap potential). Conse-
quently, the comparison provided in Table 3-12 points out
that the flashing yellow arrow appears to be the most widely
applicable option.
TABLE 3-12 Allowable combinations of placement, display face, and phasing for potential display type
D I S P L A Y T Y P E
Placement
Indication
Arrangement Phasing
Traditional Five-
Section Circular
Green
Solid Circular
Green
– Dallas Display
Flashing
Yellow
Arrow
Lead-Lead Lefts
Y N Y
1
Lag-Lag Lefts
Y
2
N
Y
1
Five-section
Cluster
Lead-Lag Lefts
N N Y
1
Lead-Lead Lefts
Y N Y
1
Lag-Lag Lefts
Y
2
N
Y
1
Five-section
Vertical
Lead-Lag Lefts
N N Y
1
Lead-Lead Lefts
Y N Y
1
Lag-Lag Lefts
Y
2
N
Y
1
Shared
Indication with
Through
Five-section
Horizontal
Lead-Lag Lefts
N N Y
1
Lead-Lead Lefts
Y Y Y
Lag-Lag Lefts
Y
2
Y
Y
Five-section
Cluster
Lead-Lag Lefts
N Y Y
Lead-Lead Lefts
Y Y Y
Lag-Lag Lefts
Y
2
Y
Y
Five-section
Vertical
Lead-Lag Lefts
N Y Y
Lead-Lead Lefts
Y Y Y
Lag-Lag Lefts
Y
2
Y
Y
Exclusive
Indication
Five-section
Horizontal
Lead-Lag Lefts
N Y Y
Footnotes: 1. Assumes that the yellow arrow indication serves to both clear the green arrow indication and flash for the permissive interval. Use the bi-modal in
the bottom and use the yellow for the clearance.
2. Works only if serve both lagging lefts at the same time, otherwise a yellow trap may be created.

75
CHAPTER 4
DISCUSSION
The NCHRP 3-54 (02) research project looked at all pos-
sible PPLT displays and shortened the list of PPLT displays
to a select few. The research team collected sufficient data to
narrow the list of potential PPLT displays after extensive dis-
cussions with the project panel members.
The final study tasks of the project were focused on an eval-
uation of the flashing yellow arrow display in comparison with
the circular green indication, the MUTCD standard. The appli-
cation of a driver simulator provided an in-depth analysis of
driver understanding of the displays studied. When compared
with PPLT displays with a circular green permissive indica-
tion, the flashing yellow arrow indication was shown to exhibit
superior qualities in some analyses and equal qualities in oth-
ers. In only a few cases did the flashing yellow arrow indica-
tion not yield a higher level of understanding as compared with
the circular green indication, such as when the display was
“first observed.” The laboratory-based research techniques did
not universally demonstrate that the flashing yellow arrow
indication represents a far superior indication to the circular
green indication. The findings of the laboratory-based research
support the position that the flashing yellow arrow indication
represents the best alternative to the circular green indication.
Complementing the laboratory-based research techniques
was the in-the-field-based implementation study in which the
flashing yellow arrow indication was deployed in the real
world and thoroughly studied. The Implementation Study
results demonstrated that the flashing yellow arrow indication
was well understood in almost all deployment cases. Analy-
sis of the conflict data suggests that the flashing yellow arrow
indication is at least as safe as the current MUTCD standard
(circular green indication). Where deployed, the flashing yel-
low arrow indication was preferred by almost all of the traffic
engineers, field technicians, and citizens when compared with
the circular green PPLT indication. The Implementation Study
identified hardware and software issues related to implement-
ing the flashing yellow arrow display that would need to be
addressed before any widespread deployment could be con-
ducted. Through the Engineering Assessment, the flashing yel-
low arrow display was identified in three of the five categories
as “best” and near equal to the circular green indication in the
remaining two categories.
All PPLT displays and/or indications have been researched
thoroughly. The flashing yellow arrow indication/display was
found to result in a high level of understanding and a lower
fail critical rate as compared with the circular green indica-
tion. The flashing yellow arrow display offers more versatile
field application features (e.g., the display can be (1) operated
in various operational modes by time of day and (2) imple-
mented on any signal mount and intersection configuration)
as compared with the circular green indication. To that end,
the recommendations presented in Chapter 5 focus on the
flashing yellow arrow display as preferrable to the circular
green indication.
The various research activities completed throughout the
course of the project consistently supported the use of the flash-
ing yellow arrow indication as an alternative to the MUTCD
circular green permissive indication. The Engineering Assess-
ment summarized many of the aspects by which the flashing
yellow arrow display was found to be equal to or superior to
existing PPLT displays. Similarly, the Confirmation Study
and the Field Implementation Plan demonstrated the viability
of the flashing yellow arrow display, as well as its perfor-
mance and acceptance upon introduction to the motoring pub-
lic. The remainder of this chapter outlines the research team’s
basis for the recommendations documented in Chapter 5.
FINDINGS OF THE CONFIRMATION STUDY
The results of the Confirmation Study showed the following:
•
The flashing yellow arrow display was as well under-
stood (measured in terms of correct responses to ques-
tions presented) as the circular green indication.
•
There was no significant difference in the motoring pub-
lic’s correctly interpreting the meaning of the flashing yel-
low arrow indication as compared with the circular green
indication. The data demonstrated that drivers’ under-
standing of the flashing yellow arrow display increased
with exposure.
•
The flashing yellow arrow display showed a higher
fail-safe response as compared with the circular green
indication.
•
The conflict studies demonstrated that drivers interpret
the flashing yellow arrow display correctly.

FINDINGS OF THE FIELD IMPLEMENTATION
STUDY
The results of the Field Implementation Study demon-
strated the following:
•
The flashing yellow arrow display was successfully
implemented in the field with relatively little or no
technical or political issues. Post-implementation pub-
lic testimony almost unanimously supported use of the
experimental display. For example, the Jackson County,
Oregon, traffic engineer received the following voice
message referring to the new flashing yellow arrow PPLT
display: “I’m [name removed for privacy] calling to com-
ment about your flashing yellow arrow on a turn lane. I
think it’s the best thing since sliced bread. It is easy to
understand, makes traffic flow much more smoothly,
makes a lot better sense, you don’t sit there waiting to
make a left turn when nobody’s coming. The one in
downtown Medford confused me, the green light and
the green arrow [referring to the standard MUTCD five-
section cluster PPLT display]. I’m confused with that;
but with the flashing yellow light—I think it’s wonder-
ful. Don’t change a thing.” Letters and additional testi-
mony are presented later in this chapter.
•
Most practicing traffic engineers contacted during the
study endorse the flashing yellow arrow display.
•
The field data support high understanding of the flash-
ing yellow arrow display.
In addition to the many technical results of the research
elements supporting the flashing yellow arrow display, it is
also appropriate to reflect on the practical elements of why
the flashing yellow arrow display provides equal or supe-
rior performance as compared with the circular green PPLT
indication.
OPERATIONAL ADVANTAGES
There are many reasons some modes of left-turn operation
(e.g., permissive only, protected only, protected permissive,
lead/lag, and so forth) are chosen or the mode is changed dur-
ing the day. In most cases, however, it is for operational effi-
ciency, such as to increase the left-turn capacity, improve
traffic progression through coordinated signals, or reduce the
duration required for the protected phase, including full sup-
pression of the protected phase. Each of the various control
modes of left-turn operation has certain advantages and dis-
advantages. It has also been demonstrated that the current
MUTCD standard circular green indication display presents
safety problems.
As a result, traffic engineers have had to balance efficiency
and safety when designing and operating intersections. Inno-
vative traffic engineers have searched for ways to maintain
76
intersection safety and improve intersection operations, as
demonstrated by the multiple non-standard PPLT displays
currently in use within the United States. Given this discus-
sion as a preamble, the flashing yellow arrow display, in an
all-arrow display face, supports the following modes of left-
turn operations.
Protected-Only Operation
The flashing yellow arrow display can be operated in a
protected-only mode. In the protected-only mode, the flash-
ing yellow arrow permissive indication is not used.
Protected-Permissive Operation
The flashing yellow arrow display is “logically tied” to
the green output of the opposing through movement to avoid
the yellow left-turn trap. Logically tying a phase means that
the traffic signal control software outputs the flashing yel-
low arrow indication (permissive turn) only during the green
interval of the opposing through phase. This ensures that when
the permissive display terminates, the opposing through phase
will terminate simultaneously.
The original research problem statement addressed the
yellow trap issue as a major concern and it was, in fact, fun-
damental to initiation of this research project. As shown in
Figure 4-1, logically tying the flashing yellow arrow indica-
tion to the opposing through green indication completely elim-
inates the yellow trap, even when lead/lag phasing is used or
when side street phases are skipped and the leading left-turn
phase now follows the through phase.
Permissive-Protected Operation
Historically, most traffic engineers with lagging protected
operations serve both left-turn phases for the same duration
so as to not create the yellow trap. Because the flashing yel-
low arrow display is tied to the opposing through movement,
thereby eliminating the yellow trap, this operation becomes
much more efficient. This operation is especially useful for
skipping the protected-only sequence when there is inade-
quate vehicular demand.
Permissive-Only Operation
The permissive left-turn operation allows the drivers to exe-
cute left turns when gaps occur within the opposing through
movement. The flashing yellow arrow display allows the sig-
nal operation to change modes during the day in any way, or
for longer periods of time, if desired. A key advantage to this
flexibility is that the signal operation could, for example,
change from an eight-phase protected-only operation during
peak hours, to an eight-phase protected/permissive operation
during the day, to a simple two-phase permissive-only signal

operation during low volume conditions. It is also feasible
for one direction to operate protected-permissive while the
opposite approach uses a different mode. All combinations
are feasible and can be selected to optimize the operational
efficiency as conditions change.
OTHER CONSIDERATIONS
Supplemental Display Arrangements
The flashing yellow arrow display supports all of the modes
of left-turn operation as identified above and can be imple-
mented in states that require supplemental signal faces. States
77
such as California use supplemental signal faces that are nor-
mally located on the far left side of the intersection. This type
of operation is not possible with the Dallas display because
of its need for optical shielding.
Right-Turn Overlap Display
The flashing yellow arrow display would solve the prob-
lem of having to prohibit the conflicting U-turn when oper-
ating a right turn overlap during a side street left-turn phase.
Similarly, the flashing yellow arrow display could be used
for drivers who might have to yield to pedestrians while turn-
ing right from approaches with no through movement and in
Figure 4-1. Flashing yellow arrow logical link.
1
Opposing
Through Signal
All Red
Protected Left-Turn
Change Interval
(End Protected Left-Turn)
Permissive Phase
Through Traffic
Change Interval
Opposing Through
Phase Still Running
2
3
4
5
6
Indicates Flashing

cases where a circular green indication cannot be displayed
(e.g., because of a one-way opposite approach).
UNIVERSAL APPLICATION
The flashing yellow arrow is the only display that pro-
vides a universal solution. It can be used at every intersec-
78
tion, no matter how unusual. Other PPLT displays cannot be
used in some situations, such as when the signal arrange-
ments are mounted on span wires, when dual far-side signal
arrangements are needed (e.g., in California), when there is
no adjacent through movement, when the approach is
curved, or when the turn must be held (not even permissive)
during railroad preempt although both through movements
can proceed.
Figure 4-2a. Letter in support.

A NEED FOR CHANGE
There was much discussion within traffic engineering
forums that left-turning drivers need to know that there is a
change in right-of-way permissions. It has been proposed
that a new display was needed that would change in color,
mode, position, and shape. That way, when in operation,
drivers would be alerted to new information on the signal
79
face so they could align their movements with the correct
right-of-way permissions.
The flashing yellow arrow display, in a four-section dis-
play face, provides a change in color (green to yellow), a
change in mode (steady to flashing), a change in position (a
lateral change in display placement and a vertical change in
the display arrangement), and a change in shape (circular
green to a yellow arrow).
Figure 4-2b. Letter in support.

PUBLIC SUPPORT FOR THE DISPLAY
The reaction from the public toward the flashing yellow
arrow has been positive. The Field Implementation Study
identified all seven implementing agencies as receiving
mostly positive feedback from local citizens. For example, as
found in Jackson County, Oregon, most of those in favor of
the flashing yellow arrow display wanted the displays retro-
fitted to other intersections where protected-only left turn
phasing was in operation. Figures 4-2a and 4-2b contain let-
ters submitted by local citizens supporting use of the flashing
yellow arrow displays.
Even outside the auspices of the NCHRP 3-54 project,
public reaction has been overwhelmingly favorable. For
example: the City of Reno, Nevada, received tremendous
public response immediately upon converting several inter-
sections to using the flashing yellow arrow display. A total
of 66% of the callers favored the new display, 27% were
neutral (asked for information), and 7% were negative (they
did not see a reason for the change). Although there were
some negative feelings about changing to the flashing yel-
80
low arrow display, such a response can be expected anytime
there is change in operation.
IMPLICATIONS FOR NONCONFORMING
PPLT DISPLAYS
This research project was initiated at the request of the
Signals Technical Committee of the National Committee on
Uniform Traffic Control Devices. A goal of the study was to
identify the “best” PPLT display that would lead to the
determination of a national standard, whether that display was
the circular green indication or some other indication. This
study has shown that the flashing yellow arrow indication is
better understood than the circular green indication when used
for PPLT operation. The recommendations identified in Chap-
ter 5 identify the flashing yellow arrow display as the preferred
alternative to the circular green indication. The future status of
other displays/indications currently in use around the United
States that do not conform to either the circular green indi-
cation or the new proposed alternative indication will need to
be determined by FHWA.

81
CHAPTER 5
RECOMMENDATIONS
Through the course of this study, the individual study tasks
such as the Agency Evaluation, Photographic Driver Study,
Traffic Operations Study, Traffic Conflict Study, Crash Analy-
sis, Driver Simulation Study, Field Implementation Study, and
Engineering Assessment have provided the research team with
a tremendous amount of data. Chapters 2, 3, and 4 of this
report have presented these data and captured key findings
derived from the study task activities. This chapter provides
the research team’s recommendations based on the collective
project findings.
Based on the findings of this project, the research team
makes the three recommendations identified below.
RECOMMENDATION #1: INCORPORATE
FLASHING YELLOW ARROW DISPLAY
INTO THE MUTCD
It is recommended that the flashing yellow arrow display
be included in the MUTCD as an allowable alternative display
to the circular green indication when used in PPLT control/
operation.
RECOMMENDATION #1A: DISPLAYS
The four-section, all-arrow display face should be the only
display allowed. The only display that justifies an exception
to this recommendation is the three-section display face with
bi-modal lens. The three-section display face with bi-modal
lens should also be allowed because it operates in the same
way as does the four-section display face. Only one indica-
tion shall be illuminated at any time. Allowed variations could
be as follows:
•
The agency may use a circular red indication in lieu of
the red arrow.
•
A three-section all-arrow display using the center sec-
tion as a change interval and the permissive interval is
allowed, provided that all yellow change intervals for
the approach are initiated simultaneously.
•
A five-section display may be used.
Figure 5-1 illustrates two potential options for retrofitting
a five-section display to incorporate the flashing yellow arrow.
The five-section heads shown in Figure 5-1 would serve
only as the left-turn signal and would have to be shielded
from the adjacent through movement lanes. The adjacent
through movement indication would have to be provided on
an exclusive display. Furthermore, only one indication in the
five-section display would be illuminated at any time.
As shown in Figure 5-1, the five-section display could
incorporate an all-arrow arrangement or a yellow circular
indication and a red circular indication. If the red circular indi-
cation is used, a yellow circular indication or yellow arrow
indication could be used for the permissive phase change inter-
val. However, if a red arrow indication is used, the yellow
arrow indication must be provided for the change interval. In
either case, the protected left-turn elements of the display
would remain in their current location and the flashing yellow
arrow would replace the current green circular permissive
indication in the bottom right corner of the display.
RECOMMENDATION #1B: LOCATION
The flashing yellow arrow operation shall only be used in
an exclusive signal arrangement. The left-turn signal face
should be placed over the left turn lane.
RECOMMENDATION #1C:
SUPPLEMENTAL SIGNS
Supplemental signing is not warranted with a flashing yel-
low arrow display. Use of supplemental signing is optional. If
a supplemental sign is deemed necessary, the following sign
should be used: YIELD ON FLASHING YELLOW ARROW
or YIELD ON FLASHING YELLOW [Symbolic Arrow].
RECOMMENDATION #1D: PHASING
When used for left-turn treatments, the flashing yellow
arrow shall be tied to the opposing through-green indication/
display. There may be a delay in the illumination of the flash-
ing yellow arrow display.

RECOMMENDATION 2: CONDUCT FOLLOW-UP
STUDY
It is recommended that a follow-up study be conducted for
this project. The follow-up study should be conducted after
there has been sufficient time for an implementation trial
period for agencies currently participating in the field imple-
mentation as well as for any additional agencies that may
choose to implement based on the findings of this research
effort. Sufficient time should also be allowed to acquire before
and after crash data at the study intersections and correspond-
ing control sites. Given the difficulties encountered in obtain-
82
ing useful crash data for this research project, it is strongly
encouraged that any participating agencies carefully compile
and maintain crash data records for the study intersections.
Once initiated, the follow-up study should
•
Analyze all available crash data for the experimental
flashing yellow arrow displays implemented as part of
this study;
•
Identify whether the flashing yellow arrow display should
become the only display allowed in the MUTCD for a
protected-permissive left-turn operation;
•
Identify whether, if the flashing yellow arrow is selected to
become the only display allowed for PPLT, the MUTCD
should also be changed to add the following prohibition:
“For Permissive Only Mode operation, a signal face dis-
playing a circular green indication shall not be located
directly over or in line with a left-turn lane”; and
•
Identify an implementation plan.
RECOMMENDATION 3: RESTRICT USE
OF FLASHING RED INDICATIONS
The use of the flashing red indication should only be
implemented where an engineering study has identified that
all drivers must come to a complete stop before proceeding
on the permissive interval.
Flashing
Figure 5-1. Potential flashing yellow arrow
retrofit to five-section cluster display (exclusive
left-turn display).

83
REFERENCES
1. American Traffic Safety Services Association/Institute of Trans-
portation Engineers/American Association of State Highway and
Transportation Officials/Federal Highway Administration, “Uni-
form Traffic Control Devices,” Washington, DC (2001).
2. Fambro, D.B., Messer, C.J., and Woods, D.L., “Guidelines for
Signalized Left-Turn Treatments,” FHWA Report IP-81-4,
FHWA, U.S. Department of Transportation, Washington, DC
(1981).
3. Fambro, D.B, Gaston, G.D., and Hoff, C.M., “Comparison of
Two Protected-Permitted Lead-Lag Left-Turn Phasing Arrange-
ments,” Research Report 989-1F, Texas Transportation Institute
(1991).
4. King, G.F., NCHRP Research Results Digest 97: Guidelines for
Uniformity in Traffic Signal Design Configurations. Trans-
portation Research Board, National Research Council, Wash-
ington, DC (1977).
5. Institute of Transportation Engineers, Washington Section of
District 6, “Flashing Yellow Protected-Permissive Signal Eval-
uation,” Final Report (1985).
6. Kua, C., “Left-Turn Arrow: Flashing versus Non-Flashing,”
Written correspondence to Brian Latte, Project 158, Uniform
Traffic Signals Displays, Chairman (1991).
7. Mintz, S., The Canadian Association of Optometrists. Written
correspondence to Alfred Guibert on color blindness and traf-
fic signal display (1992).
8. Holowachuk, L. M., Director of Highway Safety, “Impact
Statement of New Signal Standards,” Prepared for the National
Council on Uniform Traffic Control Devices, Canada (1993).
9. Pitzinger, P., “Guidelines for Signal Light Installations,”
Research Society for Highways and Traffic Workshop Team
for Traffic Strategy and Traffic Security: Maastricher Straße,
Germany (1981).
10. Pitzinger, P. and Hasler, H., “The Flashing Yellow Arrow,”
Confederate Department of Traffic and Energy Economics,
Federal Office for Road Construction, Germany (April 1998).
11. Pitzinger, P., “Three Years of Experience with Traffic Acci-
dents with the Flashing Yellow Arrow,” Zurich City Police,
Zurich, Germany (1990).
12. Brebner, J., Ward, L., and Taplin, J., “Study of Comprehen-
sion of Turn Right With Care (TRWC) Message at Intersec-
tions and Related Crash Patterns,” University of Adelaide,
Australia (2002).
13. Brookes, J., Collins, R., and Haenel, H., “Study of MUTCD
and City of Dallas Permitted/Protected Lead/Lag Left-Turn
Phasing,” Internal Paper Austin, Texas, Texas Department of
Transportation (1990).
14. Collins, R., “ A comparative analysis of left-turn delay associ-
ated with two difference lead lag phasing arrangements,” Mas-
ters Thesis, The University of Texas at Austin (1988).
15. Albert Grover & Associates, “Minimize Delay, Maximize Pro-
gression with Protected Permissive Lead/Lag Phasing,” Tech-
nical Workshop, Inland Empire Section of ITE (1995).
16. Highway Capacity Manual 2000, Transportation Research
Board, National Research Council, Washington, DC (2000).
17. Robertson, H.D., Hummer, J.E., and Nelson, D.C., Manual of
Traffic Engineering Studies, ITE, Prentice Hall, Englewood
Cliffs, NJ (1994).
18. Parker, M.R. Jr., and Zegeer, C.V., “Traffic Conflict Tech-
niques for Safety and Operations: Engineers Guide,” FHWA
Report IP-88-026, FHWA, U.S. Department of Transportation,
Washington DC (1988).
19. Parker, M.R. Jr., and Zegeer, C.V., “Traffic Conflict Tech-
niques for Safety and Operations: Observers Manual,” FHWA
Report IP-88-027, FHWA, U.S. Department of Transportation,
Washington DC (1988).
20. “Recommended Warrants for the Use of Protected/Permissive
Left-Turn Phasing,” Technical Committee Project 4A-30, Insti-
tute of Transportation Engineers, Washington DC, (1994). Man-
ual on Uniform Traffic Control Devices, Federal Highway
Administration, Washington, DC (1988).
21. Hummer, J. E., Montgomery, R. E., and Sinha, K. C., “Guide-
lines for Use of Leading and Lagging Left-Turn Signal Phas-
ing,” Transportation Research Record 1324 (1991).
22. Upchurch, J., “Comparison of Left-Turn Crash Rates for Dif-
ferent Types of Left-Turn Phasing.” Transportation Research
Record 1324 (1991).
23. JHK & Associates, “Signal Displays for Left Turn Control.”
Task A Report (Unpublished), prepared for Federal Highway
Administration, Contract # DTFH61-85-C-00164 (August
1988).
24. Hauer, E, J.C.N. Ng, and J. Lovell, “Estimation of Safety at
Signalized Intersections, Transportation Research Record
1185 (1988).
25. Bonneson, J.A. and McCoy, P.T., “Evaluation of Protected/
Permitted Left-Turn Traffic Signal Displays,” Nebraska Depart-
ment of Roads, Research Report No. TRP-02-27-92 (1993).
26. Institute of Transportation Engineers, Washington Section of
District 6, “Flashing Yellow Protected-Permissive Signal Eval-
uation,” Final Report (1985).
27. Agent, K.R, “Development of Warrants for Left-Turn Phas-
ing,” Research Report 456, Kentucky Department of Trans-
portation (1976).
28. Agent, K.R., “An Evaluation of Permissive Left-Turn Phas-
ing,” Research Report 519, Kentucky Department of Trans-
portation (1979).
29. Agent, K.R., “Guidelines for the Use of Protected/Permitted
Left-Turn Phasing,” Research Report UKTRP-85-19, Kentucky
Transportation Research Program (1985).

Abbreviations used without definitions in TRB publications:
AASHO American Association of State Highway Officials
AASHTO American Association of State Highway and Transportation Officials
APTA American Public Transportation Association
ASCE American Society of Civil Engineers
ASME American Society of Mechanical Engineers
ASTM American Society for Testing and Materials
ATA American Trucking Associations
CTAA Community Transportation Association of America
CTBSSP Commercial Truck and Bus Safety Synthesis Program
FAA Federal Aviation Administration
FHWA Federal Highway Administration
FMCSA Federal Motor Carrier Safety Administration
FRA Federal Railroad Administration
FTA Federal Transit Administration
IEEE Institute of Electrical and Electronics Engineers
ITE Institute of Transportation Engineers
NCHRP National Cooperative Highway Research Program
NCTRP National Cooperative Transit Research and Development Program
NHTSA National Highway Traffic Safety Administration
NTSB National Transportation Safety Board
SAE Society of Automotive Engineers
TCRP Transit Cooperative Research Program
TRB Transportation Research Board
U.S.DOT United States Department of Transportation
