
1
Chapter 2: Aerospace Materials Characteristics
Biliyar N. Bhat, NASA Marshall Space Flight Center
2.1 Introduction
This chapter gives an overview of aerospace materials and their characteristics. It focuses on the most
commonly used materials in aerospace structures including aircrafts, space crafts, launch vehicles and
propulsion and power systems. The treatment is necessarily brief and serves as an introduction to different
classes of materials and their characteristics in the context of aerospace applications. It is not intended to
be exhaustive. There are excellent information sources for these materials available elsewhere and are
referenced at the end of each section. The reader should go to these references for more details.
Aerospace materials can be broadly classified into four classes: metallic materials (metallics), non-
metallic or polymeric materials, composite materials (composites) and ceramic materials (ceramics).
Examples from these classes of materials are given in this chapter. Historically aircrafts used the best
materials available at that time. Wright brothers used aluminum alloys in their aircraft to make them
lighter (compared to steel) so that they can become airborne more readily. Lightweight nonmetallic
materials such as wood and fabric were also used. There has been a continuous improvement in aerospace
materials in all classes over the last hundred years. Carbon fiber reinforced composites were introduced
some sixty years ago and their use has become more common today because of lighter weight and higher
strength compared to other materials.
Metallic materials are the most commonly used materials in building aerospace systems of today. They
are covered in sections: 2.2 - Aluminum alloys, 2.3 - Titanium alloys, 2.4 – Iron alloys (Steels), 2.5 -
Superalloys, and 2.6 - Copper alloys. Damage tolerance considerations are described in section 2.7.
Details on alloy development, properties, processing and typical applications are presented. Relationships
between properties, microstructure and processing are also described with aerospace applications in mind.
Structural properties such as elastic modulus, tensile strength, ductility and damage tolerance (fatigue and
fracture) are emphasized since they are major considerations in design. Manufacturing technologies
commonly used to fabricate metallic material components are described in the context of design for
manufacturing. Environmental effects on materials performance are described in section 2.8 (hydrogen
embrittlement) and section 2.9 (oxygen compatibility). These two topics are of special interest because of
their importance in propulsion systems that use hydrogen and oxygen as propellants.
Polymers and composites are described next in sections 2.10 and 2.11. Polymers are organic compounds
that are chemically based on carbon, hydrogen, and other nonmetallic elements (e.g. O, N, and Si). Some
of the common polymers are polyethylene (PE), nylon or polyamide (PA), polyvinyl chloride (PVC),
polycarbonate (PC), polystyrene (PS), silicone rubber, epoxy, and phenolic. Polymers are different from
the other materials in many ways but generally possess lower densities, thermal conductivities, and
moduli. The lower densities of polymeric materials offer an advantage for applications where light-weight
is a requirement. Carbon fiber reinforced composites and their processing is also described. Section 2.11
focuses on mechanical behavior of composites and their applications in launch vehicles.

2
Ceramic materials and their characteristics are not discussed in this chapter but they are covered under
applications in Chapter 6 - Materials in Spacecraft and Chapter 9 - Thermal Protection Systems in
Hypersonics.
Aerospace materials have advanced steadily in the last hundred years. They have become much stronger
and lighter, as the readers will see in the following sections. There are more material choices available to
the designer today than any time in the past. The selection of the best material for design is a key step in
the design process, which is discussed in Chapter 3.

3
2.2 Aluminum Alloys
Awadh B. Pandey, Pratt & Whitney
2.2.1 Introduction
There has been considerable use of aluminum alloys in aerospace applications at moderate temperatures
(up to 300⁰F) for many decades due to its attractive mechanical properties including higher specific
strength (strength /density), durability and damage tolerance. Aluminum alloys demonstrate very
attractive mechanical properties including strength, fatigue resistance and fracture toughness. The
mechanical properties are affected by alloy composition, processing and the heat treatment. Aluminum
alloys are readily forged into precise and intricate shapes as they are very ductile at normal forging
temperatures and they do not develop scale during heating. Aluminum alloys have good corrosion
resistance due to the formation of aluminum oxide on the surface. The primary use of high strength
aluminum alloy is in aircrafts; the airframe of modern aircraft is typically 80 percent aluminum by
weight. More recently composites are being used in place of aluminum skin, predominantly on the
Boeing 787 aircraft. There are two excellent textbooks available on aluminum alloys: one by Polmear [1]
and other by Hatch [2]. In addition, Starke and Staley [3] have written a very comprehensive overview on
aluminum alloys for aerospace applications. This section provides an overview of different classes of
commonly used aluminum alloys in aerospace applications along with a look at current trends and future
developments, including high temperature aluminum alloys and discontinuously reinforced aluminum.
2.2.2 Aluminum Alloy Classification Systems
There is a broad range of aluminum alloys and therefore, a classification system has been developed for
them. There are two major types of aluminum alloys available depending on processing utilized to
produce the material: wrought and cast alloys. Wrought alloys are produced by casting plus deformation,
which may be in the form of extrusion, forging or rolling. They are preferred for most load bearing
structures in aerospace applications as they have higher strength and damage tolerance. A number of
wrought aluminum alloys are available depending on alloy compositions, processing and heat treatment.
Because of this, wrought alloys have different designation systems than cast alloys. Cast alloys are
produced by casting and no deformation is imparted to the material or component. Therefore, cast
aluminum alloys have limited strength and ductility. The major advantage of cast aluminum alloys is that
they can be used for making intricate shaped parts which are difficult to produce by wrought processing.
Wrought aluminum alloys are normally designated by a four digit number and there can be a further letter
and number to indicate temper and condition developed by the Aluminum Association. This classification
has been adopted by different parts of the world and is known as International Alloy Designation System
[3]. The designation system for wrought aluminum alloys is given in Table 2.2.1. For wrought alloys, the
first digit indicates the major alloying element, the second digit indicates modification of the original
alloy or impurity limits and the last two digits indicate the specific aluminum alloy. For instance, the 2xxx
series alloys contain copper as main alloying element and may contain magnesium and manganese as
additional alloying elements.
Table 2.2.1: Aluminum alloy designation system for wrought alloys
Four Digit Series Alloys
Major Alloying Elements

4
1xxx series
99% Aluminum
2xxx series
Copper (most also contains Magnesium)
3xxx series
Manganese
4xxx series
Silicon
5xxx series
Magnesium
6xxx series
Magnesium and Silicon
7xxx series
Zinc (most also contains Magnesium and Copper)
8xxx series
Others including Li and Fe
The designation for the cast aluminum alloys is shown in Table 2.2.2 [3], which uses a three digit system.
The first digit refers to the major alloying element, and the second two to denote a specific composition.
The zero after the decimal point indicates casting and other numerals indicate ingots. For instance, the
3xx.x series alloys contain silicon as major alloying element with magnesium and/or copper as additional
alloying elements. The 9xx.0 series alloys contain alloying elements similar to wrought alloys.
A letter prefix is used to identify impurity level or the presence of an additional alloying element. These
letters are given in alphabetical order starting with A and ending in I, O, Q and X. X is normally used for
experimental alloys. A 201.0 is used for higher purity version of 201.0 and A357.0 is used for higher
purity version of 357.0.
Table 2.2.2: Aluminum alloy designation system for cast alloys
Three digit series
Major alloying elements
1xx.0
99.00% minimum Al
2xx.0
Copper
3xx.0
Silicon with added Cu or Mg
4xx.0
Silicon
5xx.0
Magnesium
6xx.0
Unused
7xx.0
Zinc
8xx.0
Tin

5
9xx.0
Others
2.2.3 Aluminum Alloy Temper Designation Systems
The heat treatment or temper designation system for wrought aluminum alloys is given in Table 2.2.3 [3].
The nomenclature has been developed by Aluminum Association. The letters are used as suffixes to the
alloy number. As shown in the table, F indicates as fabricated and O indicates as annealed condition of
the alloy. The letter H indicates hardened condition by cold deformation and first digit following H
indicates cold work and partially annealed/or stabilized; second digit indicates how much deformation is
given. The alloys that are solution treated but not aged are designated as W and the alloys that are solution
treated and aged are identified as T. Numbers following T identify the type of aging condition given to
alloy. T3 indicates solution treatment plus cold worked, T4 indicates solution plus natural aging and T6
indicates solution plus artificial aging to achieve peak strength. T7 is used for solution plus stabilizing,
which is usually a two-step aging to improve stress corrosion resistance. T8 is used for solution plus cold
working plus artificial aging. H is used for strain hardened alloys such as 3xxx and 5xxx series alloys.
T3, T4 and T8 are usually applicable to 2xxx series alloys. The cold working in T8 temper introduces
dislocations which act as sites for nucleation of precipitates that provide an increased strength. T6 is
applicable to 6xxx, 2xxx and 7xxx series alloys to indicate the highest strength conditions. T3 is used for
2xxx series alloys to indicate higher damage tolerance resistance. T7 is an over aged condition with
improved stress corrosion resistance and is applicable to only 7xxx series alloys.
Table 2.2.3: Temper designation system for aluminum alloys
Suffix letter F,O, H, T or W indicates
basic treatment condition
First suffix digit indicates secondary treatment
condition to influence properties
Second suffix digit for
condition H only
indicates residual
hardening
F-As fabricated
O- Annealed, wrought products only
H- Cold worked, strain hardened
1- Cold worked only
2 - 1/4 hard
2 - Cold worked and partially annealed
4- 1/2 hard
3 - Cold worked and stabilized
6 - 3/4 hard
8 - hard
9 - extra hard
W- Solution heat treated
T - Heat treated stable
1- Partially solution plus natural aging
2- Annealed cast products only

6
3 - Solution + cold worked
4 - Solution + natural aging
5 - Artificially aged only
6 - Solution + artificial aging
7 - Solution + stabilizing
8 - Solution + cold work plus artificial aging
9 - Solution + artificial aging plus cold work
Deformation is often given to the material after quenching from solution treatment to relieve residual
stresses, which could have deleterious effects on machining, fatigue and stress corrosion cracking. The
stress relieving is designated by number 5 after the last digit for age hardening condition. The stress
relieving can be performed either by stretching which is denoted by number 1 or by compressing which is
denoted by number 2. Other numbers are added for extrusions. Extrusions may be mechanically
straightened after stretching which is denoted by 1 and if not mechanically straightened after stretching
then it is denoted by 0. The alloy 7150-T7511 extrusions indicates that 7150 alloy containing zinc as main
alloying element was heat treated to T7 condition after solution treatment to improve stress corrosion and
stress relieved by stretching and may have also been straightened after stretching.
2.2.4 Alloying Elements and Heat Treatment
Aluminum alloys are formulated by using combination of alloying elements as shown in Figure 2.2.1 [2].
There are three main types of aluminum alloys depending on the presence of alloying elements: (a) age
hardening (also known as precipitation hardening) alloys, (b) casting alloys, and (c) strain hardened
alloys. Age hardening alloys consist of Al-Cu, Al-Cu-Mg, Al-Mg-Si, Al-Zn-Mg and Al-Zn-Mg-Cu.
Casting alloys consist of Al-Si, Al-Si-Cu and Al-Si-Mg. Strain hardened alloys include Al-Mg and Al-Mn
alloys. Age hardening alloys are strengthened by precipitates which are produced by heat treatment
including solution and aging treatments. 2xxx, 6xxx and 7xxx series alloys are age hardening alloys.
Casting alloys are also strengthened by precipitates produced by heat treatment. Casting alloys include
2xx.x and 3xx.x series alloys. Strain hardened alloys are non-heat treatable and strengthened by
dislocations introduced through cold working.

7
Fig. 2.2.1: Principal aluminum alloys [2]
Fig. 2.2.2: Al-Cu phase diagram with markings for heat treatment temperatures [2]

8
Fig. 2.2.3: Al-Cu phase diagram showing microstructures resulting from different steps of precipitation
hardening process [4].
Precipitation hardening is a process where a fine precipitate structure is formed in the alloy matrix
following a heat treatment process (Figs. 2.2.2 & 2.2.3). For an alloy to be precipitation hardened it
requires: (a) decreased solubility with decreasing temperature, (b) the ability to suppress the formation of
precipitates by quenching from a solid solution, and (c) the formation of metastable coherent precipitates.
The precipitation hardening process consists of following three steps:
1. Solution treatment - The alloy is heated above the solvus temperature to dissolve all
precipitates and ensure that the alloying elements are completely in solid solution.
2. Quench - The alloy is quenched in water so that alloying elements do not have time to diffuse
and form precipitates. Thus, the alloying elements remain in solution forming a
supersaturated solid solution.
3. Aging - The alloy is heated to an intermediate temperature below the solvus temperature. The
alloying elements are able to diffuse to form extremely fine coherent precipitate clusters
known as GP (Guinier-Preston) zones.
The coherent precipitates increase the strength of the alloy by distorting the crystal lattice and creating
resistance to dislocation motion. The number of precipitates increase with increasing aging time thus
increasing the strength of the alloy. However, with increasing aging time the precipitates become large
and incoherent and their strengthening effect decreases. Thus, following strengthening mechanisms are
operative during precipitation hardening:
a. Solid solution strengthening in the supersaturated solid solution
b. Coherency stress hardening from the coherent precipitates
c. Precipitation hardening by resistance to dislocation motion
d. Hardening through resistance to dislocation between precipitates.
Table 2.2.4 shows the precipitation sequence in different precipitation hardening alloys [5]. It shows that
Al
2
Cu ('- theta prime) is major strengthening phase in Al-Cu alloys. Al
2
CuMg S’ is main strengthening
precipitate in Al-Cu-Mg (2xxx series) alloys. Mg
2
Si ('- beta prime) is mainly responsible for

9
strengthening in Al-Mg-Si (6xxx series) alloys. MgZn
2
('- eta prime) is the major strengthening
precipitate in Al-Zn-Mg (7xxx series) alloys. In Al-Li alloys, Al
3
Li ('- delta prime) is the main
precipitate. In Al-Li-Cu-Mg alloys, S’, T1 and ' contribute to strengthening. It should be noted that ’
cannot usually be suppressed during the quench from solution treatment temperature. Further
precipitation of ' occurs during the GP zone formation and normal precipitation sequence of the Al-Li-
Cu and Al-Li-Cu-Mg alloys.
Table 2.2.4: The solid state precipitation sequence for various aluminum alloys [5]
Alloys
Precipitation Reactions
Al-Cu
Supersaturated solid solution - GP Zones - " -'- (equilibrium) Al
2
Cu
Al-Cu-Mg
Supersaturated solid solution - GP Zones - S' Al
2
CuMg-S (equilibrium) Al
2
CuMg
Al-Mg-Si
Supersaturated solid solution - GP Zones - ' Mg
2
Si
Al-Li
’ +Supersaturated solid solution - ' Al
3
Li - AlLi
Al-Li-Cu
’ + Supersaturated solid solution - GP Zones -"- '- - T1 (Al
2
CuLi)
Al-Li-Mg
’ + Supersaturated solid solution - ' Al
3
Li - Al
2
LiMg
Al-Li-Cu-Mg
' + supersaturated solid solution - GP Zones - S"- S' + ' - S +
Al-Zn-Mg
Supersaturated solid solution - GP Zones -' hexagonal MgZn
2
-MgZn
2
2.2.5 Strengthening Mechanisms
Aluminum alloys can be strengthened by a number of mechanisms: solid solution strengthening, grain
size strengthening, work (strain) hardening, precipitation hardening, and dispersion hardening. Each
mechanism is described below briefly. Details may be found in the literature.
Solid Solution Strengthening: Solid solution strengthening is derived from the presence of alloying
elements in aluminum [6]. Two types of solid solution strengthening can be produced in aluminum
depending on the presence of alloying element (a) substitutional solid solution and (b) interstitial solid
solution. Magnesium provides strengthening through substitutional solid solution. Solid solution
strengthening depends on misfit strain that is caused by change in lattice parameter of aluminum matrix
due to presence of alloying elements.
Grain Size Strengthening: Grain size strengthening is a phenomenon where strength increases with a
decrease in grain size (Hall-Petch model, reference [6]). When a stress is applied to the material,
dislocations tend to align at the grain boundaries leading to pile up of dislocations. The finer grains have
more grain boundaries and therefore, dislocation pile up is higher in finer grain materials compared to
coarse grain materials. The dislocation pile up raises stress required for deformation, which results in

10
increased strengthening in finer grain materials. The contribution of grain size strengthening can be
significant in aluminum alloys.
Work (strain) hardening: Strain hardening (usually through cold working the material) can provide
strengthening by increasing dislocation density. As dislocation density increases, shear stress required to
overcome the dislocation barrier increases. Strain hardening is applicable for the non-heat treatable
aluminum alloys, 3xxx and 5xxx series alloys. Substantial strengthening in Al-Mn and Al-Mg based
alloys can be produced by cold working.
Precipitation Hardening: Strengthening during precipitation hardening process is illustrated in Figure
2.2.4, which shows the shearing and bypassing of precipitates by dislocations. In the under aged (UA)
condition, the precipitates are small and coherent with aluminum matrix. Dislocations cut these
precipitates during deformation of the material, which provides strengthening in the under aged condition.
The size of precipitates increases with an increase in aging time during precipitation hardening process.
This process continues until precipitates attain a critical size where coherency is lost and the precipitates
become incoherent with the aluminum matrix. The aluminum alloys achieve highest strength in the peak
aged (PA) condition. In the over aged (OA) condition, the size of precipitates increases with an increase
in the aging time. The size of the precipitates is so large that dislocations have to go around (bypass) these
precipitates, contributing to strengthening in the OA condition. This mechanism is also known as Orowan
strengthening. Precipitation strengthening is the dominant mechanism to provide higher strengths in 2xxx,
6xxx and 7xxx series alloys.
Dispersion Hardening: Dispersion hardening can provide substantial strengthening in aluminum alloys
from individual dislocation-particle interaction. The microstructure of dispersion strengthened materials
usually contains dispersed particles within grains and on the grain boundaries. When dislocation interacts
with particles within grains, they provide strengthening from dislocation looping. When dislocation
moves through material with particles, dislocations leaves loops around these particles. These dislocations
loops exert back stress providing strengthening in aluminum alloys. Orowan strengthening is applicable
to dispersion strengthened materials. It can be increased by decreasing inter particle spacing, which is
accomplished either by increasing volume fraction for a constant particle size or by decreasing particle
size for a constant volume fraction. For a given alloy composition, volume fraction of dispersoids or
precipitates will be fixed which means particle size must be reduced to reduce the inter particle spacing.
Most dispersion hardened materials are non-heat treatable. They typically contain oxides, carbides or
other incoherent dispersoids which can be either added extrinsically or precipitated out intrinsically. For
example, Al-Al
2
O
3
system is a dispersion strengthened alloy system where considerable strengthening is
achieved by Orowan mechanism.

11
Fig. 2.2.4: Shearing and bypassing of precipitates by dislocation [1]
2.2.6 Properties, Microstructure and Processing
Figure 2.2.5 shows variation of fracture toughness with yield strength for 6061 and 2014 alloys in
different aging conditions [2]. Fracture toughness is the highest in the UA condition and the lowest in the
PA condition, and starts increasing again in the OA condition but does not recover completely for the
same strength level observed in the UA condition. The variation of fracture toughness is similar to that of
ductility in different aging conditions. 2xxx series alloys are usually stretched after solution treatment to
improve strength. Figure 2.2.6 shows the effect of stretching on the fracture toughness-strength
relationship. The fracture toughness decreases considerably with stretching while strength increases. This
result is due to an increase in the dislocation density from stretching since dislocations act as nucleation
sites for precipitation. 7xxx series alloys are often used in T7 condition (stabilization by OA) to improve
stress corrosion resistance where strength is lower than that in the PA condition. Therefore, recent efforts
have focused on improving the strength of these alloys by using stretching prior to aging, which provides
higher strength while maintaining stress corrosion resistance.
Shearing
up to peak
aged
condition
Bypassing in
overage
condition
(Orowan)

12
Fig. 2.2.5: Variation of fracture toughness with tensile yield strength for different heat treatment
conditions for 6061 and 2014 alloys [2]
Fig. 2.2.6: Effect of stretching on the fracture toughness- yield strength relationship for different
conditions for 2xxx series alloy [2]
Fatigue crack growth rate, da/dN versus ΔK is shown for 7075-T6 and 2024-T3 in Fig. 2.2.7 [2]. There
are three regimes in crack growth rate curves: I - threshold regime where there is no crack growth until a
threshold stress intensity factor, K is applied, II – Paris regime where crack growth is controlled by the

13
power law (da/dN= A ΔK
m
) and regime III, where crack grows very rapidly leading to failure. 2024-T3
alloy has higher crack growth resistance compared to 7075-T6 alloy in all three regimes. Generally 2xxx
series alloys have better damage tolerance resistance than that of 7xxx series alloys and therefore, 2xxx
series alloys are used in fracture critical application and 7xxx series alloys are used in strength critical
applications in aircraft.
Fig. 2.2.7: Fatigue crack growth rate da/dn versus ΔK plot for 2024-T3 and 7075-T6 alloys [2]
Fig. 2.2.8: Variation of fatigue endurance limit with tensile strength for various aluminum alloys [2]
The fatigue strength generally decreases with an increase in the cycles to failure. The fatigue strength
depends on the tensile strength of material, showing higher values for higher tensile strength conditions.

14
Fatigue failure occurs by nucleation, growth and coalescence of voids where nucleation of cracks controls
majority of the life. The surface condition of the samples plays an important role on the fatigue life.
Therefore, fatigue samples are polished to avoid any premature crack nucleation. Aluminum alloys do not
have endurance limit, therefore strength at 10
7
cycles is considered as fatigue strength of the materials.
The variation of fatigue endurance limit with tensile strength is shown in Figure 2.2.8 for a number of
aluminum alloys. The plot shows a good (positive) correlation between fatigue strength and tensile
strength for aluminum alloys. It should also be noted that ductility of the material plays an important role
on fatigue strength indirectly. If the material has high strength and low ductility, it can fail well before the
material can attain full strength during straining. Therefore, both strength and ductility are important to
provide higher fatigue life.
2.2.7 Properties of Wrought Heat Treatable Aluminum Alloys
Wrought heat treatable aluminum alloys include 2xxx, 6xxx, 7xxx and 8xxx alloys. The most commonly
used aluminum alloys in aircraft applications are 2xxx and 7xxx series alloys. The nominal composition
of common alloys is given in Table 2.2.5 [3].
Table 2.2.5: Nominal composition of selected aerospace aluminum alloys
Alloy
Compositions in weight percent
2004
Al-6.0 Cu-0.4 Zr
2014
Al-4.4Cu-0.5Mg-0.8Mn-0.7Fe-0.5Si
2017
Al-4.0Cu-0.6Mg-0.7Mn-0.7Fe-0.5Si
2024
4.4Cu-1.5Mg-0.6Mn-0.5Fe-0.5Si
2219
Al-6.3Cu-0.3Mn-0.2Zr-0.3Fe-0.2Si
2224
Al-4.1Cu-1.5Mg-0.6Mn-0.15Fe-0.12Si
2324
Al-4.1Cu-1.5Mg-0.6Mn-0.12Fe-0.10Si
2519
Al-5.8Cu-0.2Mg-0.2Zr-0.3Fe-0.2Si
2618
Al-2.3Cu-1.5Mg-0.2 Mn-1.2Ni-0.1Zn-0.2(Ti+Zr)-1.2Fe-0.25Si
6013
Al-1.0Mg-0.8Si-0.35 Mn-0.3Fe-0.8Si
6113
Al-1.0Mg-0.8Si-0.35 Mn-0.3Fe-0.8Si-0.2O
7010
Al-6.2Zn-2.35Mg-1.7Cu-0.3Fe-0.2O
7049
Al-7.7Zn-2.45Mg-1.6Cu-0.15Cr-0.35Fe-0.25Si
7050
Al-6.2Zn-2.25Mg-2.3Cu-0.1Cr-0.15Fe-0.12Si

15
7055
Al-8.0Zn-2.05Mg-2.3Cu-0.1Zr-0.15Fe-0.1Si
7075
Al-5.6Zn-2.5Mg-1.6Cu-0.25Cr-0.4Fe-0.4Si
7079
Al-4.3Zn-3.2Mg-0.6Cu-0.2Mn-0.15Cr-0.4Fe-0.3Si
7093
Al-9.0Zn-2.5Mg-1.5Cu0.1Zr-0.15Fe-0.12Si-0.2O
7150
Al-6.4Zn-2.35Mg-2.2Cu-0.1Zr-0.15Fe-0.1Si
7178
Al-6.8Zn-2.8Mg-2.0Cu-0.23Cr-0.5Fe-0.4Si
7475
Al-5.7Zn-2.25Mg-1.6Cu-0.21Cr-0.12Fe-0.10Si
7085
Al-7.5Zn-1.5Mg-1.7Cu-0.08Zr
7068
Al-7.8Zn-2.6Mg-2.0Cu-0.1Mn-0.05Cr-0.1Ti-0.1Zr
The goal of aircraft designers to improve durability and save weight has led to the development of new
aluminum alloys that provide improved combinations of specific strength, durability and damage
tolerance. 2xxx series aluminum alloys are alloyed with Cu, Mg and Mn. This series of alloys provide
precipitation hardening through formation of S’ (Al
2
CuMg) for higher Mg containing alloys and
precipitation of ' (Al
2
Cu) for higher Cu to Mg ratio alloys upon heat treatment. They also contain Zr, Cr,
Mn or Ti to control the grain size. They are used as forgings and extrusions in civil transport and
supersonic aircrafts. These alloys have lower crack growth rates and thus have better fatigue resistance
than 7xxx series alloys. Therefore, these are used on lower wing and body skin. The alloys used are 2224,
2324 and 2524. These alloys are clad with 99.34% pure aluminum to improve corrosion resistance. The
cladding on 2017-T4 and 2024-T3 alloys consists of commercially pure aluminum metallurgically bonded
to either one or both surfaces of the sheet. The 2324-T39 and 2224-T3 alloys were developed by
modifying the composition and processing of standard 2024 alloy. The amount of cold work applied after
quenching from solution and prior to aging was increased from 1-3% (for 2024-T351 plate) to about 9%.
The allowable limits of Fe and Si impurities were reduced, and composition and processing were
modified to minimize constituent particles and to improve fracture toughness and reduce fatigue crack
growth rate. Processing conditions were also modified for extrusions in order to retain the deformation
crystallographic texture for additional texture strengthening.
Alclad 2xxx-T3 alloy (also known as C188 by Alcoa) was used as fuselage skin material for Boeing 777
aircraft. This material was developed to provide strength and fracture toughness combination to meet the
requirements of fuselage skin application. Fatigue crack growth resistance of this alloy is almost 2X better
than that of 2024-T3 sheet at high level of peak stress intensity factor (greater than 22 MPa√m). The
higher fracture toughness and higher crack growth resistance of this alloy were key attributes to provide
significant advantage for this application. The chemical composition and processing of the alloy were
used to control intermetallic particles to provide higher fracture toughness and fatigue crack growth
resistance. 2219 and 2618 alloys have superior high temperature capability compared to other commercial
aluminum alloys. 2219 alloy has higher Cu to Mg ratio which forms ' (Al
2
Cu) precipitate that improves

16
high temperature capability. 2618 alloy contains Fe, Ni and Mn which forms thermally stable dispersoids
such as Al
3
Fe, Al
6
Mn, Al
3
Ni, and Al
9
FeNi that provide high temperature capability. 2219 alloy is used
mostly in aerospace applications including liquid hydrogen tank for space shuttle due to its good strength
and fracture toughness at cryogenic temperatures. Figure 2.2.9 shows aircraft integral structure that
includes extrusions and plate of 2xxx series alloys such as 2024, 2124 and 2618.
The upper and lower wing structures of the Boeing 757 and 767 are manufactured with improved alloys
compared to Boeing 747. The 7xxx series alloys containing Zn and Mg additions offer the greatest
potential for precipitation hardening through precipitation of ’ (MgZn
2
) phase. Cu is added in the 7xxx
series alloys to improve stress corrosion cracking resistance. Stress corrosion cracking resistance
decreases with increasing Zn:Mg ratio. Most aluminum alloys contain small amount of Zr, Cr or Mn to
control grain growth by forming fine dispersoids on grain boundaries.
Fig. 2.2.9: Aircraft internal structure includes extrusions and plates of 2xxx alloys such as 2024,
2124 and 2618 [7].
Fig. 2.2.10 shows the use of advanced aluminum alloys with time in aircraft [8]. 7075-T6 is one of the
oldest alloys which was introduced in 1943 and first used on Navy’s P2V patrol bomber. Subsequently a
number of 7xxx series aluminum alloys were developed with improved mechanical properties. 7178-T6
alloy with higher strength was developed for use in structures which require compressive loading. 7079-
T6 alloy was introduced in forged sections in 1954, since it has higher strength and transverse ductility
than 7075-T6 alloy. X7080-T7 alloy has higher stress corrosion resistance than 7079-T6 alloy. It was
developed for thick parts, since it is relatively insensitive to quench rate, and can provide higher strength
even for thicker parts.
7050-T74 alloy was developed for thick section applications and has been used extensively in aircraft
applications. It has high strength, good stress corrosion cracking resistance and good fracture toughness
and fatigue resistance. 7050 alloy contains Zr instead of Cr that is present in 7075 alloy to control grain
size through formation of Al
3
Zr dispersoids which help in achieving higher toughness. Slightly higher Cu
and slight modification in the Zn:Mg ratio improves strength and stress corrosion resistance of 7050 alloy
compared with 7075 alloy. Therefore, 7050-T74 plates and forgings are the standard material for thick
section parts in aircraft application. 7150-T6 alloy plates and extrusions were used as wing skins and

17
stringers in the upper wing structures. Subsequently, 7475-T6 alloy with improved fracture toughness was
developed by modifying the composition for Cu, Zn, and Mg content and also by reducing Fe and Si
impurities. Fig. 2.2.11 shows critical aircraft wing structures which are made of 7xxx series alloy sheet or
integrally stiffened extrusion construction.
Fig. 2.2.10 Advancement of aluminum alloys with time for application in aircraft [8]
Fig. 2.2.11: Critical aircraft wing structures made of 7xxx series alloy sheet or integrally stiffened
extrusion construction; 7075-T73 or 7050 or 7475 are among the principal choices [7].
7150-T61 plate and extrusions are used on McDonnell Douglas MD-11. 7150-T77 alloy was developed
with a more balanced combination of strength, stress corrosion cracking resistance and fracture
toughness. 7150-T77 alloy plate and extrusions were used for the C17 cargo transport and fuselage
stringers for the Boeing 777 aircraft. Higher fracture toughness of 7150-T77 was related to the controlled
volume fraction of intermetallic particles and the unrecrystallized grain structure. Higher strength and

18
corrosion resistance of 7150-T77 alloy was attributed to the size and distribution of strengthening
precipitates. These precipitates reduce stress concentration at the grain boundaries through homogenizing
deformation and reduce electrochemical difference between the matrix and grain boundaries.
Subsequently, 7055-T77 alloy with even superior combination of strength, fracture toughness and stress
corrosion cracking resistance was developed compared to 7150-T6 and 7075-T76 alloy. 7055-T77 alloy
has about 10% higher strength compared to 7150-T6 alloy and about 30% higher strength compared to
7075-T76 alloy. 7055-T77 alloy has fracture toughness and crack growth resistance similar to that of
7150-T6 alloy and stress corrosion cracking resistance intermediate to those of 7075-T6 alloy and 7150-
T77 alloy. The intermetallics in the 7055-T77 alloy were minimized to provide higher fracture toughness.
The ratio of Zn: Mg and Cu: Mg was maintained at high level to provide an excellent combination of
strength, corrosion resistance, and fatigue strength and fracture toughness. This alloy was originally
developed for compressive loading condition but since then it has found significant interest in tensile
loading structures for aerospace applications. The 7055 alloy has strict restriction on solute content and
thermomechanical processing to produce a material that has higher strength, fracture toughness and
fatigue resistance than 7178-T6 along with improved resistance to stress corrosion cracking and
exfoliation.
Considerable advances have taken place in the development of newer 7xxx series alloys including 7090,
7091 and CW67 using a powder metallurgy (P/M) approach in order to improve the strength, toughness
and stress corrosion cracking resistance. This approach uses rapidly solidified powder produced by gas
atomization, followed by compaction and extrusion of the powder. These alloys contain Co, Ni and Zr,
which form very fine dispersoids of Al
9
Co
2
, Al
3
Ni and Al
3
Zr depending on the composition. These
dispersoids effectively pin the grain boundaries providing considerable strengthening through Hall-Petch
relation. The grain size of P/M alloys is finer than that of ingot based alloy, which provides additional
strengthening. The CW67 offers the best combination of strength and fracture toughness indicating
significant potential for weight savings for aerospace applications. However, development of P/M
aluminum alloys was not pursued vigorously due to higher cost and powder contamination issues.
2.2.8 Properties of Cast Aluminum Alloys
There are a number of cast aluminum alloys available for aerospace applications –see Table 2.2.6. Most
commonly used cast aluminum alloys (300 series) contain Si as a major alloying element to provide
fluidity which is essential for producing sound castings. Al-Si alloy with hypoeutectic composition is a
preferred alloy since it can provide good strength and reasonable ductility. Si precipitates as free Si during
aging of Al-Si alloys. Since Si has limited solubility in aluminum, it does not provide substantial
strengthening. Therefore, Mg and Cu are added to provide strength through precipitation strengthening.
Some of the casting alloys contain Ti and Mn to control grain growth through formation of intermetallic
particles at grain boundaries. 355 and 356 alloys are used commonly in aerospace applications. 357 alloy
has slightly higher strength compared to 355 and 356 alloys due to the presence of beryllium (Be) and is
used in space applications. Typically cast alloys containing ~7% Si are preferred because they provide
good strength with acceptable ductility. Al-Cu based cast alloys (200 series) have higher strength
compared to Al-Si alloys. However, these alloys suffer from hot tear leading to higher rejection rate.
Usually cast alloys have limited ductility due to lack of deformation processing. However, casting is
generally more economical and sometimes the only way to produce complex shaped products.

19
Table 2.2.6: Nominal composition of selected cast aluminum alloys
Alloy
Composition in weight percent
201
Al-4.6Cu-0.35Mg-0.35Mn-0.2Ti
213
Al-7.0Cu-2Si-2.5zn-0.6Mn-0.1Mg
355
Al-5Si-0.5Mg-0.5Mn-1.2Cu-0.35Zn-0.25Ti
356
Al-7.0Si-0.25Cu-0.3Mg-0.35Mn-0.35Zn-0.25Ti-0.6Fe
357
Al-7.0Si-0.55Mg-0.12Ti-0.055Be
360
Al-9.5Si-0.6Fe-0.35Mn-0.15Mg-0.5Ni-0.5Zn
413
Al-12Si-2Fe-1Cu-0.5Ni-0.5zn-0.35Zn
518
Al-8Mg-1.8Fe-0.35Mn-0.25Cu
Cast aluminum alloy components are produced by different casting methods: sand casting, investment
casting, die casting and permanent mold casting. Sand casting is commonly used for aluminum alloys for
large components. It has low tooling cost but high labor cost. It is an economical process to make good
quality aluminum alloy components even in small numbers. Investment casting is a more expensive
process, which has high tooling cost and also high labor cost. Investment casting is used for producing
very precise parts. Investment casting is also known as “lost wax” process where wax is used for making
intricate design of the casting which is removed by melting. Die casting is used for high precision
complex geometry parts with thin walls. Die casting requires very high tooling cost and has low labor
cost. Die casting is suitable for relatively small parts compared to sand casting. Sand casting is more
economical for small number of parts, whereas die casting will be more economical for large number of
parts. Die casting is very efficient as it can produce large number of parts in short time. However, since
die casting requires higher investment for casting machine and tooling for inserts, shot tube and piston tip
material, larger number of parts have to be produced using die casting to justify the tooling cost.
Permanent mold casting uses metal as split mold instead of expendable materials. The casting process is
selected depending on the size, shape and number of parts to be produced for aluminum alloys. Since cast
aluminum parts usually contain some porosity, most often they are hot isostatically pressed (HIPed) to
produce fully dense parts.
Traditionally aluminum alloy castings have been used in nonstructural parts in aircraft including pulley
brackets, quadrants, doublers, clips, ducts and wave guides. They also have been used extensively in
valve bodies of hydraulic control systems. The philosophy of most aircraft manufacturers has been to use
cast aluminum alloys only in the structures where failure of parts cannot cause loss of the aircraft. Figure
2.2.12 shows the picture of thixoformed A356.0-T6 inner turbo frame for the Airbus family of aircraft.

20
Fig. 2.2.12: Thixoformed A356.0-T6 inner turbo frame for the Airbus family of aircraft [7]
2.2.9 Low Density, High Modulus Al-Li Alloys
Aluminum-Lithium (Al-Li) alloys offer significant opportunity for weight savings due to their lower
densities and higher moduli. Each 1 wt% of Li added in aluminum reduces alloy density by about 3% and
increases modulus by about 6%. Li has high solid solubility (4 wt.% at 610⁰C, or 1120⁰F) in aluminum
and responds to age hardening, due to precipitation of an ordered metastable phase ' (Al3Li) that is
coherent and small misfit with the matrix. Due to these characteristics, Al-Li alloys attracted considerable
attention for the development of new generation of low density high modulus alloys for aerospace
applications. Specifically, Al-Li alloy 2195 has been used for cryogenic propellant tanks in the space
shuttle.
Table 2.2.7 Nominal composition and tensile properties of selected Al-Li based alloys [9-10]
Alloy
Composition in weight
percent
Temper
0.2%
Yield
Strength,
MPa
Ultimate
Tensile
Strength,
MPa
Elongation,
%
Fracture
Toughness,
MPam0.5
2091
Al-2Li-2.1Cu-1.5Mg-0.1Zr
T8X
(UA)
370
460
15
40
T851
475
525
9
25
8090
Al-2.4Li-1.3Cu-0.9Mg-
0.16Zr
T81
(UA)
360
445
11
45
T6
400
470
6
35
T851
455
510
7
30

21
2090
Al-2.3Li-2.7Cu-0.3Mg-0.5Zr
T83
510
565
5
-
8091
Al-2.6Li-2Cu-0.85Mg-
0.16Zr
T851
515
555
6
22
1421
Al-5Mg-2Li-0.2Mn-0.2Sc-
0.1Zr
T8
330
470
10
65
Weldalite
049
Al-6.3Cu-1.3Li-0.4Mg-
0.4Ag-0.18Zr
T8
725
797
9.8
-
2099
Al-2.7Cu-1.8Li-0.7Zn-
0.3Mg-0.3Mn-0.09Zr-
0.07Fe-0.05Si
T83
490
545
6
-
2199
Al-2.6Cu-1.6Li-0.55Zn-
0.23Mg-0.3Mn-0.09Zr-
0.07Fe-0.05Si
T8E79
345
400
8
42
T8E80
380
428
8
42
2195
Al-4.0Cu-1.0Li-0.6Mg-
0.25Mn-0.4Ag-0.12Zr-0.15
max Fe-0.12max Si
T84
530
556
9
37
2050
Al-3.55Cu-1.0Li-0.4Mg-
0.35Mn-0.25 max Zn-
0.45Ag-0.1Zr-0.1Fe max 0-
0.08 max Si
T84
476
503
8
36
Table 2.2.7 lists the compositions and properties of selected Al-Li based alloys. Most of the effort has
been concentrated on adding Li to 2xxx series alloys containing Cu, Mg and Zr. Initial alloy development
efforts included addition of high percentages of Li (2 to 3 wt.%) in alloys such as 2090, 2091, 8090 and
8091 to provide maximum benefit from density reduction. The Al-Li-Cu-Mg alloys are strengthened by
three types of precipitates: delta prime (Al
3
Li), T1 (Al
2
CuLi), and S’ (Al
2
CuMg). Most of the Al-Li alloys
contain a small amount of Zr similar to other aluminum alloys. The role of Zr is to twofold: Al
3
Zr
controls recrystallization and grain growth, and Al
3
Zr particles have similar L1
2
structure as delta prime
substituting the Al
3
Li precipitates forming Al
3
(Li, Zr). The presence of Zr improves strength and
toughness in Al-Li based alloys. The 2090 alloy containing Al-Li-Cu is hardened by delta prime and the
hexagonal T1 phase (Al
2
CuLi) that forms as thin plates on {111} planes. Plates of theta prime (Al
2
Cu)
may also be present in this alloy. Since nucleation of T1 and theta prime are difficult, cold working is
required prior to aging to promote uniform precipitation on dislocations (T8 condition). The 2091, 8090
and 8091 alloys contain S’ precipitate, which is resistant to shearing by dislocations, promoting more
homogeneous deformation. These alloys provide improved precipitation in the T8 condition. Fig. 2.2.13
indicates that Al-Li alloys have superior crack growth resistance compared to 2xxx and 7xxx series alloys

22
[11]. The Weldalite shows very high strength and acceptable ductility due to higher Cu and small Ag
addition. None of these high Li containing alloys showed widespread applications due to property
anisotropy, low toughness and poor corrosion resistance.
The chemical composition of Weldalite was modified to reduce Cu and Li (2195) to provide a more
balanced combination of strength, fracture toughness, corrosion resistance and fatigue crack growth
resistance. The 2195 alloy was developed to replace 2219 alloy for space shuttle hydrogen tank
application, which provided weight saving by about 20% both through material substitution. The 2195
alloy achieved first application in NASA’s mission STS-91, which required significant development and
characterization of the material in different processing conditions. The 2195 alloy today shows excellent
strength, fracture toughness and corrosion resistance. It has been used for space shuttle application
successfully for over 15 years demonstrating the capability for manufacturing of extremely large size
components. The 2195 alloy was produced by Alcan (Constellium) and space shuttle external tank was
produced by Lockheed Martin (Fig. 2.2.14).
Fig. 22.13: Fatigue crack growth rate behavior of Al-Li based 2090 alloy compared with 2124
and 7150 alloys [11]

23
Fig. 2.2.14: Fuel tank of the space shuttle made out of Al-Li based 2195 alloy [7]
Alcan has been very active in the past developing third generation of low density Al-Li alloys in
collaboration with aircraft manufacturers. The 2050 alloy has received significant attention due to its
attractive properties for medium and thick sections where it outperforms 2024 or 2027 alloys for strength,
fracture toughness, fatigue, corrosion resistance in addition to density and modulus. For higher thickness,
the 2050 alloy offers a low density alternative to 7050 alloy. Compared to 7050-T74, 2050-T4 shows
better strength-toughness combination at 5% lower density and improved stress corrosion resistance.
Compared to 2024-T351 alloy, 2050-T4 alloy shows significantly higher strength and corrosion resistance
in addition to lower density. Due to its attractive properties, 2050 alloy has entered industrial production
in large quantities for various commercial aircraft.
Fig. 2.2.15: Schematic representation of precipitates and dispersoids that contribute to strength
and toughness in 2099 and 2199 alloys [9]
Alcoa also has developed third generation Al-Li based alloys such as 2099 and 2199 with slightly lower
Li content with an excellent corrosion resistance, good fatigue crack growth resistance, a good strength

24
and fracture toughness combination, which resulted in a more balanced light weight high modulus
aluminum alloys [9]. Table 2.2.7 shows the composition and tensile properties of 2099 and 2199 alloys.
Figure 2.2.15 is a schematic representation of precipitates and dispersoids that contribute to strength and
toughness in 2099 and 2199 alloys. While strengthening in 2099 and 2199 alloys is achieved through T1,
' and -'precipitates, the contribution of T1 phase is the highest. T1phase is strongly affected by
stretching imparted to the alloy after quenching from solution and prior to aging. It has been shown that
as stretching increases, the strength-toughness relationship improves in Al-Li alloys. Stretching increases
the volume fraction and reduces the size of strengthening precipitates, and hence improves the strength-
toughness relationship. In addition, stretching also reduces the precipitation of T1 and T2 at grain
boundaries which helps to improve fracture toughness of the alloy. It is preferred to use T8 condition
instead of peak aged T6 condition for Al-Li alloys because T8 condition provides a higher strength and
toughness combination. The processing of 2099 and 2199 alloys is performed in such a way they have an
unrecrystallized microstructure to provide higher fracture toughness. The 2199 plate with thickness 0.5-
1.5” in T8E79 or T8E80 conditions has better properties than 2024-T351 plate which is used in lower
skin wing application for Bombardier. The 2099-T83 extrusions are commercially available in the
thickness range 0.05-0.3” which is used on the Airbus A380 in fuselage and floor applications. The 2199-
T8E74 is a commercial, high strength fuselage sheet product available in thicknesses greater than 0.125”
which has superior mechanical properties than Bombardier baseline fuselage sheet, 2024-T3 alloy.
Russian Al-Li based alloys, 1441 and 1421 (Table 2.2.7) have attractive mechanical properties. The 1441
(Al-Cu-Mg-Li) alloy is used in fuselage application for the Russian B-103 aircraft. It is cold-rollable and
has several attributes that make it attractive for fuselage skin applications, such as lower density, higher
specific modulus with similar strength as compared to conventional Al-Cu-Mg alloys. Another Russian
alloy 1421 (Al-Li-Mg-Sc-Zr) does not contain Cu but has lower density, excellent weldability and
superior corrosion resistance. This alloy has been used in a number of applications including fuel tanks,
fuselage stringers, cockpits and other aircraft parts.
3.2.10 High Temperature Aluminum Alloys
Considerable work has been done in the recent past in developing aluminum alloys for higher
temperature applications, up to 600⁰F [12-16]. Among these alloys, Al-Fe-V-Si, Al-Fe-Ce, Al-
Fe-Ce-W, Al-Fe-Mo-V, and Al-Cr-Zr-Mn alloys are the most notable. A few selected alloys are
listed in Table 3.2.11. In addition, Al-Zr-V and Al-Ti were also investigated for such
applications. Most of these alloys have incoherent dispersoids with volume fractions of 15-25 %.
The tensile strength of these alloys degrades considerably at higher temperatures due to
coarsening of dispersoids. The fracture toughness of most of these alloys are low, 8-15 MPa√m
except for Al-Fe-V-Si which had toughness of 36.4 MPa√m and the higher toughness of Al-Fe-
V-Si is due to delamination at stringers of intermetallic particles. The delamination may cause
reduction in transverse strength and ductility of Al-Fe-V-Si alloy. Fig. 2.2.19 shows variation of
fracture toughness with yield strength for Al-Fe-V-Si alloy. The fracture toughness decreases
sharply with an increase in the yield strength of the alloy similar to other aluminum alloys. Two
phase alloys have higher fracture toughness and strength combination than three phase alloys.

25
Table 2.2.11: Tensile properties of high temperature aluminum alloys
Alloy Composition in
Weight Percent
Test
Temperature,
C
Yield
Strength,
MPa
Ultimate
Tensile
Strength,
MPa
Elongation,
%
Fracture
Toughness
(K1C*),
MPam0.5
Al-8Fe-4Ce
25
418.9
484.9
7
8.5
316
178.1
193.8
7.6
7.9
Al-8Fe-2Mo-1V
25
323.5
406.6
6.7
9
316
170
187.5
7.2
8.1
Al-10.5Fe-2.5V
25
464.1
524.5
4
5.7
316
206.3
240
6.9
6.1
Al-8Fe-1.4V-1.7Si
25
362.5
418.8
6
36.4
316
184.4
193.8
8
14.9
Al-5Cr-2Zr
25
326
351
18
11.2**
* Computed K1C from J1C data
** KQ measured
Fig. 2.2.19: Variation of fracture toughness with yield strength for Al-Fe-V-Si alloy [12]

26
3.2.11 Discontinuously Reinforced Aluminum (DRA)
Discontinuously reinforced aluminum (DRA) offers superior mechanical properties including higher
modulus, tensile strength, fatigue strength and creep resistance compared to unreinforced aluminum
alloys [17-21]. However, the ductility and the fracture toughness of DRA are lower than that of
unreinforced matrix alloys. The properties of DRA can be tailored to meet the requirements for the target
applications. DRA consists of aluminum alloys as a matrix and SiC, B
4
C, TiB
2
, TiC and Al
2
O
3
particulates as reinforcement to provide improved properties. The properties of DRA depend on three
constituents: matrix alloys, reinforcements and matrix-reinforcement interface. The matrix alloys are
typically 6061, 2124, 7075, 7093, A360. Selection of matrix alloy depends on the compatibility with
ceramic reinforcements for the processing techniques utilized to produce DRA materials. The properties
of matrix alloys of interest are density, strength, ductility, and modulus and fracture toughness. The
selection of reinforcement particulates is based on density, hardness, modulus, strength, and shape,
compatibility with the matrix, thermal stability and cost. In addition, a good interface between matrix and
reinforcement is necessary for improved mechanical properties.
DRA can be produced either by a powder metallurgy process or by a casting process. Powder metallurgy
process includes conventional powder process, reaction dispersion (XD) method and spray deposition
(Osprey). In conventional powder metallurgy process, matrix alloy and reinforcement powder are blended
together and compacted to produce dense billet. In XD process, the reinforcement is created in-situ by
reacting Ti with B to form TiB
2
reinforcement. In spray deposition, matrix and reinforcement powders are
mixed in the atomization zone and the mixture is deposited on the substrate, which solidifies to form
dense billet. Spray deposition eliminates a number of steps required in the conventional powder
processing method. The casting process includes simple mixing method where reinforcement is mixed in
molten liquid and poured in the mold to solidify. This process is suitable for relatively small volume
fraction of reinforcements. It is hard to keep uniform distribution of reinforcement in molten metal due to
density difference. Most ceramic reinforcements have higher density compared to the aluminum alloys
matrix. In pressure infiltration casting method, preform is produced with ceramic particles and molten
metal is forced into the pre-form by applying pressure. This method is applicable to composites having
relatively high volume fraction of reinforcement, which provides higher modulus and lower thermal
expansion coefficient. In semisolid casting method, pressure is applied in the mushy region where both
liquid and solid are present. Casting process is useful for making complicated shape at lower cost, which
is difficult to produce by a powder metallurgy process. Powder metallurgy process can provide more
uniform distribution of reinforcements and better mechanical properties than casting. Two powder based
materials, 6092 Al/17%SiCp and 2009 Al/20%SiC, are used in commercial applications [22]. 6092/17%
SiCp is used for ventral fin and fan exit guide vane applications and 2009/15% SiC is used for rotating
components in the European helicopter.

27
Fig. 2.2.20: Elastic modulus of Al, DRA and titanium showing that DRA has higher specific modulus
compared to Al and titanium alloys [22]
The elastic moduli of DRA materials are compared with those of aluminum and titanium alloys in Figure
2.2.20. The modulus of DRA with 15 vol. % B
4
C is considerably higher than those of aluminum alloys as
reinforced particles provide higher modulus through load transfer. The modulus depends on the volume
fraction of reinforced particles. The rule of mixture can be used to predict the modulus of the DRA
materials [20-21].The modulus of DRA with high volume fraction of B
4
C reinforcement can be higher
than that of titanium and has the potential to replace titanium alloys for stiffness critical applications.

28
Fig. 2.2.21: Yield strength of aluminum composites and aluminum alloys [22]
Figure 2.2.21 shows the yield strength of 2009/15% SiC, 6092/17.5% SiC, 6092/25% SiC and 7xxx/15
vol. % SiC composites along with unreinforced aluminum alloys. DRA materials have significantly
higher yield strength than aluminum alloys and generally follow the matrix yield strength [17-20]. The
ceramic reinforcement provides higher yield strength in the aluminum matrix through composite
strengthening by load transfer from high modulus reinforcement to the matrix aluminum alloy. The
ductility of DRA is generally reduced due to the presence of ceramic reinforcement. The ductility depends
on the size, volume fraction and the distribution of the reinforcement. The size and volume fraction of the
reinforcement are selected in such a way that they provide a balanced combination of strength and
ductility required for the application.
Acknowledgements
The author would like to thank Mike Maloney, Chris Rhemer, Dave Furrer and Frank Preli from Pratt &
Whitney for their support and approval to publish this article. The author would also like to thank Dan
Miracle, Kevin Kendig and Jonathan Spowart from Air Force Research Laboratory, Biliyar Bhat from
NASA Marshall Space Flight Center and Mark van den Bergh from DWA Composites for useful
discussions.

29
References
1. Polmear, I.J., Light Alloys, Metallurgy of the Light Metals, Edward Arnold, London, 1989.
2. Hatch, J.E, Aluminum: Properties and Physical Metallurgy, ASM International, 1984.
3. Starke Jr., E.J. and Staley, J.T., Prog. Aerospace Sci., Vol. 32, pp. 131-172, 1996.
4. Aluminum and its alloys used in Aircraft: http://hsc.csu.au/enginering_studies/aero_eng/2580/aluminum
alloys.html
5. Ravi Chandran, K.S., University of Utah, Private Communications, 2011.
6. Hertzberg R.W., Deformation and Fracture Mechanisms of Engineering Materials, 3
rd
eds. Wiley
Publishing, 1989.
7. Kaufman, J.G., Introduction to Aluminum Alloys and Tempers, ASM International, 2000.
8. Sanders, R.E., Alcoa Technical Center, TMS Presentation on The Influence of Disruptive Innovation on
Today’s Aluminum Products, 2006.
9. Giummarra, C., Thomas, B. and Rioja, R.J., in Proceedings of the Light Metals Technology Conference,
2007.
10. Lequeu, P.H., Smith, K.P. and Danielou, A., JMEPEG, ASM International, pp. 841-847, 2010.
11. Pandey. A.B., Composites, ASM Handbook, Vol. 21, pp. 150-159, 2006.
12. Skinner, D.J. in eds. Y-W. Kim Y-W., W.M. Griffith, Dispersion Strengthened Aluminum Alloys, TMS
Publishing; p. 181, 1988.
13. Kim,Y-W, “Dispersion Strengthened Aluminum Alloys” edited by Y-W Kim and W.M Griffith, TMS
Annual Meeting, Arizona, January, p.157, 1988, .
14. Palmer, I.G., Thomas, M.P., and Marshall, G.J., “Dispersion Strengthened Aluminum Alloys” edited by
Y-W Kim and W.M Griffith, TMS Annual Meeting, Arizona, p.217, 1988.
15. Chan, K.S., in eds. Y-W. Kim Y-W., W.M. Griffith, Dispersion Strengthened Aluminum Alloys, TMS
Publishing; pp. 283-308, 1988.
16. Kendig, K.L. and Miracle, D.B., Acta Materialia, 50, pp. 4165-4175, 2002.
17. Pandey, A.B., Kendig, K.L. and Miracle, D.B., Affordable Metal Matrix-Composites for High
Performance Applications, (eds. A.B. Pandey, K.L. Kendig and T.J. Watson), The Minerals, Metals and
Materials Society, pp. 36-45, 2001.
18. Hunt, W.A. Jr., Processing and Fabrication of Advanced Materials III, pp. 1663-681, (eds. V.A. Ravi, T.S.
Srivatsan and J. J. Moore), the minerals, Metals and Materials Society, 1994.
19. Pandey, A.B., Shah, S.S., and Shadoan, M., Affordable Metal-Matrix Composites For High Performance
Applications II, (eds. A.B. Pandey, K.L. Kendig, J.J. Lewandowski and S.R. Shah), The Mineral, Metals
and Materials,. PP. 3-12, Nov. 9-12, 2003.
20. Pandey, A.B., Majumdar, B.S., and Miracle, D.B., Metall. Trans. A, vol. 29A, 1237, 1998.
21. Pandey, A.B., Majumdar, B.S., and Miracle, D.B., Metall. Trans. A, vol. 31A, 921, 2001
22. DWA Composites: http://www.dwa-dra.com/advantages.asp

30
2. 3 Titanium Alloys
Sesh Tamirisakandala, Ernie M. Crist, and Patrick A. Russo
RTI International Metals, Inc.
2. 3.1. Introduction
Titanium (Ti: atomic number 22) is the ninth-most abundant element in the earth's crust at a level of about
0.6% and is the fourth-most abundant structural metal after aluminum, iron, and magnesium. High
strength, low density, excellent corrosion resistance, and biocompatibility are the principal characteristics
that make titanium attractive for a variety of applications. Examples include aircraft (high strength in
combination with low density), aero-engines (high strength, low density, fatigue and good creep
resistance up to about 550°C), biomedical devices (corrosion resistance, high strength, low elastic
modulus, and biocompatibility), and chemical processing equipment (corrosion resistance). As a
structural metal, Ti is still in its infancy, compared to steel and aluminum. The major use (approximately
60% of the titanium manufactured worldwide) is still in airborne applications such as aero-engines,
airframes, missiles, and spacecraft. This section provides a brief overview of characteristics of titanium
alloys to set the stage for aerospace applications described in later chapters in this book.
Some of the basic characteristics of Ti and its alloys are listed in Table 2.3.1 and compared to those of
other structural metallic materials based on Fe, Ni, and Al. Although Ti has the highest strength-to-
density ratio, it is the material of choice only for certain niche application areas because of high cost. This
high cost is mainly a result of the high reactivity of titanium with oxygen and high raw material cost. The
use of vacuum or inert atmosphere is required during the production processes of Ti metal extraction as
well as during melting processes to avoid oxygen contamination. The relatively high cost of titanium has
hindered wider use, for example in automotive applications. To minimize the inherent cost problem,
successful applications must take advantage of the special features and characteristics of titanium that
differentiate it from competing engineering materials, thereby making its usage cost effective. Doing so
requires a more thorough understanding of Ti alloys as compared to other, less expensive materials,
including the interplay between cost, processing methods, and performance.
The classic comparison between titanium and other aerospace metals is on a strength-to-weight ratio basis
as shown in Figure 2.3.1 [1]. Tensile strengths as a function of temperature for commercial purity (CP)
titanium and workhorse Ti alloy Ti-6Al-4V (Ti-64) are compared with those of 7075-T6 aluminum alloy,
precipitation hardening (PH) stainless steel (17-4PH), and nickel base superalloy IN718 in Figure
2.3.1(a). Note that strength comparisons without density considerations are not so favorable for Ti alloys.
However, the use of titanium in aircraft applications is greatly dependent on these density adjusted
properties and makes Ti alloys very attractive (Figure 2.3.1b). Unalloyed Ti (CP Ti), on the other hand, is
not attractive for aerospace structural applications due to low strength (absolute as well as specific). Some
Ti alloys provide outstanding specific strength advantages at cryogenic temperatures also as shown in
Figure 2.3.1(b).The much higher melting temperature of Ti as compared to Al, the main competitor in
light weight structural applications, gives titanium a definite advantage at application temperatures in
excess of about 150°C. The high reactivity of titanium with oxygen limits the maximum use temperature
of Ti alloys to about 600°C. Above this temperature, rapid ingression of oxygen through the surface
occurs that leads to the formation of oxide scale and a brittle subsurface oxygen enriched layer (known as
alpha case) underneath the scale. The high reactivity with oxygen, on the other hand, leads to the on the

31
immediate formation of a stable, adherent, and epitaxial oxide layer on the surface when exposed to air,
resulting in the superior corrosion resistance of titanium in various kinds of aggressive environments,
especially in aqueous acid environments. Superior corrosion resistance rather than strength is the primary
reason for many industrial applications (e.g. chemical, oil and gas, etc.) of titanium. Emerging energy
industry applications attempt to take advantage of higher strength of Ti alloys combined with superior
corrosion resistance in hot aqueous corrosive environments (e.g. offshore risers, deep well tubulars).
Table 2.3.1. Important characteristics of Ti alloys as compared to other structural metallic materials.
Characteristic
Ti
Fe
Ni
Al
Melting point (°C)
1670
1538
1455
660
Crystal structure
bcc (β), hcp (α)
fcc (γ), bcc (α)
fcc
fcc
Phase transformation (°C)
882 (β→α)
912 (γ→α)
-
-
Elastic modulus (GPa)
115
215
200
72
Yield stress (MPa)
1000
1000
1000
500
Density (g/cm
3
)
4.5
7.9
8.9
2.7
Thermal expansion coefficient (10
-6
/°C)
9
11.8
13.4
23.1
Thermal conductivity, (W/m°C)
7
80
90
237
Heat capacity (J/kg°C)
530
450
440
900
Electrical resistivity (µΩm)
1.67
0.09
0.07
0.03
Corrosion resistance (relative)
Very high
low
medium
high
Reactivity with oxygen (relative)
Very high
low
low
High
Metal cost (relative)
Very high
low
high
medium
Figure 2.3.1: (a) Ultimate tensile strength and (b) specific ultimate tensile strength of titanium compared
with other structural metal alloys (Al, steel, and Ni) as a function of service temperature.
2.3.2. Titanium Alloys Classification

32
Ti has an unfilled d electron shell thereby classifying it as a transition metal. It is allotropic, existing in
two allotropic forms, hexagonal close-packed (hcp) crystal structure α phase that is stable up to 880°C,
which transforms to a body-centered cubic (bcc) β phase, which is stable up to the melting point
(1670°C). Alloying elements added to Ti are categorized according to how they affect the beta transus
temperature (α→β phase transformation temperature) as shown in Figure 2.3.2. The most common α
stabilizers are Al, which forms a substitutional solid solution, and O, N, C, which form interstitial solid
solutions. Beta phase can be stabilized via two types of elemental additions – isomorphous (V, Mo, Nb,
Ta) and eutectoid (Fe, Cr, Ni, Co, Cu, Si, Mn, H). Of these β stabilizers, only hydrogen (H) is an
interstitial addition. The eutectoid additions develop a eutectoid reaction with the presence of compounds
in the system at equilibrium. The isomorphous systems show continuous presence of beta phase without
the formation of any compounds. Some reasons for adding β stabilizers include solid solution
strengthening, strengthening via microstructure refinement, microstructure modification by heat treatment
and thermo-mechanical processing (TMP) which is important for secondary property improvement,
improved hardenability, enhancement of workability, and improved tolerance to H. The neutral additions,
Sn and Zr, are important to develop an enhanced base alloy especially designed for high temperature
usage.
Figure 2.3.2: Influence of alloying elements on phase diagrams of Ti alloys (schematic).
Commercial Ti alloys are classified conventionally into three basic groups: α and near-α, α+β, and near-β
(or metastable β) and β, according to their position in a pseudo-binary section of phase diagram
schematically shown in Figure 2.3.3(a) [2]. Each group has a distinct set of properties qualitatively
compared in Figure 2.3.3(b) with respect to the workhorse alpha+beta alloy Ti-6Al-4V. This figure
indicates a few important trends: i) alloys with higher beta content can be heat treated to higher strengths,
ii) however, this trend comes with a deficit in weldability, α alloys having better weldability than α+β or β
alloys, iii) alloys leaner in β content generally have better high temperature creep resistance, iv) at
equivalent strength levels, metastable β alloys have better formability. A clarification of the term
metastable beta alloy is needed. A beta titanium alloy technically would be an alloy which is shown to
contain only beta phase at room temperature under equilibrium conditions. However, most titanium alloys
are not enriched enough in beta stabilizing elements to create such an alloy except in cases requiring
corrosion resistance beyond what conventional alloys can offer. In addition, since beta titanium alloys
cannot be heat treated to high strength and are quite dense due to the addition of large quantities of heavy
alloying elements, they have a very small niche in the overall titanium alloy systems. Metastable beta
titanium alloys are defined as alloys that can be quenched from above their beta transus and retain all beta
phase in a small sample. Since the alloy system indicates that under equilibrium the alloy should contain
both alpha and beta phases, this alloy group is termed metastable beta. It has the potential to precipitate

33
the alpha phase during heat treatment that gives this alloy group high strength capability as compared to
stable β alloys.
(a) (b)
Figure 2.3.3: Schematic pseudo-binary section of β isomorphous phase diagram (M
s
: Martensite start) and (b)
qualitative comparison of main characteristics of different Ti alloy family groups.
In addition to the substitutional alloying elements, changes in mechanical properties of Ti can be altered
quite markedly by interstitial elements such as O, C, N, and H. These elements can enter into titanium as
impurities in raw materials or can be introduced as controlled additions within specification limits for
beneficial effects. Generally, they increase strength at acceptable levels of reductions in ductility and
damage tolerance. For example, about 0.1% N (by weight) more than doubles the strength of titanium but
reduces ductility in half. Large additions of the interstitials (still less than 1%) can embrittle titanium to
the point of engineering uselessness. Thus, in seeking beneficial changes in properties by alloying, the
interstitial additions must be carefully controlled. Several strength levels of unalloyed commercially pure
titanium are thus produced by controlling the level of interstitials. Similarly, several grades of selected
titanium alloys (such as commercially pure Ti, Ti-6Al-4V, Ti-5Al-2.5Sn) are produced by controlling the
oxygen content. The one interstitial which offers no mechanical property improvement in titanium and
must be maintained at very low levels, usually less than 125 ppm, is hydrogen. It can be absorbed by Ti
during hot processing especially when reducing furnace atmospheres are present, and during the acid
pickling of titanium for surface cleaning. Unlike the other interstitials, hydrogen can be easily removed by
vacuum annealing at a lower temperature. However, this process is expensive and the controls to limit
absorption of hydrogen are favored.
For a given Ti alloy, properties can be further improved via processing. Alloying lays the basis for an
increase in strength (via solid solution strengthening, age hardening, etc.), allows the generation of
ordered structures (e.g. Ti
3
Al), determines most physical properties (density, modulus, CTE, etc.), and
largely controls the chemical resistance (corrosion, oxidation). Processing allows the careful balancing of
property combinations of Ti alloys. Depending on the property desired in the final application, different
microstructures can be generated in Ti alloys by means of thermo-mechanical processing (TMP) to
optimize for strength, ductility, toughness, durability and damage tolerance, creep resistance, formability,
etc. The microstructure of conventional Ti alloys is primarily described by the size and arrangement of
the two phases α and β. The two extreme cases of phase arrangements, shown in Figure 3.3.4, are the
lamellar microstructure, which is generated upon cooling from the beta phase field, and the equiaxed

34
microstructure, which is a result of a recrystallization process. Both types of microstructures can have a
fine as well as a coarse arrangement of their two phases. A mix of lamellar plus equiaxed, referred to as
bi-modal (or duplex), provides the required balance of properties for certain applications. Table 2.3.2
shows qualitatively how the size and arrangement of the phases influence various properties.
Figure 2.3.4: Three typical microstructural classes of titanium alloys, lamellar, equiaxed, and bi-modal
(backscattered electron images, contrast: α: gray and β: white).
Table 2.3.2: Influence of microstructural parameters on the mechanical properties (qualitative)
fine
coarse
Property
Lamellar
Equiaxed
0
0
Modulus
0
+/- (texture)
+
–
Strength
–
+
+
–
Ductility
–
+
–
+
Fracture toughness
+
–
+
–
Fatigue crack initiation
–
+
–
+
Fatigue crack growth rate
+
–
–
+
Creep strength
+
–
+
–
Superplasticity
–
+
+
–
Oxidation behavior
+
–
A list of the most important commercial alloys belonging to each of the three different groups is shown in
Table 2.3.3. Alpha alloys are primarily chosen for corrosion resistance and fabricability (formability and
weldability) applications (chemical processing equipment, heat exchangers, pumps, piping, etc.). Alpha +
beta alloys are by far used in the greatest quantities and are applied when higher strength and better
fracture resistance, fatigue strength or elevated temperature capability with good corrosion resistance are
needed (aircraft structures, aircraft engines, steam turbine blades, spacecraft components, etc.). These are
most readily grouped by strength, use temperature, and microstructural condition. Strength classification
includes: low strength alloys: tensile yield strength (TYS) ≤ 800 MPa (115 ksi), medium strength alloys:
TYS 825-900 MPa (115-130 ksi), and high strength alloys: TYS 900-1175 MPa (130-170 ksi). High
temperature alloys are classified by use temperature ≥325°C but ≤550 °C. Three distinct microstructural
conditions achieved by thermo-mechanical processing include (a) fully lamellar for high toughness and
lower strength, low ductility, high creep strength, (b) fully equiaxed for high ductility, lower toughness
than fully lamellar, lower strength than bi-modal, lower creep strength than fully lamellar, and (c) bi-
modal for balance between fully lamellar and fully equiaxed. Metastable beta alloys are applied where

35
very high strength with acceptable fracture resistance is needed (aircraft landing gear, fasteners, springs,
heavily loaded parts in jet engines and helicopters, etc.). Most commonly used Ti alloys for aerospace and
space applications are: Ti-5-2.5, Ti-3-2.5, Ti-6-4 (regular and extra-low interstitial ELI grades), Ti-6242,
Ti-6246, Ti-17, Ti-10-2-3, Beta 21S, Ti-15-3, and Beta C
.
Table 2.3.3 Important commercial titanium alloys.
Common Name
Alloy Composition (wt%)
Beta Transus (°C)
α Alloys
CP Ti Grade 1
Ti-0.2Fe-0.18O
890
CP Ti Grade 2
Ti-0.3Fe-0.25O
915
CP Ti Grade 3
Ti-0.3Fe-0.35O
920
CP Ti Grade 4
Ti-0.5Fe-0.40O
950
CP Ti Grade 7
Ti-0.2Pd
915
CP Ti Grade 12
Ti-0.3Mo-0.8Ni
880
Ti-5-2.5
Ti-5Al-2.5Sn
1040
Ti-3-2.5 (half Ti-6-4)
Ti-3Al-2.5V
935
α+β Alloys
Ti-811
Ti-8Al-1V-1Mo
1040
IMI 685
Ti-6Al-5Zr-0.5Mo-0.25Si
1020
IMI 834
Ti-5.8Al-4Sn-3.5Zr-0.5Mo-0.7Nb-0.35Si-0.06C
1045
Ti-6242
Ti-6Al-2Sn-4Zr-2Mo-0.1Si
995
Ti-6-4
Ti-6Al-4V-0.20O
995
Ti-6-4 ELI
Ti-6Al-4V-0.13O
975
Ti-662
Ti-6Al-6V-2Sn
945
Ti-6-22-22
Ti-6Al-2Sn-2Zr-2Mo-2Cr-0.15Si
960
IMI 550
Ti-4Al-2Sn-4Mo-0.5Si
975
β Alloys
Ti-6246
Ti-6Al-2Sn-4Zr-6Mo
940
Ti-17
Ti-5Al-2Sn-2Zr-4Mo-4Cr
890
SP-700
Ti-4.5Al-3V-2Mo-2Fe
900
Beta-CEZ
Ti-5Al-2Sn-2Cr-4Mo-4Zr-1Fe
890
Ti-5-5-5-3
Ti-5Al-3V-3Mo-3Cr
860
Ti-10-2-3
Ti-10V-2Fe-3Al
800
Beta 21S
Ti-15Mo-2.7Nb-3Al-0.2Si
810
Ti-15-3
Ti-15V-3Cr-3Al-3Sn
760
Beta C
Ti-3Al-8V-6Cr-4Mo-4Zr
730
B120VCA
Ti-13V-11Cr-3Fe
700
Conventional alloy development activity in Ti alloys is focused on affordable processing methods via
minor chemistry tweaks and incremental property improvements. Recently, a third option of titanium
matrix composites (TMCs) has gained importance [3]. TMCs consist of a titanium matrix containing
continuous reinforcing fibers (35-40 vol%) such as SiC. The principal attractions of TMCs are strength
and stiffness. On a density-corrected basis, SiC reinforced TMCs have about twice the ultimate strength
and stiffness of conventional Ti alloys, measured parallel to the fiber direction. In principle, this makes
them the most structurally efficient engineering materials. In practice, it is often difficult to fully
capitalize on the unidirectional capability of TMCs in a component, because off-axis loads are usually
present. Because of the fiber reinforcement, TMCs are extremely anisotropic, which creates a challenge to
maximize the benefits of the longitudinal properties while minimizing the penalties associated with the
lower transverse properties. The cost of TMC components is very high. An early, but important, small
volume production application of TMCs was established in 1999 for augmenter actuator links in a large

36
(F-16 class) military engine. The TMC link weight is roughly 50% of that of the superalloy link. Other
successful applications include landing gear components and NASA’s Super Lightweight Interchangeable
Carrier. An alternate means of utilizing TMCs at lower total cost is the use of selective reinforcement in
locations where the greatest benefit can be created. A number of important recent developments were
made to commercialize TMCs.
Figure 2.3.5 Specific tensile strength as a function of use temperature of selected structural materials
compared with Ti alloys and gamma Ti aluminides. (CFRP: Carbon Fiber Reinforced Plastics)
Alloy design for high temperature service requiring creep resistance evolved since the 1950s and is based
on four principles: i) control the beta stabilizing elements such as Mo, V, and Nb at levels slightly above
their solid solubility in alpha phase, and minimize Fe and Ni, as they all enhance creep rates due to rapid
diffusion rates, ii) addition of trace silicon that forms silicides which are effective barriers to plastic
deformation at elevated temperatures, iii) introduction of Ti
3
Al precipitates via a final stabilization
treatment to create effective barriers to deformation, iv) microstructure engineering to produce size and
morphology that provide better creep resistance. Intermetallic compounds based on titanium and
aluminum are light (low density), relatively stiff (high modulus), and have attractive high temperature
mechanical properties (tensile and creep strength) as shown in Figure 2.3.5 [4,5]. Historically, the issues
associated with reduced ductility and fracture toughness of γ-TiAl intermetallic alloys have been viewed
as significant hurdles and outweigh the benefits of increased strength. Consequently, the use of
intermetallic compounds in structural applications has been very limited. Because of their promise,
however, there has been a great deal of work on these compounds beginning in 1953 and continuing up
until now. In some regards, the effort to introduce these compounds for structural applications illustrates
the difficulty associated with the introduction of any new class of material. That is, more than 60 years
have passed and the titanium aluminides are still considered developmental materials. The primary barrier
has been concern about brittleness, but newer alloyed versions of both Ti
3
Al (α
2
aluminide) and TiAl (γ-
aluminide) have alleviated many of these concerns. The principal concern at present is cost and attainable
performance improvement. Perhaps the single most attractive current application for γ alloys is for low
pressure turbine (LPT) blades in aero-engines. For LPT blades, γ alloys would replace conventionally cast
Ni base blades made from superalloys such as Rene 77. The maximum service temperature for these LPT
blades is about 750°C and the γ alloys have adequate creep strength up to this temperature. The γ alloys
also have adequate surface stability at these temperatures and therefore retain their strength for extended
service periods without embrittlement. Since these blades are rotating components, the reduced mass

37
translates into lower loads on the LPT disk. Utilizing the γ alloys, the original Ni alloy disk can be
reduced in mass while maintaining constant levels of operating stress. In the weight critical aero-engine
industry, this is considered almost unheard of for a single material change and thus it is extremely
attractive.
2.3.3. Strengthening Mechanisms
From the four different hardening mechanisms in metallic materials (solid solution hardening,
strengthening by a high dislocation density, boundary hardening, and precipitation hardening) solid
solution and precipitation hardening are utilized in all commercial titanium alloys [6]. Boundary
hardening plays a significant role in α+β alloys cooled at high rates from the β phase field reducing the α
colony size to a few α plates or causing martensitic transformation. The martensite in titanium is much
softer than the martensite in Fe-C alloys because the interstitial oxygen atoms only cause small elastic
distortion of the hexagonal lattice of the titanium martensite. This is in sharp contrast to carbon and
nitrogen that cause severe tetragonal distortion of the bcc lattice in ferrous martensite.
The α-phase is significantly hardened by the interstitial element oxygen. This is best illustrated by
comparing the yield stress values of the CP titanium grades 1-4 with oxygen levels between 0.18 and
0.40%, which have yield stresses in the range 170 MPa (Grade 1) to 480 MPa (Grade 4). In commercial
titanium alloys, the oxygen content varies between about 0.08% and 0.20% depending on alloy type.
Substitutional solid solution hardening of the α phase is caused mainly by the elements Al, Sn, and Zr
which have fairly large atomic size differences compared to titanium and also has large solid solubilities
in the α phase.
Precipitation hardening of the α phase occurs by coherent Ti
3
Al particles above about 5% Al. These Ti
3
Al
or α
2
particles have an ordered hexagonal structure and since they are coherent, they can be sheared by
moving dislocations resulting in planar slip and extensive dislocation pile-ups against boundaries. With
increasing size, these α
2
particles become ellipsoidal in shape, the long axis being parallel to the c-axis of
the hexagonal lattice. This α
2
phase is further stabilized by the elements O and Sn, i.e. the (α+α
2
) phase
region is pushed to higher temperatures by these elements. In such cases, Sn substitutes for Al whereas
oxygen remains as an interstitial. The Ti
3
Al phase can be deleterious in two basic situations. The first
situation involves titanium being used in sea water under stress, thereby making the given titanium alloy
susceptible to sea water stress-corrosion cracking. Alloy compositions and heat treatments must be
tailored to reduce the tendency to form the Ti
3
Al phase. Ti-6Al-4V ELI (extra low interstitial) alloy has
been historically a good choice for such applications. The other situation involves high temperature creep
alloys, which can be embrittled by Ti
3
Al during long thermal exposures such as encountered in jet engine
applications. These situations are circumvented by the formulation of alloys restricting the Al, Sn, Zr, and
O contents to levels based on experience. The Ti-6Al-2Sn-4Zr-2Mo-Si alloy has logged hours of in-
service usage in the 450 – 550°C temperature range without difficulty due to Ti
3
Al embrittlement.
It is difficult to analyze solid solution strengthening of the β phase in a traditional sense because in fast
cooled metastable β alloys the precursors of the metastable ω and β' phases cannot be separated from the
solute effects. Also, in fully aged microstructures it is difficult to separate the hardening due to α
precipitates from the solute effects. In this case, an important solid solution strengthening effect of the β
phase is due to alloy element partitioning that accompanies α precipitation. One way to estimate the solid
solution strengthening of the β stabilizing elements is to examine the slope of the lattice parameters

38
versus solute content curves for binary alloys pointing out in a qualitative way the size misfit parameter.
The strengthening effects of beta stabilizers from this analysis are greatest for Fe followed by Cr, V, Nb
and Mo.
2.3.4. Processing of Titanium Alloys
Typical production flow chart to convert ores of titanium, which exist as titanium black sand, to a range
of useful mill products used in aerospace applications is shown in Figure 2.3.6 [7]. Metallic titanium, as
obtained from the ore, is called sponge because it is porous and has a sponge-like appearance. The
starting ore for the production of Ti is either rutile (TiO
2
) or ilmenite (FeTiO
3
). The extraction of metallic
Ti from these ores occurs in five distinct operations: chlorination of the ore to produce TiCl
4
, distillation
of the TiCl
4
to purify it, reduction of the TiCl
4
to produce Ti, purification of metallic Ti to remove by-
products, and crushing and sizing of the sponge to create suitable product for subsequent melting to make
ingots. In the 1930’s, Dr. Wilhelm Kroll invented the first viable, large-scale industrial method based on
Mg reduction to form Ti sponge, which is still the principal process for Ti production today.
Figure 2.3.6 Typical production flowchart for titanium sponge, mill products, and castings.

39
Melting of crushed titanium sponge along with alloying elements takes place in either a vacuum arc
remelt (VAR) furnace, to produce VAR ingots typically used for aerospace applications, or in a cold
hearth (electron beam or plasma arc) furnace, to produce feedstock for a subsequent VAR melt. In the
VAR furnace, the electrode is consumable melted by an arc struck between it and a layer of titanium in a
water-cooled copper crucible. The molten titanium on the outer surface solidifies on contact with the cold
wall, forming a shell or skull to contain the molten pool. The ingot is not poured, but solidifies under
vacuum in the melting furnace. A second melt insures homogeneity of the ingot for industrial purposes, a
triple melting operation is used for titanium destined for critical aerospace applications such as rotating
parts in jet engines. The resultant VAR ingots are cylindrical shapes weighting up to 13,500 kg, which are
forged to slabs or billets, then formed to mill products. The alternative sponge melting process uses a cold
hearth furnace. Here, the crushed sponge and alloying elements can also be mixed with inexpensive
recycled titanium scrap before melting to reduce costs. The mixture is melted by either electron beams in
a vacuum or by plasma arc torches under a positive pressure of helium. The metal flows across the cold
hearth, where it forms a pool that allows impurities to sink to the bottom or to be evaporated. Cold hearth
melting removes both hard alpha (enriched interstitial compounds) and high density (such as tungsten)
inclusions and is the preferred method for producing clean titanium for aerospace applications. The
molten titanium is direct cast into a near-net shape, which can be slab intended for further processing, or a
remelt electrode for subsequent VAR. Combination of cold hearth + VAR melts can eliminate inclusions
and defects that even triple VAR melting cannot remove and therefore has become a common practice for
aerospace applications.
VAR ingots and cold-hearth melted cast slabs are pressed or rotary forged into slabs (rectangles) or billets
(rounds). Then hot forming produces forgings, plates, and extrusions. This can be followed by cold
rolling and common processing techniques to create mill products – basic structural shapes with desired
properties that maximize metal utilization. The majority of aircraft components require hot working to
overcome spring back, minimize residual stresses, and reduce forming forces needed. The workhorse of
the aerospace industry and a feedstock for additional mill products, forgings are available in a wide range
of sizes. New developments in precision forging now provide near-net shapes with improved material
efficiencies. Titanium billets can have round, square, rectangular, hexagonal, or octagonal cross-sectional
shapes. Hot rolling produces plate, which is generally available in thicknesses greater than 4.75 mm and
width greater than 500 mm. Vacuum creep flattening is widely used to achieve critical plate flatness.
Sheet is flat roll product that is typically less than 4.75 mm thick, and produced by either hot or cold
rolling. Strip is cut from cold-rolled and annealed sheet. Pipe and tube can be manufactured as either
welded or seamless product in a variety of standard diameters and wall thicknesses. Titanium is cost-
effectively extruded into desired near-net shapes by forcing heated metal through a die. Extrusions
maximize material usage and reduce the need for downstream milling, welding, and assembly. Other
common products of Ti include weld wire, fasteners, screws, nuts, bolts, washers, and rod. Casting is the
most advanced and diversified of the net shape technologies. It offers greater design freedom and
significantly reduces the need for expensive machining and fabrication to attain the desired shape.
Commercial casting of Ti began in the late 1960s and today the technology has matured to routinely
supply critical gas turbine engine and airframe products.
Thermo-mechanical processing is used for most fracture critical components, which require better process
control than working and heat treatment to achieve much tighter distributions around higher property
values. Heat treatment, e.g. annealing, reduces scatter in property values but at lower mean values. A

40
typical TMP sequence is shown in Figure 2.3.7. Critical variables during TMP are: deformation
temperature (above or below the beta transus), amount of plastic strain introduced, plastic strain rate,
deformation method (state of stress), cooling rate after deformation, and final heat treatment parameters.
Figure 2.3.7 Thermo-mechanical processing sequences and critical parameters of Ti alloys.
References
[1] R. Wood, Titanium and Its Alloys: ASM International Course, 1994.
[2] Titanium: A Technical Guide, Second Edition, M.J. Donachie, ASM International, Materials Park, OH, 2000.
[3] Titanium, 2nd Edition, G. Lutjering and J.C. Williams, Springer-Verlag, Berlin, 2007
[4] Materials Properties Handbook: Titanium Alloys, ASM International, Materials Park, OH, 1994
[5] Titanium and Titanium Alloys, C. Leyens and M. Peters Wiley, , 2003
[6] Physical Metallurgy of Titanium Alloys, E.W. Collings, ASM, 1984.
[7] Titanium: The Ultimate Choice, International Titanium Association, Broomfield, CO, 2005.

41
2.4 Steels
Biliyar N. Bhat, NASA Marshall Space Flight Center
2.4.1 Introduction
Steels are the most common metallic materials used in structural applications globally because of their
high strength and ductility and relatively low cost. One drawback is the high density of steels relative to
aluminum and titanium, which tends to increase the mass of the aerospace systems. On the up side many
alloy steels can be heat treated to very high strength levels (>200 ksi yield strength) such that the specific
strengths (strength/density) are high enough to be acceptable to designers. High fracture toughness is
another attribute that makes steels attractive in applications that require high damage tolerance. Maraging
steels combine strength and fracture toughness. Most steels become brittle at cryogenic temperatures and
are not recommended for cryogenic applications. Corrosion resistant stainless steels are the most
commonly used steels in aerospace applications, which typically require good corrosion resistance.
Nickel-chromium steels are oxidation resistant and are used in oxidizing environments. Table 2.4.1 lists
some of the common steels used in aerospace and their chemistries. These steels serve as examples only
and the list is by no means complete. Many more ferrous alloys and their chemistries and properties can
be found in the references listed at the end of the chapter. Two major references are Aerospace Structural
Metals Handbook and American Society for Metals (ASM International) Metals Handbook, 10
th
Edition.
Only a brief description of the classes of steels and their aerospace applications is given in this section.
2.4.1 Ultra High Strength Steels
These steels typically are capable of minimum yield strength of 1380 MPa (200 ksi). They are low alloy
steels that can be thermomechanically processed (TMP) to very high strength and toughness levels. For
instance, AISI/SAE 4340 steel can be heat treated (quenched and tempered) to strength levels of 150 to
280 ksi by controlling the tempering temperature. Higher tempering temperature gives lower strength but
higher ductility and fracture toughness. It is susceptible to hydrogen embrittlement and care must be taken
to bake out any hydrogen. This steel has extremely poor resistance to stress corrosion cracking (SCC)
especially at high strength levels (1500-1950 MPa, 220-280 ksi). It is usually forged at 1065 to 1230
0
C. It
has good welding characteristics and can be readily gas or arc welded. Because 4340 steel is air
hardening, welded parts should be annealed or normalized and then tempered soon after welding. 4340
steel is produced as forgings, light plate and castings. Typical applications include landing gear and other
critical structural members for aircraft.
Alloy 300M is basically silicon-modified (1.6% Si) 4340 steel. It has higher carbon and molybdenum
content and also contains vanadium. It has high ductility and toughness at tensile strengths of 1860 to
2070 MPa (270-300 ksi). It is also susceptible to hydrogen embrittlement when heat treated to strength
levels greater than 1380 MPa (200 ksi) and requires baking. Processing is similar to 4340 steel. D-6AC
steel is specially developed by Ladish Company for aircraft and missile structural applications. It is
primarily designed for use at room temperature strength levels of 1800-2000 MPa (260-290 ksi). D-6AC
is produced by air melting followed by vacuum arc remelting (VAR). It can be forged, rolled, welded and
heat treated similar to 4340 steel. The alloy is susceptible to stress corrosion cracking; fracture toughness
(K
Iscc
) value in both water and 3.5% NaCl solution appears to be low [less than 16 MPa √m, (15 ksi √in)]
at high strength levels.

42
Table 2.4.1 Common Aerospace Steels
Designation
Commercial
Names
Typical Composition
Typical Aerospace
Applications
Ultra high Strength Steels
4340
Fe- 0.35C-0.7Mn-0.3Si-0.8Cr-
1.8Ni-0.25Mo-
Landing gear, fasteners
300M
Fe-0.43C-0.8Mn-1.6Si-0.8Cr-
1.8Ni-0.4Mo-0.05V
Fasteners, landing gear, airframe
parts
D6-AC
Fe-0.45C-0.75Mn-0.25Si-1.1Cr-
0.6Ni-1.0Mo-0.08V
Motor cases for solid fuel rockets
High Fracture Toughness Steels
HP 9-4-30
Fe-0.30C-0.25Mn-0.2Si-1.0Cr-
7.5Ni-1.0Mo-0.1V-4.5Co
Aircraft structural components
AF1410
Fe-0.15C-0.1Mn-0.1Si-2.0Cr-
10Ni-1.0Mo-14Co
Aircraft structural components
Maraging Steels
18Ni (250)
Fe-18Ni-5Mo-8.5Co-0.4Ti-0.1Al
Aircraft structural parts, shafts,
missile cases
Corrosion Resistant Steels
Austenitic Stainless Steels
301,302
Fe-18Cr-8Ni
General purpose corrosion and
heat resistant steel
304, 304L
Fe-LowC-19Cr-10Ni
General purpose corrosion
resistant – better than 301
316, 317
Fe-18Cr-13Ni-Mo
Tubing in propulsion systems
321
Fe-18Cr-10Ni-Ti
Aircraft structural tubing
347, 348
Fe-18CR-10Ni-Nb
Aircraft structural tubing
21-6-9
Fe-LowC-20Cr-6.5Ni-9Mn-0.28N
Aircraft hydraulic line tubing
Martensitic Stainless Steels

43
403, 410,
416
Fe-LowC-12Cr
Engine parts
440A, B, C
and F
Fe-HighC-17Cr-0.5Mo
Cryogenic bearings
Precipitation Hardening Stainless Steels
17-4PH
Fe-17Cr-4Ni4Cu
Structural parts requiring
corrosion resistance
17-7PH
Fe-17Cr-7Ni-1Al
Structural parts requiring
corrosion resistance
15-5PH
Fe-15Cr-4.5Ni-0.3Cb-3.5Cu
Structural parts requiring
corrosion resistance
Custom 455
Fe-LowC-12Cr-8Ni-2Co-1Ti+Cb
Structural parts requiring
corrosion resistance
Nickel Chromium Steels
A-286
Fe-25Ni-15Cr-2Ti-1.5Mn-1.3Mo-
0.3V
Propulsion systems
JBK-75
Fe-30Ni-15Cr-2Ti-0.1Mn-1.3Mo-
0.3V-0.3Al
Propulsion systems
Incoloy
Fe-34Ni-20Cr
Hot sections of engines
2.4.2 High Fracture Toughness Steels
These steels are capable of a yield strength of 1380 MPa (200 ksi) and plain strain fracture toughness (K
Ic)
of 100 MPa √m (91 ksi √in). They are also resistant to stress corrosion cracking. Both HP-9-4-30 and AF
1410 alloys are Fe-Ni-Co type steels and have similar characteristics. Melt practice requires a minimum
of vacuum arc remelting (VAR). HP-9-4-30 usually electric arc melted and VAR. It is capable of
developing a tensile strength of 1520-1650 MPa (220-240 ksi) and a K
Ic
of 100 MPa √m (91 ksi√in). Heat
treated parts can be readily welded. Tungsten arc welding under inert gas shielding is the preferred
welding process. Post weld heat treatment is not required but stress relief at 540
0
C (1000
0
F) is
recommended for relieving residual stresses; it does not have an adverse effect on the strength or ductility
of base or weld metal.
AF1410 steel is an Air Force developed Fe-Ni-Co type alloy steel designed for replacing some titanium
parts. It has significant stress corrosion cracking resistance. By raising the cobalt and carbon content the
ultimate tensile strength was increased to a typical 1615 MPa (235 ksi), while maintaining a K
Ic
value of
154 √m (140 ksi √in). This combination of strength and toughness exceeds other commercial steels of

44
comparable strengths. Stress corrosion cracking resistance is very good [K
Iscc
of 66 MPa√m (60 ksi √in)].
The preferred melting practice is vacuum induction melting followed by vacuum arc remelting (VIM-
VAR). Welding is done under inert gas shielding to avoid oxygen contamination.
2.4.3: Maraging Steels
The term maraging is derived from martensite age hardening and denotes age hardening of a low carbon
iron-nickel lath martensite. Unlike conventional steels that are hardened by martensitic reaction that
involves carbon, maraging steels are strengthened by precipitation of intermetallic compounds at about
480
0
C (900
0
F). The yield strengths are in the range 1030 to 2420 MPa (150-350 ksi). These steels
typically have very high nickel, cobalt and molybdenum content. Carbon is considered an impurity and is
kept very low. 18Ni (250) is a common commercial grade maraging steel with yield strength of 250ksi
(Table 2.4.1). Compared to conventional steels maraging steels are more hardenable with only slight
dimensional changes. This feature allows intricate parts to be machined in the soft condition and then heat
treated with minimum distortion. Fracture toughness is considerably better than that of conventional high
strength steels and hence is attractive for applications where damage tolerance is important. Resistance to
corrosion and stress corrosion are also better than conventional high strength steels.
Premium grades of maraging steels used in critical aircraft and aerospace applications are generally triple
melted using air, vacuum induction, and vacuum arc remelting processes to minimize residual elements
(such as carbon, manganese, sulfur and phosphorous) and gas (O2, N2, H2). The ingots can be hot and
cold worked using conventional steel mill techniques. The steels are weldable and fabrication costs are
lower than conventional high strength steels.
2.4.4 Corrosion Resistant Steels
Corrosion resistant steels (aka stainless steels) are iron base alloys that contain at least 10.5% chromium,
which imparts corrosion resistance through formation of invisible and adherent chromium-rich oxide
surface film. Other elements are added to improve particular characteristics include nickel, molybdenum,
copper, titanium, aluminum, silicon, niobium, and nitrogen. Carbon is normally present in the amounts
ranging from less than 0.03% to over 1.0% in certain martensitic grades. Corrosion resistance and
mechanical properties are the most important in selecting these steels for aerospace applications. Other
considerations include fabrication characteristics, availability and cost. It is instructive to look at the iron-
chromium-nickel (Fe-Cr-Ni) phase diagram (Figure 2.4.1) to gain insight into the properties of stainless
steels. Chromium is body centered cubic (bcc) and tends to stabilize the ferrite phase. Nickel is face
center cubic (fcc) and tends to stabilize the austenite phase. A combination of nickel and chromium will
give us a variety of steels with tailored properties.
Figure 2.4.1 Phase diagram showing compositions of Fe-Cr-Ni alloys for which austenite persists at room
temperature. Note: Point P indicates the position of an alloy containing 18% Cr and 8% Ni.

45
The stainless steels are classified based on microstructure and properties. Martensitic stainless steels are
essentially alloys of chromium and carbon that possess a distorted bcc crystal structure (martensitic) in
the hardened condition. They are ferromagnetic, hardenable by heat treatment and their corrosion
resistance is relatively low. Chromium content is in the range 10.5% to 18%, and carbon content up to
1.2% or more. The chromium and carbon contents are balanced to ensure martensitic structure after
hardening. Excess carbides may be present to increase wear resistance. Austenitic stainless steels have an
fcc structure. This structure is attained through use of austenitizing elements such as nickel and
manganese. These steels are essentially non-magnetic in the annealed condition and can be hardened only
by cold working. They usually possess excellent cryogenic properties. Molybdenum, copper, silicon,
aluminum, titanium and niobium may be added to impart certain characteristics such as pitting corrosion
resistance or oxidation resistance. Precipitation hardening (PH) stainless steels are Fe-Cr-Ni alloys
containing precipitation hardening elements such as copper, aluminum or titanium. These steels may be
either austenitic or martensitic in the annealed condition. Those that are in austenitic in the annealed
condition are generally transformable to martensite through conditioning heat treatments, sometimes with
a subzero treatment. In most case these steels attain their strength by precipitation hardening of the
martensitic structure.
Corrosion resistance is generally the most important characteristic of a stainless steel, but often is also the
most difficult to assess for a specific application. General corrosion resistance to pure chemical solutions
in comparatively easy to determine but actual environments are usually more complex. General corrosion
is much less severe than localized forms of corrosion such as stress corrosion cracking (SCC), crevice
corrosion (in tight places or under deposits), pitting corrosion and inter granular attack in sensitized
material such as weld heat affected zones (HAZ). Such localized corrosion can cause unexpected and
sometimes catastrophic failure while most of the structure remains unaffected. Therefore care must be
exercised in selecting the right grade of stainless steel for a given environment.
2.4.5 Nickel Chromium Steels
These are iron-nickel-chromium alloys containing more than 25% Ni and more than 10% Cr, always more
Ni than Cr. These austenitic alloys are used for oxidizing as well as reducing atmosphere and are used in
high temperature parts of propulsion systems. For example, A-286 is a high toughness age-hardenable
stainless steel. Applications include aircraft turbine engine components such as discs, vanes and blades,
shafts, cases and combustors. SSME nozzle is made from A-286 tubes brazed together. The alloy has
good strength and toughness down to cryogenic temperatures. A modification of A-286, called JBK-75
was developed for improved weld cracking resistance. It has higher hot strength and resistance to
hydrogen embrittlement compared with A-286. Incoloy alloy possesses good oxidation and strength
properties at temperatures up to 1800⁰F.
References
There are numerous good references for steels. Examples: ASM Handbook 10
th
Edition, Vol. 1:
Properties and Selection: Irons and Steels and High-Performance Alloys, 1990; Aerospace Structural
Metals Handbook, Battelle Columbus Laboratories for Department of Defense, 1990 Publication;
Stainless Steels, by R.A. Lula, American Society for Metals, 1986. Steel properties data can be obtained
from the steel suppliers who usually provide the data on the steels they produce and sell. Aerospace
companies generally generate data bases for materials used in specific applications but these data bases
tend to be proprietary. NASA – MSFC maintains a data base on materials used by NASA and is stored in
a system called MAPTIS (Materials and Processes Technical Information System), which is accessible to
qualified users. MMPDS (Metallic Materials Properties Development and Standardization – formerly
MIL-Handbook 5, published by Battelle Memorial Institute) is also a commonly used source for metallic
materials properties.

46
2.5 Superalloys
Micheal V Nathal, NASA Glenn Research Center
The term “superalloys” has been applied to the alloys used in some of the harshest environments
experienced by materials and components. Superalloys are most often associated with aerospace
propulsion systems such as jet and rocket engines, but are also heavily used in power generation and
chemical industries. These applications require a balance of properties, most notably a combination of
high temperature strength, resistance to high temperature oxidation and corrosion attack, and significant
damage tolerance. Superalloys can be based on Ni, Fe-Ni, or Co as the primary ingredient. Early
superalloys were an outgrowth of stainless steels and were thus developed on a Fe-Ni-Cr base. Another
early alloy was Ni-20Cr, which relied on Cr to provide oxidation resistance. The strengthening effect of
adding Al and Ti to NiCr alloys was discovered in 1929 and new alloys based on this discovery began to
appear in the 1940’s. Continued alloy development over the past 70 years has resulted in over 100
different superalloys containing as many as 15 alloying elements.
Ni-base superalloys are used in the most demanding components of a jet engine, such as the turbine disks
and blades, which are exposed to both high stresses and temperatures in an oxidizing environment. When
a component’s stress/temperature requirements are not quite as severe, Fe-Ni base superalloys are
preferred over Ni-base alloys. These alloys tend to be less expensive, plus they are more amenable to a
wide variety in processing techniques, including welding. The Fe-Ni base alloy IN-718 is the most
widely used superalloy in the world, as a result of its excellent mechanical properties up to about 600
o
C,
combined with ease of manufacture. The use of Co base alloys is restricted by the higher cost of Co
compared to Ni, but their unique combination of properties is nevertheless suitable for a substantial
portion of aerospace applications.
2.5.1 Superalloy Metallurgy
Ni-base superalloys consist of a face-centered cubic (FCC) matrix known as gamma (γ) and a closely
related FCC precipitate based on Ni
3
Al, known as gamma prime (γ’). Figure 2.5.1 shows typical
superalloy microstructure. The long range -ordered crystal structure of γ’ is the source for the excellent
strength and creep resistance of superalloys. In addition, small amounts of carbides and borides are
usually present. The γ phase has key attributes of substantial ductility, plus a capacity to accept numerous
ternary elements in solid solution, thus allowing a large alloy design space. The γ phase of most alloys
contains substantial amounts of Cr in solid solution, which provides some degree of strengthening but is
primarily present for environmental resistance. Cr imparts oxidation resistance by promoting the
formation of a slow growing, adherent Cr
2
O
3
oxide scale that protects the bulk alloy from oxidation
attack. However, the degree of protection provided by Cr
2
O
3
is limited to temperatures of about 1000
o
C,
and the most oxidation resistant alloys form Al
2
O
3
instead. High Cr levels are still the best remedy for
resistance to many hot corrosion attack mechanisms. Over the decades, superalloy compositions have
become more complex, as refractory metal additions were added for improved strength. Mo, W, and Re
are elements that partition primarily to γ and provide solid solution strengthening. The γ’ phase can be
similarly strengthened by ternary additions, and Ti, Nb and Ta are added for this purpose. Alloys are
designed such that the lattice parameters of the FCC crystal structures of γ and γ’ tend to be closely
matched, and the lattice parameter mismatch rarely exceeds ±0.5%. Alloying additions are limited to

47
amounts that can remain in solid solution in the γ and γ’. Exceeding the solubility limits results in the
formation of deleterious Topologically Close Packed (TCP) phases such as σ, μ, α, Laves and δ.
Additional constraints on alloying include cost, density, and the need to balance competing properties.
For example, W is a very potent strengthener of both γ and γ’, but excessive W levels can result in the
formation of α or μ phase. Cr levels can be reduced to allow for higher W additions, but Cr can only be
reduced so far before environmental resistance is compromised. Alloy design is not stymied, however, as
alternative means to achieve the balance of properties can be invoked. For example, in the pursuit of
higher strength, oxidation resistance of an alloy can be sacrificed to some extent by relying on protective
coatings.
Figure 2.5.1 Typical microstructures of Ni-base superalloys. (a) Low magnification scanning electron
micrograph of grain boundary carbides in a cast alloy. (b) Transmission electron micrograph of gamma
prime (γ’) precipitates. Two different populations of precipitates are present, each population formed
at a distinct ageing temperature.
The role of minor alloying additions is also critical for optimum properties. Almost all alloys contain
small amounts of C (< 0.1%) that result in the formation of carbides. The carbides can be of several
types, such as MC, M
23
C
6
, and M
6
C, (where M denotes a combination of metal species) and can
strengthen grain boundaries. M = Hf, Ti, Ta and/or Nb in MC, M = Cr in M
23
C
6
, and M = Mo or W in
M
6
C carbides. Zr and B at trace levels (< 0.1%) are also considered grain boundary strengtheners,
although the mechanisms behind their beneficial effect are still unclear. M
3
B
2
borides, with M = Mo, are
usually present in small quantities. Other trace elements, including O, N, S, and Pb, are closely
controlled to not exceed parts-per-million levels in order to minimize property degradation.
Both Fe-Ni and Co base alloys are similar to Ni base alloys in having FCC matrices. Fe-Ni base alloys
can be simple solid solutions or can be precipitation strengthened. Both γ’ and γ” (Ni
3
Ti,Nb) precipitates
are found in IN-718. Co base superalloys also rely on solid solution strengthening, but also contain
higher amounts of carbides for both strengthening and grain size control.
2.5.2. Processing
Alloy design is inextricably linked with processing development as well as the intended application. The
strongest, most creep resistant alloys are too strong to be amenable to wrought processing, such as
extrusion, forging or rolling, even near their melting temperatures. Furthermore, these alloys usually
cannot be welded by most commercial welding techniques. Thus, they must be processed by casting to
near-net- shape. Other alloys exist that are specifically designed for wrought processing, for application
as a sheet product, for weldability, etc.

48
Aerospace grade superalloys are processed with a strong emphasis on tight compositional control, high
purity, and low inclusion contents. Vacuum melting is ubiquitous across the industry. Many
components, especially those with large size and modest high temperature strength requirements, are
made by cast and wrought processing. Combinations of vacuum induction melting (VIM) and vacuum
arc remelting (VAR) produce refined ingots ranging up to several tons in size. These ingots are then
broken down into bar, sheet and tube product by forging, extrusion, and other hot working methods.
Cast and wrought alloys are limited to those alloys with enough ductility to allow substantial deformation
without cracking. The degree of alloying is also limited by dendritic segregation, which can be severe
enough in large ingots to induce cracking and substantially limit the deformability. Powder metallurgy
(PM) processing can extend the limits of wrought processing by producing a homogeneous, fine grained
billet with improved workability compared to ingot metallurgy, thus allowing more heavily alloyed
material to be processed. Isothermal forging is another technique used to extend the degree of
workability of high strength alloys. In this method, quenching of the billet by the forging dies is
minimized by supplemental heat used to heat both the billet and the die.
Alloys used for turbine airfoils are usually too strong to be hot worked. In addition, many advanced
turbine blades have intricate geometries, including internal cooling passages that are best achieved by
near-net-shape casting methods. Investment casting, sometimes known as the “lost-wax method,” has
been developed to produce extremely complex geometries with excellent dimensional tolerance, smooth
surface finish, and low defect rates. In this method, the component to be cast is first produced in wax.
The wax parts are then dipped in ceramic slurries to produce a shell mold, which is then heated to melt
out the wax and sinter the ceramic shell. The alloy to be cast, in the form of pre-alloyed VIM ingot, is
melted in a ceramic crucible and poured into the shell mold under vacuum. If the part has internal cooling
passages, ceramic cores are set into the wax preform and remain in the shell mold after the wax is
removed. The cores are then removed by chemical leaching from the solid castings. The above process
is known as “conventional casting” and produces large, equiaxed grained microstructures with grain sizes
on the order of 1-3 mm. Specialized, proprietary methods have been developed to refine the grain size of
these castings. The most highly stressed turbine blades are produced by directional solidification. In
this method, the molds and melt stock are prepared similarly to conventional casting. However, the mold
is heated to maintain the alloy as a liquid, and after pouring, the mold is steadily withdrawn from the hot
zone at a rate of approximately 20 cm/hour. This produces directionally solidified (DS) turbine blades
with elongated grains that extend the entire casting length. The lack of transverse grain boundaries in this
structure provides a substantial creep strength benefit at the high temperatures seen in turbine airfoils. A
further advance of this technique was introduced in the 1980’s, where various geometric constraints
and/or single crystal seeds were inserted in the mold to restrict multiple grains from forming, thereby
producing single crystal (SX) superalloys. SX alloys offer the best high temperature creep resistance,
although their relatively high cost restricts them to components with the highest stress/temperature
combinations.
Superalloys are almost always heat treated prior to use. Cast alloys are usually solution treated above the
γ’ solvus, which both dissolves the coarse γ’ plus homogenizes the dendritic segregation present in as-cast
microstructures. Rapid cooling from the solution temperature is usually prescribed in order to maintain a
fine precipitate size. One or more intermediate temperature aging steps are also typical, for the purposes
of optimizing γ’ size, stabilizing carbides and relieving residual stresses. Wrought alloys can be
processed similarly, although the high temperature solution treatment may be designed to be slightly
below the γ’ solvus. In this case the small amount of remaining γ’ serves to limit grain size.
Applying protective coatings to superalloys is also a mature technology. Turbine airfoils and combustor
parts are usually coated with an oxidation and corrosion resistant coating. Coatings can be applied by
aluminizing, where a part is subjected to an Al vapor, which enriches the surface with enough Al to form
a 25 -100 micron thick layer of NiAl. A thin Pt layer can be applied before aluminizing, which adds Pt in

49
solid solution in the NiAl coating. Alternate methods such as plasma spraying can deposit overlay
coatings with compositions such as NiCoCrAlY. These coatings offer better resistance to hot corrosion
compared to NiAl. Finally, thermal barrier coatings (TBC) are applied on internally cooled blades and
combustors. Yttria-stabilized zirconia is the predominant TBC and is applied via either plasma spray or
electron beam physical vapor deposition.
2.5.3. Properties and applications in aerospace
The two prime factors determining the mechanical properties of a superalloy are its composition and grain
size. Composition determines the degree of solid solution and precipitation hardening. Many factors
influence the optimization of precipitation hardening, but the most significant include γ’ volume fraction,
γ’ particle size, γ- γ’ lattice parameter mismatch. Grain size is also of prime importance. Fine grains are
preferred for their high strength and fatigue resistance up to about 700
o
C. At higher temperatures, creep
becomes dominant and coarse grains, elongated grains, and singles crystals provide good, better, and best
creep resistance, respectively. Table 2.5.1 lists common superalloys used in aerospace and their
compositions.
Table 2.5.1 Compositions (in Wt %) of Typical Superalloy
Alloy Ni Fe Cr Co Al Ti Nb Mo W Ta Re Hf C B Zr Mn Si
Ni-Fe base
cast & wrought
alloy
IN-718 Bal 18.5 18.5 - 0.5 0.9 5.1 3.0 - - - - 0.040 - -
0.2 0.2
Ni-base cast &
wrought alloy
Waspalloy Bal 2.0 19.5 13.5 1.4 3.0 - 4.3 - - - - 0.070 0.006 0.070 - -
Ni-base cast &
wrought alloy
Udimet 720 Bal - 18.0 14.7 2.5 5.0 - 3.0 1.3 - - - 0.030 0.033 0.030 - -
Ni-base powder
alloy
Rene 88DT Bal - 16.0 13.0 2.1 3.7 0.7 4.0 4.0 - - - 0.0 0.0 - - -
Ni-base cast
alloy
IN-738 Bal - 16.0 8.5 3.4 3.4 0.9 1.8 2.6 1.8 - 0.170 0.010 0.100 - -
Ni-base cast
alloy
Mar-M247 Bal - 8.5 10.0 5.5 1.5 - 0.7 10.0 3.0 - 1.4 0.160 0.015 0.040 - -
Ni-base single
crystal alloy
CMSX-4 Bal - 6.5 10.0 5.6 1.0 - 0.6 6.0 6.0 3.0 0.1 - - - - -
Co-base sheet
alloy
Haynes 188 22 3.0 22.0 Bal - - - 14.0 - - - - 0.100 - - - -
Ni-Fe-base
sheet alloy
Hastelloy-X Bal 18.5 22.0 1.5 - - - 9.0 0.6 - - - 0.100 - -
0.5 0.5
Ni-base sheet
alloy
Inconel 625 Bal 2.5 21.5 - 0.2 0.2 3.6 9.0 - - - - 0.050 - -
0.2 0.2
Turbine engines are the propulsion systems most closely associated with superalloys. In the front
sections of a turbine engine, the air temperature is initially low, and gradually rises as it is compressed.
The components in these sections tend to be Al or Ti alloys, and most recently, polymer matrix
composites, with the selection of Ti alloys becoming more common where higher strength and warm
temperatures are needed. When the temperatures exceed approximately 400
o
C, superalloys are selected.
The Fe-Ni base alloy IN-718 is used in numerous compressor disks and blades, usually in cast and
wrought form. The strength of IN-718 begins to drop as the temperature exceeds ~550
o
C, which occurs
in the last stages of the compressor, requiring a shift to stronger Ni base alloys, especially for blades. The
air is then mixed with fuel and burned in the combustor, which is a very high temperature but low stress
environment. In this case, oxidation resistance and processability are preferred attributes, and many
relatively weak alloys that can be processed into sheet are employed. The combustor is followed by the

50
high pressure turbine section, usually requiring the most advanced disk and blade alloys. For the disks,
the strongest cast and wrought alloys such as Udimet720 are most often selected, although advanced PM
alloys are displacing them in modern engines. DS and SX blade alloys are used routinely in modern
engines. Beyond the high pressure turbine, temperatures begin to decrease and a gradual transition to
lower temperature components is implemented in the low pressure turbine and exhaust nozzle.
Superalloys are also employed in many rocket engine components. The turbopumps used to raise the
pressure of the liquid oxygen and fuel are analogous to the turbines in a jet engine, and similar materials
are used for the turbopump blades, disks, and housings. IN-718 and SX superalloys are examples. If
hydrogen is the fuel, alloy strength may need to be sacrificed to ensure resistance to hydrogen
embrittlement.
Recommended Literature
The classic book The Superalloys II: High temperatures Materials for Aerospace and Industrial Power,
edited by C.T.Sims, N.S. Stolloff, and W.C. Hagel, 1987, provides good background material. A more
recent (2006) textbook is The Superalloys: Fundamentals and Applications by R.C. Reed. The
International Symposia on Superalloys is held every four years since 1968, and most recently 2012. The
proceedings from these valuable conferences are published by The Minerals, Metals & Materials Society,
Warrendale, PA.

51
2.6 Aerospace Applications of Copper Alloys
David L. Ellis, NASA Glenn Research Center
2.6.1 Introduction
Copper-based alloys have unique electrical, thermal and wear characteristics that make them well suited
for certain aerospace applications. Copper-based alloys used for aircraft applications include Beryllium
Copper (C17000, C17100, C17200), Nickel Aluminum Bronzes (C63000, C63020, C95510), Silicon
(C65100, C65500) and Silicon Aluminum (C64200) Bronzes, Manganese Bronzes (C67300, C86300),
High Lead Tin Bronze (C93700), and Aluminum Bronze (C95400)
1
. Several standards are applicable to
Cu-based alloys in the aerospace industry including BS B 23, AMS 4640, AMS 4880, AMS 4881 and
UA11N[1].
Copper alloys are used in regeneratively cooled rocket engines where pure copper, low alloy coppers (Cu-
Cr, Cu-Zr, GlidCop AL-15, etc.), and specially developed Cu-based alloys (NARloy-Z, GRCop-84) are
used. All of the alloys are notable for high thermal conductivity and good elevated temperature
mechanical properties.
Another important application of Cu and Cu-based alloys is electronics and electrical systems. Electrical
wiring, electrical motors, electrical actuators, etc., normally utilize Cu wire. Cu-based materials are
frequently utilized for cold plates and thermal back planes of standard electronic modules (SEMs) and
thermal control of electronics such as heat sinks for electronics chips.
2.6.2 Aircraft Applications
Cu-based alloys offer two primary advantages for aircraft structural applications. They are exceptionally
resistant to wear and galling, and they are very strong with high specific properties. Some are also non-
sparking and can offer an advantage over other alloys such as steel if sparks are a concern, e.g., near fuel
where the potential for a fire or explosion exists. This leads to their application in wear surfaces, bearing
applications and even as structural members.
Table 2.6.1, taken from Glaeser [2], shows four of the more common types of bearing alloys used for
aircraft applications and lists their hardness, strength and wear factor, a measure of their wear resistance.
The Tin Bronzes exemplified by C90500 (Cu-10 Sn-2 Zn) receive their strength from the hard δ phase
that also aids in wear resistance. The leaded versions of these alloys, here typified by C93200 (Cu-7 Pb-7
Sn-3 Zn), add lead to provide self-lubrication. The lead also improves ductility and lowers strength,
which helps to distribute loads better in a bearing application. Aluminum Bronzes such as C95400 (Cu-4
Fe-11 Al) are solid solution strengthened and are much stronger than the Tin Bronzes. They are also
usable at elevated temperatures (up to 260 °C). Beryllium Coppers are precipitation strengthened by the β
Be phase and have strengths that rivals that of steels combined with an upper operating temperature
around 315 °C. Alloy 25 (C17200, Cu-1.9 Be-0.3 Co) and Alloy 20 (C82500, Cu-2.2 Be-0.6 Co) are the
two most common Beryllium Copper alloys used in aerospace applications.
In addition to the four bearing alloys highlighted in Table 2.6.1, many other Cu-based alloys find use in
aircraft. Some of these are listed in Table 2.6.2 along with typical properties and typical applications.
Additional information on Cu-based alloys’ properties and applications can be found in References 2 and
3.

52
Table 2.6.1 Typical Properties of Four Bearing Alloys [2]
Material
Hardness,
BHN
Approximate Yield
Strength,
MPa
Wear Factor
*
,
mm³/m x 10
-12
Bearing Pressure
Range
**
,
MPa
Leaded tin bronze
(C93200)
65 120
6.4
33.3
0-14
14-40
Tin bronze,
(C90500)
75 150
2.7
13.4
0-14
14-40
Aluminum bronze
(C95400)
170 370
1.3
6.7
0-100
100-200
Beryllium copper,
(C82500)
380 790 1.1 0-550
*
Wear Factor based upon volume of wear of a cylindrical plain bearing, grease lubricated, operating at
slow speed over a given number of cycles
**
Bearing pressure is defined as the radial load divided by the length x diameter product
Table 2.6.2 Typical Room Temperature Properties and Applications of Selected Cu-Based Alloys Used In
Aircraft [3, 4]
Material Alloy
Condition/
Temper
Density,
g/cm³
Thermal
Conductivity,
W/m-K
BHN
Elastic
Modulus,
GPa
Modulus of
Rigidity,
GPa
Yield Strength,
MPa
Ultimate
Tensile
Strength,
MPa
Elongation,
%
Aerospace Applications
1
Aluminum Bronze C95400 M01 7.45 58.7 170 107.0 - 241 586 18 Bearings, Wear Plates
Berylium Copper C17000 TH04 8.41 107.3 - 128.0 50.3 1000 1310 2
C17200 TH04 8.25 107.3 - 128.0 50.3 1000 1344 4
High Lead Tin Bronzes C93700 M01 8.86 46.9 60 75.8 - 110 124 20 High speed and heavy load appliations
Manganese Bronze C67300 H50 8.30 95.0 - 117.2 - 276 448 11
C86300 M01 7.83 35.5 225 97.9 - 427 821 18
Nickel Aluminum Bronze C63000 HR50 7.58 39.1 - 121.0 44.1 517 814 15
C63200 O50 7.64 34.6 - 117.0 44.1 365 724 22
Silicon Aluminum Bronze C64200 H04 7.70 45.0 - 110.0 41.4 469 703 22
Silicon Bronze C65100 H04 8.75 57.1 - 117.0 44.1 379 483 15 bearings, ball bearing cage assemblies
C65500 H04 8.53 36.3 - 103.4 38.6 379 634 22
Bearings, journals, wear surfaces
High load gear and bearing applications
Aircraft landing gear bushings,
bearings, and other military and aircraft
Valve stems,gears, marine and pole line
hardware, wing pylons, bolts,nuts,
Landing gear bushings, wear surfaces, bearings and even the entire landing gear structure can be made
from Beryllium Copper [5], Nickel Aluminum Bronze [1], and Manganese Bronze [1]. In these
applications, the high strength of the alloys provides the load bearing capability while the low friction and
high wear resistance prevent galling and wear damage to the parts through repeated landings. Bearings
and bearing cages made from Silicon Bronze, Manganese Bronze, and Aluminum Bronze are frequently
used in aircraft due to their wear resistance and good strength [1]. Silicon Bronzes provide self-
lubrication from the Si while sintered bronzes are particularly good for use with oil and other liquid
lubricants [1].
One interesting application for future hypersonic aircraft may be actively cooled structures such as
leading edges. The National Aerospace Plane (NASP) examined such structures. Copper alloys such as
those used in regeneratively cooled rocket engines and Cu-based composites were considered likely
candidates for the actively cooled structures [6]. NASP also chose NARloy-Z (Cu-3 Ag-0.5 Zr) for the
combustor section heat exchangers [7].

53
2.6.3 Spacecraft Applications
Copper and Cu-based alloys appear in several locations in regeneratively cooled rocket engines. Most
notably, they are used for the liners of the main combustion chamber. In the case of the Space Shuttle
Main Engine (SSME), NARloy-Z was used to provide structural containment of the 20 MPa chamber
pressure and approximately 3000 °C flame [8]. This was achieved through extensive active cooling of the
liner, which relies upon the high thermal conductivity of NARloy-Z and the good elevated temperature
strength of the alloy. Other high copper alloys such as the ones listed in Table 2.6.3 have potential for
rocket engine liner applications. Additional information on several alloys is available in Reference 4.
Table 3.6.3 – Typical Room Temperature Properties of Current and Potential Rocket Engine Liner Alloys
[10, 11]
Material Alloy Condition
Composition,
Wt. %
Coefficeint of
Thermal
Expansion,
1/K x 10
6
Thermal
Conductivity,
W/m-K
Compressive
Yield Strength,
MPa
Tensile Yield
Strength,
MPa
Ultimate
Tensile
Strength,
MPa
Elongation,
%
GRCop-84 - Annealed Cu-6.7 Cr-5.9 Nb
15.3
11
285.4
11
311.8 196.2 368.0 21.7
GlidCop AL-15 C15715 Hard Drawn
Cu-0.3 Al
2
O
3
16.6
3
365.2
3
432.9 464.5 464.5 20.5
Zirconium Copper C15000
Hard Drawn
+ Aged
Cu-0.15 Zr
16.9
3
366.9
3
464.0 501.9 510.9 19.5
Chromium Copper C18200
Hard Drawn
+ Aged
Cu-0.9 Cr
17.6
3
323.6
3
450.0 441.8 495.2 18.3
Copper Chromium Zirconium C18150
Hard Drawn
+ Aged
Cu-1 Cr-0.1 Zr
16.5
3
323.9
3
501.4 549.9 564.4 11.2
NARloy-Z
9
-
Solutioned +
Aged
Cu-3 Ag-0.5 Zr 17.2 295.0 - 192.0 314.0 31.0
For hydrogen-fueled spacecraft, hydrogen embrittlement is a concern. Copper is often used as a hydrogen
barrier to prevent degradation of Ni-based and other alloys susceptible to embrittlement [8]. The SSME
also uses copper for the pre-burner baffles and partial coating of the main fuel valve housing [8].
2.6.4 Electronics and Electrical Applications
Both airplanes and spacecraft use electronics extensively. Weight and space constraints demand very
compact packaging. This results in very high power densities and large amounts of heat generated in a
confined space. One common method of removing the heat found on the military’s Standard Electronics
Modules is to mount the electronics on a cold plate that takes the heat to a thermal backplane for removal
from the system [12]. Cu-Invar composite plates with the thermal expansion coefficient matched to the
electronics packaging can be used for the cold plate. Other potential materials include Cu metal matrix
composites utilizing high conductivity graphite fibers, diamond or carbon nanotubes. These same
materials can be used for heat sinks if a cold plate and thermal backplane system is not used.
Another area where Beryllium Copper has found use is instrumentation cages [5]. Beryllium Copper
provides a non-magnetic, high-strength cage to hold electronics and instruments. The machinability and
formability of beryllium Copper also allows the creation of conformal cages to match the fuselage and
other contours as needed.
New ground is being broken with high thermal conductivity Cu-based composites with additions of
diamond, graphene and other high conductivity phases. Some of these materials are commercially
available with diamond reinforced copper heat spreaders achieving 800 W/m-K, twice the conductivity of
pure copper [13]. With the increasing availability of carbon nanotubes and grapheme sheets, higher
thermal conductivity copper-based materials are likely to be achieved.

54
References
1. “Copper-based aerospace alloys,” Aviation Database.com, http://www.aviation-
database.com/Technical_Aviation_Articles/copper-based-aerospace-alloys.html, retrieved April
5, 2012.
2. W.A. Glaeser, “Wear Properties of Heavy Loaded Copper-Based Bearing Alloys,” JOM, Vol. 35,
No. 10 (Oct. 1983) pp. 50-55.
3. “Properties of Wrought and Cast Copper Alloys,” Copper Development Association, (Jan. 20,
2012),
http://www.copper.org/resources/properties/db/CDAPropertiesSelectionServlet.jsp?mode=basic,
retrieved April 5, 2012.
4. P. Robinson, Properties of Wrought Coppers and Copper Alloys, Properties and Selection:
Nonferrous Alloys and Special-Purpose Materials, Vol 2, ASM Handbook, ASM International,
1990, p 265–345
5. “Advanced Alloys: Alloy Selection for the Aerospace Industry,” IBC Advacned Alloys,
http://www.ibcadvancedalloys.com/clientuploads/Technical%20Resources/AerospaceWhitepaper
.pdf, retrieved April 5, 2012.
6. D.M. McGowan, C.J. Camarda, and S.J. Scotti, “A Simplified Method for Thermal Analysis of a
Cowl Leading Edge Subject to Intense Local Shock-Wave-Interference Heating,” NASA TP-
3167, NASA Langley Research Center, Hampton, VA (March 1992).
7. D.B. Paul, “Extreme Environmental Structures,” Structures Technologies For Future Aerospace
Systems, A.K. Noor, Ed., Progress in Astronautics and Aeronautics, Vol. 188, AIAA, (2000)
8. “NASA Relies on Copper for Shuttle Engine,” Copper Topics, Copper Development Association,
Ed. 73, (Spring 1992),
http://www.copper.org/publications/newsletters/cutopics/Ct73/shuttle_engine.html, retrieved
April 5, 2012.
9. J.J. Espisito and R.F. Zabora, “Thrust Chamber Life Prediction: Vol. 1, mechanical and Physical
Properties of High Performance Rocket Nozzle Materials,” NASA CR-114806, NASA Lewis
Research Center, Cleveland, OH, (March 1975), pp. 12-18.
10. H.C. deGroh, D.L. Ellis, and W.S. Loewenthal, “Comparison of GRCop-84 to other Cu Alloys
with High Thermal Conductivities,” J. of Matl. Eng. and Perf., ASM International, Vol. 17, No. 4,
(Aug 2008) pp. 594-606.
11. D.L. Ellis and D.K. Keller, “Thermophysical Properties of GRCop-84,” NASA CR-210055.
NASA Glenn Research Center, Cleveland, OH, (June 2000).
12. L.H. Ng and F.R. Field, “A Quantitative Technique to Analyze Materials Trade-Off for SEM
“E”,” IEEE Trans on Components, Hybrids and Manufacturing Tech., Vol. 15, No. 1, (Feb 1992)
pp. 78-86.
13. J.C. Sung, M-C Kan, S-C Hu, M. Sung, B.G. Monteith, “Diamond Composite Heat Spreader,”
Advanced Diamond Solutions,
http://www.advanceddiamond.com/whitepapers/DiamondCompositeHeatSpreader.pdf, retrieved
April 5, 2012.

55
2.7 Damage Tolerance Considerations for Metallic Materials
Preston B. McGill, NASA Marshall Space Flight Center
2.7.1 Introduction
As the name implies, damage tolerance addresses the sensitivity of a material’s structural or load-carrying
capability in the presence of damage or defects. Damage tolerance considerations are applied to
components that serve as primary structural members and may include beams, columns, struts,
pressurized structure, pressure vessels, pressurized components, fasteners, fittings, clevises, attach
hardware, basically any structural component whose failure due to a defect would result in a catastrophic
event. In metallic materials, damage or defects are may be described in terms of cracks, crack-like flaws,
or discontinuities in the material. Defects in metallic materials may result from anomalies in the original
ingots or billets as well as from discrepant processing of wrought products, castings, or forgings related to
thermal processing such as solution heat treatment and quenching, or mechanical working such as
forging, rolling, or stretching. Though defects do occur in raw materials, more probable are fabrication-
related defects from forming and machining operations or joining processes such as welding and brazing
metallic materials. Materials initially free of defects may have defects develop in service due to cyclic
load conditions, corrosion processes, or inadvertent damage. Damage tolerance behavior of a material is
typically incorporated into the design, development, and manufacture of a component as part of an overall
flight safety approach, sometimes referred to as fracture control, to mitigate risk of failure. As such,
understanding the damage tolerance capability of materials is one element of an overall fracture control
program for safety critical hardware. In addition to damage tolerance of the material, fracture control
generally encompasses system-wide disciplines in design, analysis, nondestructive evaluation, quality
control, process control and material selection. This section highlights considerations for metallic
material selection with respect to damage tolerant behavior. Detailed information regarding damage
tolerance design considerations in terms of fracture control requirements, implementation, guidelines, and
fitness for service may be found in NASA-STD-5019A (1), NASA-HDBK-5010 (2), JSSG-2006 (30),
and the American Petroleum Institute 579-1/American Society of Mechanical Engineers FFS-1, Fitness
for Service (3).
2.7.2 Damage Tolerance Behavior of Metallic Materials
Numerous texts and journal articles have been written to describe methods for analyzing, testing, and
characterizing metallic material response in the presence of a crack or crack-like defect, i.e., the discipline
of fracture mechanics, which provides the framework for understanding the fracture behavior of metallic
materials (4, 5, 6, 7). Four areas related to the fracture, or damage tolerance, behavior of metallic
materials are summarized in this section: fracture toughness, stable crack extension, cyclic crack growth,
and transferability.
Fracture Toughness
The primary parameter used to describe the fracture behavior of a metallic material is its fracture
toughness. In its simplest form the fracture toughness of a material is a measure of the ability of the
material to resist failure in the presence of a crack. Physically, it is a measure of the amount of energy
required to extend a crack in the material. In linear elastic fracture mechanics, the fracture toughness is

56
most commonly designated as K
Ic
, but may also be denoted as K
c
, K
Ie
, K
Jq
, or K
JIc
depending on the test
methodology. In elastic-plastic (non-linear) fracture mechanics, the fracture toughness is most commonly
designated as J
q
, or J
Ic
. Note that all of these designations represent a single, scalar parameter
characterization of the fracture toughness of the material; note also that the subscripts reflect various
assumptions regarding sample geometry, flaw geometry, stress state and loading configuration. There are
standard test methods published by the International Standards Organization (ISO) and, more commonly
used in the United States, ASTM International, that provide methods for measuring the fracture toughness
of metallic materials (8, 9, 10, 11, 31). Zhu and Joyce (12) provide a comprehensive summary and
technical review of various fracture toughness test methods. Note that fracture toughness values may
vary, even within a given alloy, due to heat treat condition, product form, grain orientation, location
within the cross section, service environment, and geometric constraint conditions. Journal articles,
reference handbooks (13, 14, 15, 16), textbooks (17), and material specifications may be consulted for
fracture toughness values for specific alloys. Although fracture toughness is of primary importance when
evaluating a material for damage tolerant applications, there are some additional considerations in
connection with fracture toughness that should be included in the selection process.
Conceptually, additional insight into metallic material selection with respect to fracture toughness may be
gleaned from consideration of the ideal case of a through crack in an infinite plate under a remote,
uniform, uniaxial stress. A sketch of this configuration is shown in Figure 2.7.1.
Figure 2.7.1 Through-Crack in an Infinite Plate

57
For the crack opening mode, in the direction of the applied stress, the linear elastic stress intensity, K, at
the tip of the through crack is given by:
K = σ
πc Eq. 2.7.1
where σ is the remote uniform stress, and c is one-half of the through-crack length. The limiting value for
the stress intensity is the critical stress intensity value, or fracture toughness, of the material K
Ic
. If the
material is stressed at or near the yield stress, σ
y
, based on linear elastic fracture mechanics a limiting
estimate for the critical flaw length may be calculated as:
=
π
Eq. 2.7.2
Note the critical flaw length varies with the square of the ratio of K
Ic
to σ
y
. Low values of this ratio can
result in small critical flaw sizes which may be difficult to reliably detect. This simplified assessment
leads to a general conclusion that the toughness to yield strength ratio should be considered when
evaluating the damage tolerance capability of a material – with preference given to materials with higher
ratios.
Stable Crack Extension
Another important material characteristic is the ability of the material to tear, or undergo crack extension,
in a stable manner. Common metallic materials fracture toughness test methods, such as ASTM E399 (8)
and ASTM E1820 (11) measure fracture toughness by loading a test specimen with an induced crack, and
by measuring the load and displacement during the test, determine the point of initiation of crack
extension—the fracture toughness. The behavior of the material following the initiation of crack
extension is important to the realized damage tolerance of structures. The crack may continue to extend in
a stable fashion, requiring further increases in load to extend the crack, or the crack may fail the material
instantaneously with unstable crack extension. In these displacement controlled tests, the ability of the
material to sustain crack extension (tearing) in a stable manner may be inferred from the load versus
displacement plot. Two different behaviors for the same alloy processed to two different yield strength
levels are illustrated in Figures 2.7.2 and 2.7.3. The behavior of the material is shown notionally in the
cartoons depicting the compact tension sample. In Figure 2.7.2, the higher yield strength material fails in
an unstable manner (fast fracture) at or near the initial crack extension. In Figure 2.7.3, the crack grows
in a stable manner after the initial crack extension. In this case, the load increases as the crack extends
prior to unstable fracture.

58
Figure 2.7.2 Unstable Fracture Figure 2.7.3 Stable Crack Growth prior to Fracture
Material exhibiting unstable fracture behavior may be adequate for the design, i.e., the toughness may be
such that the critical initial flaw can be reliably detected. However, material exhibiting a stable tearing
failure mode will offer greater capability for load redistribution and is the preferred failure mode. It is
important to note that factors such as environment and heat treatment can result in a change in failure
mode for a given alloy. For example, a transition from ambient temperature to cryogenic temperature in
titanium alloys can result in an accompanying transition from a stable mode at failure to an unstable
mode. Similarly, changing temper conditions of a precipitation hardened steel, say from H1100 to H900,
can result in a change in failure mode from stable to unstable.
Crack Growth Rate
Crack growth rate is a measure of crack extension under cyclic loads. This is expressed in terms of crack
extension/cycle (da/dN) as a function of the stress intensity range (ΔK). Crack growth rates vary as a
function of cyclic stress intensity ratio, (K
min
/K
max
). Journal articles, reference handbooks (13, 14, 15,
16), textbooks (17), and commercial safe life analysis tools (18, 19) may be consulted for crack growth
rate curves for specific alloys and environments. Crack growth rates for some aluminum alloys are given
in Section 2.2. Standardized test procedures for measuring da/dN are provided in ASTM E647 (20). As
with fracture toughness, crack growth rates will vary with alloy, heat treat condition, product form,
orientation, service environment and constraint conditions. Consequently, da/dN- ΔK curves appropriate
to the application must be implemented.
Transferability
The fracture toughness in terms of the critical stress intensity value is a function of the constraint
conditions at the crack tip. Constraint conditions are a function of stress state in the vicinity of the crack
and vary with test sample geometry. Transferability addresses the extent to which the test results can be
used to predict behavior of the structure; in this regard it is important that the constraint conditions in the
test sample match or conservatively bound the conditions in the structure. Highly constrained material is
not free to plastically deform or flow and the material may reach very high, localized stresses that
promote failure. Less constrained material is free to plastically deform or flow (in ductile materials)
which may result in crack tip blunting or the development of plastic zones well ahead of the crack tip and
may reflect toughness values that are high with respect to the structural application. There are a variety of
test sample configurations used to evaluate fracture toughness. Three common test sample geometries

59
used in generating fracture data are compact tension samples, surface crack tension samples and middle
tension samples and are shown Figure 2.7.4.
a. b. c.
Figure 2.7.4 Fracture toughness test sample configurations: a. Compact Tension, b. Surface Crack
Tension, c. Middle Tension
Compact tension samples provide high constraint conditions. Test samples with larger ligaments,
thicknesses, side grooves or a combination of these characteristics tend to provide high constraint and
trend toward lower bound toughness properties. Conversely, middle tension samples, i.e., samples with
through cracks, tend to have low constraint at the crack tip and may result in critical stress intensity
measures that are higher than what can be developed in the structure. Surface crack tension samples,
samples with partially through flaws that are semi-circular or semi-elliptical in shape have constraint
conditions that vary around the crack length. Critical stress intensity values based on these tests may vary
with crack geometry and material thickness. When reviewing fracture toughness and crack growth rate
data, the test sample configuration and the crack geometry should be considered when evaluating the data
for applicability to the structure. Test data with similar or conservative (higher) constraint conditions
should be used to assess the damage tolerant behavior of the structure. Wallin (4), Kannenin and Popelar
(21), and Barsom and Rolfe (32) provide general considerations for evaluating transferability of test
results and structural applications. Gia and Shih (22) provide a detailed discussion on constraint effects in
ductile materials. General guidelines on factors that may affect fracture properties in metallic materials
are provided below.
2.7.3 Factors that Affect Damage Tolerance Properties of Metallic Materials
Service Conditions
Material compatibility with service conditions is an important consideration when selecting any material.
Along with other mechanical properties, the fracture behavior of a material may also be affected by its

60
service environment. Temperature and exposure to gas, liquid or solid media may adversely affect the
damage tolerant capability of the material. With respect to temperature for example, some high strength
steel alloys and titanium alloys exhibit large cryogenic yield strength enhancements which make the
alloys attractive for cryogenic applications from a strength design perspective. However, many of these
same alloys also exhibit diminished fracture toughness characteristics at cryogenic temperatures. Based
on the linear elastic fracture behavior discussed earlier, the combination of strength and fracture
toughness changes at cryogenic service temperatures can result in critical flaw sizes below flaw sizes that
cannot be reliably detected by non-destructive evaluation. Conversely, some aluminum alloys exhibit
increases in fracture toughness and strength with cryogenic temperatures. This may improve the
feasibility of employing a mechanical proof test at ambient temperatures as an effective screen for defects
at cryogenic operating conditions. Although there is no direct analytical relationship between fracture
toughness and ductile to brittle transition test data, ductile to brittle transition data can be a good starting
point for qualitative evaluation of material fracture behavior as a function of temperature, particularly for
high strength steels. Materials in critical applications should be used at temperatures above their ductile
to brittle transition temperature.
The effects of cumulative exposure at service temperatures should also be considered for material that
experiences cyclic use at or near the aging or precipitation heat treat temperatures of the material.
Repeated exposure at these temperatures can lead to changes in material toughness, ductility and crack
growth rates. Aluminum alloys can be particularly susceptible since their aging temperature is relatively
low.
Specific damage tolerance evaluation should be made for materials in service environments that may
degrade material performance, such as, hydrogen rich environments (plating or operational environments
– see section 3.8), low pH environments, chlorine rich environments, and liquid metal or solid metal
embrittling environments. Test methods for determining these effects are detailed in ASTM E1681 (23)
and ASTM G129 (24). These tests may be used to determine environmentally assisted cracking threshold
stress intensity factors (K
EAC
sometimes referred to as KIscc) for metallic materials. Although there is no
direct correlation to K
EAC
behavior, MSFC-STD-3029 (25) provides qualitative data and guidelines for
evaluating material susceptibility to stress corrosion cracking in a sodium chloride environment. These
data may be used as a starting point for gauging material response in adverse service environments.
Particular caution should be exercised for alloys with moderate or high susceptibility to stress corrosion
cracking.
Processing
Metallic materials used in the manufacture of parts in critical applications should be purchased per
standard aerospace industry material specifications (e.g., SAE, ASTM, ISO, NAS). With respect to
mechanical properties, these specifications define minimum room temperature strength and ductility
levels. Some material specifications define minimum fracture toughness levels, or provide the option for
fracture toughness requirements. In order to mitigate risk associated with fracture failures some
applications may warrant lot acceptance testing and/or inspection beyond what is required by
specification. With respect to testing it may be prudent to implement fracture toughness lot acceptance
testing for alloys exhibiting a strong inverse relationship between strength and fracture toughness, e.g.,
precipitation hardening steels, aluminum-lithium alloys. With respect to inspections, consideration may

61
be given to purchasing material with a raw stock (plate, bar, forging, casting) nondestructive evaluation
(NDE) that interrogates the internal (volumetric) integrity of the material. This typically consists of
quantitative ultrasonic and/or radiographic inspections to screen for volumetric defects in the material.
Quantitative NDE refers to inspection procedures that have been statistically assessed to be capable of
finding a given flaw size with a defined probability of detection and confidence level. Guidelines for
nondestructive evaluation may be found in NASA-STD-5009 (26). Texts by Shull (27), Cartz (28) and
ASM International (29) provide technical background and applications for various NDE methods.
Consideration should be given to variation in fracture toughness and crack growth rates with product form
(2). Plate, sheet, forgings, extrusions, and castings for the same alloy will generally exhibit enough
property variation to warrant data for each product form. Castings tend to exhibit lower properties and
more variability than wrought material. Toughness properties may vary with location and product form
geometry for a given casting, forging, extrusion or plate. Consideration should be given to
metallographic evaluation and tensile and fracture testing of areas with complex geometry, large section
thickness, or critical stress locations.
Additionally, fracture properties will vary with heat treat condition for a given alloy. The amount of cold
work, the precipitation hardened condition, quench rate, temper, and age condition, all affect the strength,
ductility, stress corrosion capability and fracture toughness of an alloy. For example, age practice
(overaging or underaging) of aluminum alloys can affect the strength, ductility and fracture toughness of
the material for a given temper (see section 2.2). Annealed titanium has better toughness properties than
solution treated and aged titanium (see section 2.3). Similarly, the interstitial content for a given titanium
alloy can affect the fracture toughness of the material. The ductility and fracture toughness of
precipitation hardness stainless steels varies significantly with the temper condition. With respect to
applications, it is important to ensure the fracture data is matched to the material process, composition and
heat treat condition of the alloy (2).
Thickness
Fracture properties in wrought plate and forging products may vary with thickness. Short transverse (S-
T) ductility, fracture toughness, and crack growth rate properties tend to degrade with increasing plate
thickness. Also, the in-plane properties may vary with location within the thickness of the plate (t), i.e.,
material at the t/2 location may have properties that are different from material at the t/6 location.
Through thickness microstructural variations that affect toughness properties may be influenced by the
through hardenability characteristics of the material, such as the quench rate sensitivity in steels, and the
degree of cold work in aluminums. With respect to material selection, it is important that material
representative of the thickness and product form of the raw stock used to manufacture the part is used in
the characterization of the material. For example, a 6 mm thick aluminum membrane machined from 50
mm thick aluminum plate will likely exhibit different fracture properties than 6 mm thick aluminum
sheet.
Orientation
Fracture properties vary with grain orientation depending on the degree of anisotropy in the material (2).
In general, for thin plate products, T-L properties (specimen loaded in the transverse direction with the
crack growing in the longitudinal direction) will be the lowest. However, materials with a high degree of

62
anisotropy should be evaluated in the T-L, L-T and 45° directions to determine the worst case toughness
orientation. In thick plate products, S-T properties are generally the lowest. With respect to material
selection, there is a tendency to use thick plate product forms for machining fittings, fixtures, lugs,
threaded blind holes, etc. Often these will be loaded in the S-T, or ST-45 directions. In these cases, S-T
or ST-45 characterization of fracture toughness should be conducted. Often a forged product will provide
better short transverse fracture toughness properties than thick plate and should be considered in design.
2.7.4 Availability of Damage Tolerance Data
Of practical importance is the availability of data to support the damage tolerance assessment. Generating
damage tolerance data, particularly in the appropriate service environment, can be expensive and time
consuming. When selecting a material for a safety critical application that may require damage tolerance
data, resource estimates should include availability of existing data and the cost of generating test data.
2.7.5 Summary
Important considerations when evaluating metallic materials for damage tolerance capability include the
following:
fracture toughness
fracture toughness to yield strength ratio
crack growth rate behavior
tearing capability
transferability of test data to the structural configuration
Parameters that may affect the damage tolerance behavior of metallic materials include the following:
service conditions (temperature, environment)
thermo-mechanical processing
thickness
product form
grain orientation
When selecting a metallic material for hardware requiring a damage tolerance assessment, some
consideration should be given to the availability of relevant data and the resources required to develop the
necessary data.
References
1. NASA-STD-5019A, Fracture Control Requirements for Spaceflight Hardware, Revision A, January, 2016.
2. NASA-HDBK-5010, Fracture Control Implementation Handbook for Payloads, Experiments, and Similar
Hardware, May, 2005.
3. Fitness-for-Service, API 579-1/ASME FFS-1, American Petroleum Institute and the American Society of
Mechanical Engineers, 2016.
4. Wallin, Kim. Fracture Toughness of Engineering Materials, Estimation and Application, EMAS
Publishing, 2011.
5. Saxena, Ashok. Nonlinear Fracture Mechanics for Engineers, CRC Press, 1998.
6. Suresh, Subra. Fatigue of Materials, 2
nd
Edition, Cambridge University Press, 1998.
7. Anderson, T. L. Fracture Mechanics, Fundamentals and Applications, 3
rd
Edition, CRC Press, Taylor and
Francis Group, 2005.

63
8. ASTM Standard E399, Test Method for Linear-Elastic Plane-Strain Fracture Toughness K
Ic
of Metallic
Materials, ASTM International.
9. ASTM Standard B645, Standard Practice for Linear-Elastic Plane-Strain Fracture Toughness of
Aluminum Alloys, ASTM International.
10. ASTM Standard E740, Practice for Testing with Surface-Crack Tension Specimens, ASTM International.
11. ASTM Standard E1820, Test Method for Measurement of Fracture Toughness, ASTM International.
12. Zhu. X. –K., Joyce, J.A., Review of Fracture Toughness (G, K, J, CTOD, CTOA) Testing and
Standardization, Engineering Fracture Mechanics, Volume 85, Elsevier, 2012.
13. Metallic Materials Properties Development and Standardization, MMPDS-07, Federal Aviation
Administration, April, 2008.
14. Aerospace Structural Metals Handbook, 39
th
Edition, Center for Information and Numerical Data Analysis
and Synthesis, Purdue Research Foundation.
15. Damage Tolerant Design Handbook, Center for Information and Numerical Data Analysis and Synthesis,
Purdue Research Foundation, 1994.
16. ASM Handbook Volume 19, Fatigue and Fracture, ASM International, 1996.
17. Sanford, R.J., Principles of Fracture Mechanics, Prentice Hall, 2003.
18. NASGRO® – Fracture Mechanics and Fatigue Crack Growth Analysis Software, Southwest Research
Institute, 2012.
19. AFGRO – Fracture Mechanics and Fatigue Crack Growth Analysis Software, LexTech Inc., 2010.
20. ASTM Standard E647, Test Method for Measurement of Fatigue Crack Growth Rates, ASTM
International.
21. Kannenin, M.K., Popelar, C.H., Advanced Fracture Mechanics, Oxford University Press, 1985.
22. Xia, L., Shih, C.F., Ductile Crack Growth – I. A Numerical Study using Computational Cells with
Microstructurally- Based Length Scales, Journal of Mechanical Physics of Solids, Volume 43, Number 2,
Elsevier Science Ltd., 1995.
23. ASTM Standard E1681, Test Method for Determining Threshold Stress Intensity Factor for Environment-
Assisted Cracking of Metallic Materials, ASTM International.
24. ASTM Standard G129, Standard Practice for Slow Strain Rate Testing to Evaluate the Susceptibility of
Metallic Materials to Environmentally Assisted Cracking, ASTM International.
25. MSFC-STD-3029, Revision A, Guidelines for the Selection of Metallic Materials for Stress Corrosion
Cracking Resistance in Sodium Chloride Environments, February, 2005.
26. NASA-STD-5009, Nondestructive Evaluation Requirements for Fracture-Critical Metallic Components,
April, 2008.
27. Shull, P.J. Nondestructive Evaluation, Theory, Techniques and Applications, Marcel Dekker, 2002.
28. Cartz, Louis. Nondestructive Testing, Radiography, Ultrasonics, Liquid Penetrant, Magnetic Particle,
Eddy Current, ASM International, 1995.
29. ASM Handbook Volume 17, Nondestructive Evaluation and Quality Control, ASM International, 1992.
30. JSSG-2006, Department of Defense Joint Service Specification Guide Aircraft Structures, October, 1998.
31. ASTM Standard E2899, Standard Test Method for Measurement of Initiation Toughness in Surface Cracks
Under Tension and Bending, ASTM International.
32. Barsom, J. M., Rolfe, S.T., Fracture and Fatigue Control in Structures, Applications of Fracture
Mechanics, 3
rd
Edition, ASTM, 1999.

64
2.8 Hydrogen Embrittlement in Metallic Materials
Jonathan A. Lee, NASA Marshall Space Flight Center
2.8.1 Introduction
Hydrogen embrittlement is a phenomenon that manifests as a decrease in the fracture toughness or
ductility of a metal in the presence of atomic hydrogen. The reduction of fracture loads can occur at
levels well below the yield strength of the material. Hydrogen embrittlement usually manifests as a
singular sharp crack in contrast to the extensive branching observed for stress corrosion cracking. The
initial crack openings and the local deformation associated with crack propagation may be so small that
they are difficult to detect except in special nondestructive examinations. Cracks due to hydrogen
embrittlement can grow rapidly with little macroscopic evidence of mechanical deformation in materials
that are normally quite ductile. A good understanding of hydrogen embrittlement is necessary for
selecting materials for applications in propulsion systems that use hydrogen as propellant.
In this section, a review of experimental data for the effects of gaseous hydrogen environment
embrittlement (HEE) is presented for several types of metallic materials with a view to guide material
selection. For aerospace applications, the material screening methods are used to rate the hydrogen
degradation of mechanical properties that occur while the material is under an applied stress and exposed
to gaseous hydrogen as compared to air or helium, under slow strain rates (SSR) testing. Due to the
simplicity and accelerated nature of these tests, the results are expressed in terms of HEE Index and are
not intended to necessarily represent true hydrogen service environment for long-term exposure, but
rather to provide a practical approach for material screening, which is a useful tool to qualitatively
evaluate the severity of hydrogen embrittlement. The effects of hydrogen gas on mechanical properties
such as tensile, ductility, fatigue and fracture toughness are analyzed with respect to the general trends
established from the HEE index values. It is observed that the severity of the HEE effects is also
influenced by the environmental factors such as pressure, temperature and hydrogen gas purity.
2.8.2 Classification of Hydrogen Embrittlement
The interaction between hydrogen and metals can result in the formation of solid solutions of hydrogen in
metals, solid compound as hydride, and gaseous compounds with other elements in the metal. Hydrogen
embrittlement, through these hydrogen-metals interactions, can be classified into three broad categories:
Hydrogen Environmental Embrittlement (HEE), Internal Hydrogen Embrittlement (IHE) and Hydrogen
Reaction Embrittlement (HRE). In general, HEE represents the condition when the materials are being
exposed to a high pressure gaseous hydrogen environment. The definition of IHE often implies that the
source of hydrogen is from an electrochemical process such as electroplating, corrosion, cathodic
charging and even from thermal charging with gaseous hydrogen at relatively low pressures. However,
the HEE and IHE are similar in many instances and both require an external applied stress in order for the
hydrogen embrittlement effects to occur. The definition for HRE is usually irreversible hydrogen damage
due to a chemical reaction with hydrogen, and that such damage can occur without an external applied
stress.
Figure 2.8.1 is a diagram showing an overlapped region that forms the HEE, IHE and HRE, and the size
of this region graphically represents the severity for hydrogen embrittlement. The size of the overlapped
region can increase or decrease depending on how significant the intersections are from three main circles
that represent the influence of material type, hydrogen embrittlement, and the applied stress. By
definition, the intersections of hydrogen, material and the stress circle produce the HEE and IHE effects
within the same overlapped region positioned at the center of this graph. The difference between HEE
and IHE is that the source of hydrogen for IHE is not usually from a high pressure system, but the

65
hydrogen is unintentionally produced and the internally absorbed hydrogen can result in a time-delayed
embrittlement effect under an applied stress. Because the HRE type is formed by the intersection
between hydrogen and material, HRE type can exist without the influence of the applied stress circle.
Figure 2.8.1 Classification of HEE, IHE and HRE type based on hydrogen, stress and material factors.
Hydrogen Environmental Embrittlement (HEE)
Hydrogen Environmental Embrittlement (HEE) is commonly known as the degradation of certain
mechanical properties that occur while the material is under the influence of an applied stress and
intentionally exposed to gaseous hydrogen environment. HEE is the most common type of hydrogen
embrittlement encountered for aerospace applications. It is noted that the applied stress values required to
cause failure are in tension mode and can stay well below the yield strength for highly susceptible
materials. In most cases, the constant static loading is usually considered to be more sensitive to
hydrogen embrittlement than cyclic or dynamic loading, particularly at high cycle. The residual stress is
also important and must be considered in combination with the applied external stress. Material screening
tests using slow strain rates (pseudo-static) or static loading on special designed notched coupons are
commonly used to determine a threshold stress value. In a well characterized condition, such threshold
stress values may be used to indicate the maximum allowable stress that can be applied to avoid the HEE
effects. A comprehensive review of experimental data for the effects of HEE is presented in this section
for several types of metallic materials.
Internal Hydrogen Embrittlement (IHE)
Internal Hydrogen Embrittlement (IHE) is commonly recognized as the result of the unintentional
introduction of hydrogen into susceptible metals during forming or finishing operations. For example,
IHE is the absorption of atomic hydrogen from common chemical processes such as acid pickling,
electroplating, and corrosion. All of these are electrochemical processes involving the discharge of
hydrogen ions. However, IHE can also result from exposing the susceptible material to certain aqueous
environment, which is also an electrochemical processes involving the discharge of hydrogen ions. The
IHE cracks usually occur internally and are located near the root of an internal defect, where the localized
stress values are high. However, the distinction between IHE and HEE is not always clear for thermal
charging of gaseous hydrogen at relatively high temperature. For example, the IHE effects often
associate with the absorption of hydrogen in ambient atmosphere by molten metal during the welding or
casting process. Upon rapid cooling of the weld or casting, entrapped hydrogen can produce internal
Hydrogen
Environment
Applied
Stress
Material
Type
HEE
IHE
HRE

66
fissuring or other damaging effects that often attribute to IHE. Because of the higher solubility of
hydrogen at high temperature, rapid cooling of heavy section of certain materials operating in high
pressure and temperature conditions can result in IHE without having to experience a high level of
applied external stress. It is recognized that there are some differences between the high pressure gaseous
environment for HEE and from the electrochemical environment for IHE; however, once atomic
hydrogen has been absorbed by a material, the hydrogen embrittlement effects for HEE and IHE are
similar, and have been shown to be the case for a number of materials.
Hydrogen Reaction Embrittlement (HRE)
At certain elevated temperatures and pressures, atomic hydrogen can easily diffuse though metal surfaces
and chemically react with certain types of elemental and compounds in the material. However, hydrogen
can also react with the metal matrix itself to form metallic compounds such as metal hydride at relatively
low temperatures. This form of hydrogen damage is known as Hydrogen Reaction Embrittlement (HRE).
It can occur in materials such as titanium, zirconium, and even for some types of iron or steel based
alloys. For example, a common reaction is between hydrogen and iron-carbides to form gaseous methane
(CH
4
), according to the following chemical reaction:
4H + Fe
3
C = CH
4
+ 3Fe Eq. (2.8.1)
Beneath the surface layer and deep within the bulk of the material, the formation and migration of CH
4
gas molecules usually concentrate at grain boundaries and metallurgical features such as inclusions,
impurity, and defects can lead to brittle rupture through the formation of voids, blisters and a network of
discontinuous micro cracks. Moreover, because the carbide phase is a reactant in the mechanism, its
depletion in the vicinity of generated defects serves as direct evidence of the HRE mechanism itself. The
HRE sensitivity depends on the amount of carbon or carbide in the alloy, the hydrogen concentration, gas
pressure, and temperature usually in the range of 200
0
C to 600
0
C (392
0
F to 1110
0
F). Alloy steels with
stable carbides, such as chromium-carbides are less susceptible to this form of hydrogen attack due to the
greater stability of Cr
3
C versus Fe
3
C found in carbon steels. However, as the pressure and temperature of
hydrogen environment increases, a greater amount of these alloying additions are required to prevent such
attack.
2.8.3 Hydrogen Embrittlement Mechanisms
Over the years, there were many proposed theories to explain the hydrogen embrittlement mechanisms.
This section provides a brief review of a promising theory, which is based on a concept that Hydrogen
Alters the Density of States (HADOS) of the host metal’s electron band, leading to the embrittlement
effect (J.A. Lee, [1, 2]). The basis of the theory is summarized as follows: since the cohesive strength of
a transition metal is governed by the bonding energy of the d-electrons occupied near the Fermi energy
level, it is postulated that hydrogen embrittlement is a reduction of the bonding energy of the metal atoms
by the introduction of the hydrogen’s electrons into the d-band of the host metal. The quantum value that
describes the number of electron states that is available to be occupied by hydrogen is called the electron
Density of States (DOS) at the Fermi energy level. If there are a limited number of states available for the
hydrogen electrons to occupy, then hydrogen embrittlement is expected to be minimal. Conversely,
hydrogen embrittlement is likely to increase if the value of the DOS from the host metal is increased. It
has been shown by M. R. Louthan [3] that hydrogen solubility in transition metals will increase with
increasing DOS values. Louthan also suggested that hydrogen embrittlement is at least partially
dependent on the solubility of hydrogen atoms in the host metal, a notion that supports the basis for the
HADOS model.

67
Interestingly, the effect of alloy compositions on hydrogen embrittlement can be examined only in the
light of the HADOS theory, where other hydrogen embrittlement theories cannot provide a satisfactory
explanation. It was suggested that hydrogen embrittlement is more pronounced for pure metals with
higher DOS values than for metals with lower DOS values. This correlation was based on the d-band
electron filling and charge transfer between hydrogen electron and the host metals. However, the
potential merit for the HADOS model seems to gain momentum later under several binary alloys studies
using Fe-Ni, Fe-Co, Ni-Co, Ni-W, Cu-Ni and Pd-Ag. Experimentally, it was found that the hydrogen
embrittlement effects also correlated well with the DOS values for these binary alloy systems [1, 2].
These are important binary systems for compositional analysis because they can form a continuous range
of compositions, having a single phase microstructure, subjected to similar heat treatment within that
particular binary system, so that a reasonable comparative study of hydrogen embrittlement mechanisms
can be made based solely on the alloy compositions.
On the research aspect, it is evident from the hydrogen embrittlement literature survey that there are many
good technical papers, published mostly for industrial complex alloys, with common repeating themes
such as dislocation movements, fracture surface analysis, void and micro-crack formations,
microstructure, etc. Most of these are typical examples of hydrogen-material damage studies that take
place in the confinement of the “microscopic” scale. However, very few in-depth “cross-discipline”
studies have been conducted in order to understand the key connection between the electronic properties
(atomistic scale) and the HEE effects on mechanical properties (macroscopic scale). At this time, it
appears that there are currently two popular models for hydrogen embrittlement mechanism based on the
mechanical properties observed at the macroscopic scale: the Hydrogen Enhanced Decohesion (HEDE)
and the Hydrogen Enhanced Localized Plasticity (HELP) as reviewed by W.W. Gerberich [4]. However,
it is important to make a distinction that the proposed electron charge transfer mechanism from the
HADOS theory operates at a much smaller scale than what the HEDE and HELP models are dealing with.
Whether the HADOS mechanism at the atomistic scale would lend its support to the HEDE or HELP, or
both models operating at the microscope scale, will remain to be seen in the future.
2.8.4 Materials Selection Guide for Hydrogen Compatibility
Materials Screening Methods
There are several materials screening methods to rate the hydrogen embrittlement effects of certain
mechanical properties in hydrogen environment, as compared to air or an inert environment such as
helium. Experimentally, it has been found that the general trend for HEE effects on Notched Tensile
Strength (NTS), measured from a sharp notched specimen, is well correlated with the Reduction of Area
(RA), and elongation (EL) measured from a smooth specimen under slow strain rates (SSR) testing. For
example, the trend line for HEE effects on NTS and RA as a function of temperature, at hydrogen
pressure of 8.3 MPa (1.2 ksi), is shown in Figure 2.8.2 for electro-deposited nickel. There are several
proposed test standards for the HEE effects; however, the test procedures and specimen preparations as
baselined in G-129 and G-142, from the American Society for Testing of Materials (ASTM), are
commonly used as material screening methods for the hydrogen embrittlement susceptibility under SSR
testing. These test methods can also be used to evaluate the effects of material’s composition, processing,
and heat treatment when the materials are exposed to specific hydrogen pressure and temperature
conditions. According to ASTM G-129 standard [5], as a minimum the HEE effects can be evaluated in
terms of the reduction ratio of NTS from a notched specimen, and the reduction ratio of RA from a
smooth specimen. Due to the simplicity and accelerated nature of these tests, the results are not intended
to necessarily represent true hydrogen service environment for long-term exposure, but rather to provide a
basis for material screening for HEE.

68
The property ratio for NTS, RA, and EL, tested in hydrogen environment as compared to Helium or Air,
is commonly used as the HEE Index. By using a compact tension, fatigue pre-cracked specimen, an
important HEE index based on the threshold stress intensity factor ratio will be discussed in further detail
for hydrogen effects on fracture properties. In general, HEE Index is a simple concept to evaluate the
severity of hydrogen embrittlement as an initial material screening tool. According to ASTM-G129, these
commonly used HEE indexes are defined as followed:
NTS Ratio = NTS in Hydrogen/NTS in Air or Helium Eq. (2.8.2)
RA Ratio = RA in Hydrogen/RA in Air or Helium Eq. (2.8.3)
EL Ratio = (EL) in Hydrogen/(EL) in Air or Helium Eq. (2.8.4)
In all cases, the material screening for the HEE effects will be based on reduction in the value of the HEE
Index from 1 to 0. Therefore, for maximum hydrogen embrittlement resistance, it is important to select
materials with high HEE Index, as close to unity as possible.
Figure 2.8.2: Trend line for HEE effects on NTS and RA for electro-deposited nickel.
Under the SSR testing procedures, typical strain rates for smooth specimens are 0.0005 in/in/min (8.3 x
10
-6
mm/mm/s) and 0.005 in/min (8.3 x 10
-5
mm/s) for notched specimens, respectively. For notched
specimens, the typical values for stress concentration factor (K
t
) are 6 to 8. The HEE indexes based on
the NTS ratio is the most preferred for material screening.
Historically, hydrogen embrittlement evaluation for a large number of metallic materials has been
investigated by Walter and Chandler, who first suggested classifying the susceptibility of HEE Index
measuring at room temperature, in 10 ksi (69 MPa) hydrogen pressure, into four categories: negligible,
slight, severe and extreme [6]. Their classification was based mostly on NTS ratio taken from notched
tensile specimens, and the RA ratio taken from smooth specimens. Because of its usefulness for
qualitative material screening method, a simplified suggestion format for hydrogen embrittlement
0
5
10
15
20
25
30
35
40
0
200
400
600
800
1000
-250 -200 -150 -100 -50 0 50 100 150 200
Notched Tensile Strength (MPa)
Temperature (°C)
Notched Tensile Strength (Mpa)
Smooth Reduction Area (%)
Smooth Reduction Area (%)
Electro-Deposited Nickel
(H pressure = 8.3 MPa)

69
category, based on these early works, is shown in Table 2.8.1. It must be noted that the proposed HEE
Index classification is only a qualitative material screening method based on an accelerated test in
laboratory environment. It should not be used for components design without detailed fracture mechanics
and design analysis for safety usage in hydrogen environment, particularly, for materials that are
qualitatively rated in the embrittlement category of High, Severe and Extreme.
Table 2.8.1: Material screening for hydrogen embrittlement based on HEE Index from NTS ratio.
H Embrittlement
Category
HEE INDEX
(NTS Ratio)
MATERIAL SCREENING NOTES *
Negligible 1.0 - 0.97
Small 0.96 - 0.90
High 0.89 - 0.70
Cautiously use only for limited applications with detailed fracture mechanics &
crack growth analysis in hydrogen.
Severe 0.69 - 0.50
Extreme 0.49 - 0.0
Not recommended for usage at specific pressure and temperature where the HEE
Index is measured.
*Based on application at specific hydrogen pressure & temperature, where HEE Index is measured. In all category, additional testing & fracture
analysis must be peformed beyond the material screening phase.
Materials can be used in the specified hydrogen pressure & temperature range
with fracture mechanics & crack growth analysis in hydrogen.
Material Database for Hydrogen Environment Embrittlement (HEE)
A comprehensive world-wide database compilation, in the past 50 years, has shown that the HEE index
for metallic materials is mostly collected at two high hydrogen pressure points of 5 ksi (34.5 MPa) to 10
ksi (69 MPa), near room temperature. This invaluable database is commonly used as a qualitative material
screening process for hydrogen embrittlement severity based on the decrease in the value of the HEE
Index from unity [7, 8]. The available HEE indexes data for several metallic materials, based on the
property ratios for Notched Tensile Strength (NTS), Reduction in Area (RA) and Plastic Elongation (EL)
are listed in Table 2.8.2 and 2.8.3. Testing was done at room temperature and in hydrogen pressure range
of between 5 ksi (34.5 MPa) and 10 ksi (69 MPa). Table 2.8.2 lists the HEE index for selected aluminum,
copper, titanium, nickel and iron based alloys and for several different types of austenitic, ferritic, and
martensitic steels. The HEE indexes for selected nickel, iron and cobalt based superalloys are given in
Table 2.8.3. This database should not be used to estimate the HEE effects at high temperature, nor for
components design without the detailed fracture analysis for safety usage in hydrogen gas environment,
particularly for materials that are qualitatively rated in the High, Severe and Extreme categories.

70
Table 2.8.2: HEE Indexes for selected metals tested at 24°C under high hydrogen pressure.
MATERIAL
(HEE Tested at 24C) NTS EL RA EL RA NTS YS UTS
A302B 69.0 high 0.78 0.85 0.50 1564 813 827
A286 69.0 negligible 0.97 1.10 0.98 26 47 1606 724 1117
304L (annealed) 69.0 high 0.87 0.92 0.91 86 78 703 234 531
304N 69.0 high 0.93 0.84 0.73 43 74 641 848
305 69.0 high 0.89 1.03 0.96 63 78 1137 351 620
309S 69.0 small 0.96 0.97 85 76 241 558
310 69.0 small 0.93 1.00 0.96 56 64 799 220 531
316 69.0 negligible 1.00 0.95 1.04 59 72 1109 441 648
18-2-12 (Nitronic 32) 69.0 severe 0.64 0.47 75 78 482 861
21-6-9 + 0.12N (Nitronic 40) 69.0 high 0.89 0.80 65 74 434 744
22-13-5 (Nitronic 50) 69.0 negligible 1.00 1.00 51 67 586 938
18-18 Plus 69.0 severe 0.67 63 520 910
18-2-Mn 69.0 severe 0.65 51 730 1007
18-3-Mn 69.0 small 0.92 50 530 790
A212-61T (normalized) 69.0 severe 0.68 0.60 57 765
A372 (class 4) 69.0 high 0.74 0.50 0.34 20 53 1378 565 813
A515-Gr. 70 69.0 high 0.73 0.69 0.52 42 67 731 310 448
A517-F 69.0 high 0.78 1.00 0.96 18 65 1532 751 813
A533B 69.0 high 0.78 0.89 0.50 19 66 1564 820
HY-80 69.0 high 0.81 0.86 0.85 23 70 1311 566 676
HY-100 69.0 high 0.73 0.90 0.83 20 76 1546 669 780
430F 69.0 severe 0.68 0.63 0.58 22 64 1047 496 551
1020 69.0 high 0.85 0.80 0.66 40 68 724 283 435
1042 (normalized) 69.0 high 0.75 0.75 0.45 29 59 1056 400 621
4140 (high strength) 69.0 extreme 0.40 0.18 0.18 14 48 2160 1233 1283
4140 (low strength) 69.0 high 0.85 1660 930
4340 (1652 F austen.) 34.5 extreme 0.35 0.31 0.26 12.4 54.2 2157 1302 1371
AerMet 100 (peak aged) 69.0 extreme 0.15
H-11 69.0 extreme 0.25 0.00 0.00 8.8 30 1736 1681 2060
410 69.0 extreme 0.20 0.12 0.20 12 60 2730 1324 1524
440C 69.0 extreme 0.50 0.01 0.01 3.5 3.2 1027 1627 2075
17-4 PH 69.0 extreme 0.18 6.4 1076 1145
17-7 PH 69.0 extreme 0.22 0.10 0.06 17 45 2151 1124 1200
18Ni-250 Maraging 69.0 extreme 0.12 0.03 0.05 8.2 55 2914 1709 1723
Nickel (electroformed) 69.0 extreme 0.31 827
Nickel 270 69.0 high 0.70 0.92 0.75 56 89 531 34 331
Nickel 301 (annealed) 69.0 extreme 0.52 0.35 34 1600 486 791
K-Monel (Kt =4; precipitated) 69.0 extreme 0.45 1729 958
K-Monel (Kt = 4; annealed) 69.0 high 0.73 992 689
Titanium (pure) 69.0 small 0.95 0.96 1.00 32 61 868 365 434
Ti-6Al-4V (annealed) 69.0 high 0.79 1.00 1.00 15 48 1674 909 1075
Ti-6Al-4V (STA) 69.0 severe 0.58 0.85 0.95 13 47 1571 1082 1130
Ti-5Al-2.5Sn (ELI) 69.0 high 0.81 0.90 0.86 20 45 1385 730 779
Copper (OFHC) 69.0 negligible 0.99 1.00 1.00 63 94 600 269 290
Aluminum Bronze 68.9 negligible 1.02 1.05 48 67 220 600
Be-Cu alloy 25 69.0 small 0.93 1.00 0.98 22 72 1344 544 648
GRCop-84 (Cu-8Cr-4Nb) 34.5 negligible 1.00 1.20 20 42 250 413
NARloy-Z (Cu-3Ag-0.5Zr) 40.0 negligible 1.10 0.92 24 138 269
70-30 Brass 69.0 negligible 1.00 0.98 8 70 572 606
1100-T0 69.0 negligible 1.38 0.93 1.00 42 93 124 34 110
2011 69.0 negligible 0.95 1.01 18 57 227 296
2024 69.0 negligible 0.95 0.97 19 36 324 441
5086 69.0 negligible 1.05 1.03 20 55 193 303
6061-T6 69.0 negligible 1.07 1.00 1.08 19 61 496 227 269
6063 69.0 negligible 1.00 1.01 15 83 158 193
7039 69.0 negligible 1.00 1.01 14 85 152 179
7075-T73 69.0 negligible 0.98 0.80 0.94 15 37 799 372 455
Alloy
System
Tensile Strengths, in
Helium or Air (MPa)
H Pressure
(MPa)
Austenitic Steels
Nickel Based
Titanium
Based
Martensitic Steels
Ferritic Steels
Smooth
Ductility (%), in
Helium or Air
HEE Index,
(Ratio H/He)
Qualitative
Rating for HEE
Copper Based
Aluminum Based

71
Table 2.8.3: HEE Indexes for selected superalloys tested at 24°C under high hydrogen pressure
SUPERALLOYS
(HEE Tested at 24°C) NTS EL RA EL RA NTS YS UTS
AF-115 (Powder Metall) 34.5 high 0.80 23 21 1764 1185 1702 70
AF-56 (single crystal) 34.5 high 0.84 35
Astroloy (Powder Metall) 34.5 small 0.94 26 37 1805 1096 1523 70
CM SX-2 (single crystal) 34.5 extreme 0.14 0.45 14.3 1495 958 1047 69, 71
CM SX-3 (std) 34.5 extreme 0.38 0.14 14 1461 69
CM SX-4C (single crystal) 34.5 extreme 0.36 10.6 1536 999 1089 69, 71
CM SX-4D 34.5 extreme 0.43 1488 69
CM-SX5 34.5 extreme 0.36 1523 69
Hastelloy X 34.5 high 0.86 0.98 0.98 54 63 1006 317 717 21
Haynes 230 34.5 high 0.76 0.41 1068 365 827 35
Haynes 242 34.5 high 0.77 0.20 1860 861 1337 35
IN 100 34.5 extreme 0.30 1736 1151 1612 69
Inconel 625 34.5 high 0.76 0.36 0.36 55 50 1433 634 992 36
Inconel 700 69.0 extreme 0.45 0.32 22 44 1034 1344 30
Inconel 706 48.2 high 0.82 0.54 37 1578 69
Inconel 713LC 41.3 extreme 0.42 0.38 6.9 9.5 696 813 69, 73
Inconel 718 (ST @1750°F) 34.5 extreme 0.53 0.24 0.34 20.8 29.5 1723 1102 1364 21
Inconel 718 (ST @1750°F) 69.0 extreme 0.46 0.09 0.08 17 26 1888 1254 1426 4, 8
Inconel 718 (ST @1900°F) 34.5 small 0.92 0.87 0.76 26 50.6 2081 1075 1295 21
Inconel X-750 48.2 extreme 0.26 35
Inco 4005 (experiment) 34.5 severe 0.64 0.21 1860 1013 1357 35
MAR-M200 (Direct Solidify) 34.5 extreme 0.23 9.7 69
MAR-M246 (Hf) (single crys) 48.2 extreme 0.24 0.33 12 1213 63
MA 6000 (Transverse) 34.5 small 0.92 0.50 2 69
MA 6000 (Longitude) 34.5 high 0.86 1.00 1 69
MA 754 (Transverse) 34.5 extreme 0.27 36 1158 69
MA 754 (Longitude) 34.5 extreme 0.19 47 1178 69
MERL 76 (Powder Metal) 34.5 small 0.96 30 28 1764 1034 1557 70
MERL 76 34.5 high 0.85 0.25 28 1660 69
NASA-HR1 34.5 negligible 0.98 24 944 1323 74
PWA 1480 (single crystal) 34.5 extreme 0.49 12.4 1516 1040 1151 71
PWA 1480E (111 plane) 34.5 high 0.88 1564 75
Rene 41 34.5 extreme 0.36 35
Rene 41 69.0 extreme 0.27 0.20 0.38 21 29 1929 1123 1350 4, 8
Rene N-4 (single crystal) 34.5 extreme 0.46 0.48 10.6 1474 978 1158 71
Rene 95 (Powder Metall) 34.5 severe 0.62 18 21 1805 1330 1688 70
RR 2000 34.5 extreme 0.54 1378 69
Udimet 720 34.5 extreme 0.53 1771 69
Udimet 700 51.7 severe 0.65 76
Waspaloy (Powder Metall) 34.5 small 0.95 20 34 1950 1199 1523 70
A286 (ST @1640°F) 69 negligible 0.97 1.10 0.98 26 44 1605 847 1089 4, 8
A286 (ST + Aged) 69 (T.C)* severe 0.51 38
Incoloy 802 48.2 negligible 0.99 35
Incoloy 901 34.5 severe 0.60 0.40 21 1688 69
Incoloy 903 (ST only) 34.5 negligible 0.98 1.00 0.96 42 2122 69
Incoloy 903 (ST + Aged) 24 (T.C.)* severe 0.55 77
Incoloy 907 69 small 0.96 1819 69
Incoloy 909 (ST + Aged) 34.5 extreme 0.36 0.39 12 22.4 1054 1350 78, 35
JBK-75 (ST only) 34.5 negligible 0.98 0.92 28 51 1585 462 744 79, 35
JBK-75 (ST + Aged) 172 high 0.75 0.45 79
MA 956 (Longitude) 34.5 severe 0.58 1364 69
MA 956 (Transverse) 34.5 extreme 0.34 1151 69
Ni-SPAN-C (alloy 902) 69 small 0.93 16 751 1158 44
Haynes 188 48.2 high 0.92 0.63 63 1130 63
MP35N 24 high 0.73 2425 1385 1433 35
MP35N 34.5 high 0.70 0.85 23 58 2425 1385 1433 35
MP159 24 high 0.66 2253 1895 1922 35
MP159 34.5 severe 0.63 7 31 2253 1895 1922 35
MP98T 34.5 high 0.85 1171 1275 35
X-45 (superalloy) 34.5 high 0.87 0.63 1585 462 744 35
*T.C . = H2 thermally charged at 200 °C at indicated pressure for 200 hrs (A286) and 500 hrs (Incoloy 903). HEE tested at 24°C.
Alloy
System
Iron Based
Cobalt Based
Ref.
Nickel Based
H
Pressure
(MPa)
Qualitative
Rating for HEE
Tensile Strengths, in
Helium or Air (MPa)
Smooth
Ductility (%), in
Helium or Air
HEE Index,
(Ratio H/He)

72
2.8.5 General Observations for Metallic Materials
Aluminum and Aluminum Alloys:
Dry hydrogen gas environment has negligible effects on aluminum and its alloys. The major issue with
hydrogen arises mostly from the exposure to moisture and the formation of gas-filled voids during
molten, casting and solidification process from the foundry. These voids are material defects, which
affect both cast and wrought product’s mechanical properties such as ductility and fracture toughness.
During cooling from the melt, hydrogen diffuses to and precipitates in casting defects, producing cracks
from the decreased solubility of hydrogen in solid metal at lower temperature. Dry hydrogen gas near
room temperature, at pressure up to 10 ksi (69 MPa), does not cause significant hydrogen embrittlement
effect in aluminum alloys. However, when high strength aluminum alloy is electro-chemically charged
by hydrogen in an aqueous solution, its ductility is reduced. The main mechanism of embrittlement for
aluminum alloys in an aqueous medium could be the SCC rather than pure HE effect. The combined
mechanism of anodic material dissolution SCC or cathodic hydrogen embrittlement remains an open
question for aluminum alloys when subjected to an aqueous environment.
Copper and Copper Alloys:
Copper and the copper-rich alloys are usually not susceptible to hydrogen embrittlement unless they
contain oxygen or copper-oxide. When oxygen bearing copper and copper alloys are annealed or heated
in hydrogen environment, the atomic hydrogen diffuses into the metals and reacts with the copper-oxide
or the oxygen to form water, which is converted to high pressure steam if the temperature is above 375
0
C
(705
0
F). This is a classical example of Hydrogen Reaction Embrittlement (HRE), as the steam will
induce hydrogen damage in the forms of fissures and blisters appearance, decreasing the fracture
toughness and ductility of the metals even without the applied of external pressure. Tough pitch coppers
usually contain small quantities of Cu
2
O; therefore, they should not be exposed to hydrogen gas at any
temperature if they will subsequently be exposed to temperature above 370
0
C (700
0
F). The equation for
reaction with cuprous oxide particles is:
Cu
2
O + 2H = 2Cu + H
2
O (g) Eq. (2.8.5)
Nickel and Nickel based Alloys:
Nickel and nickel-based alloys have good properties for high temperature strength, oxidation and hot
corrosion resistance. However, a nickel based alloy that has good ratings for dry-oxidation and chemical
corrosive environment does not automatically mean that it is also immune to hydrogen embrittlement. As
an element, pure nickel is severely embrittled by hydrogen; therefore, most binary alloys with nickel-rich
composition such as Nickel-Copper, Nickel-Iron, Nickel-Cobalt, and Nickel-Tungsten are also found to
be highly embrittled by hydrogen in the nickel rich regions [1, 2]. In some nickel-rich alloy systems, the
same observation is held. For example, the nickel-rich alloys known as K-Monel have been known to be
embrittled by hydrogen at high pressure. However, the influence of nickel on complex compositions of
steels and superalloys is much more difficult to analyze due to factors such as heat treatment and product
forms. The HEE indexes for several materials that contain nickel and the nickel-based superalloys are
given in Table 2.8.2 and 2.8.3, respectively.
Titanium and Titanium Alloys:
In general, titanium alloys have excellence corrosion resistance properties in aqueous environment. This
superior corrosion resistance property is due to a thin, stable, and tenacious titanium-oxide (TiO
2
) film
that naturally forms in air and water under the oxidizing conditions. The naturally formed TiO
2
film on

73
titanium appears to inhibit hydrogen uptake effectively under low-to-moderate cathodic charging
conditions. However, under high cathodic charging current densities this protective film can break down
and become non-protective for titanium alloys and will allow atomic hydrogen to penetrate into the bulk
of the material. In near neutral electrolytes such as seawater, galvanic coupling to metals such as zinc,
aluminum and magnesium can induce enhanced hydrogen uptake and hydride formation when coupled
with titanium at temperature above 80
0
C (175
0
F). On the other hand, in dry-hydrogen gas environment,
titanium alloys will absorb hydrogen readily as the temperatures and pressures increase. Relatively small
amount of titanium-hydride precipitates are not detrimental for most applications, particularly, in the
hydrogen concentrations range of 40 to 80 ppm (part per million). However, excessive titanium-hydride
can form rapidly when the temperature is above 250
0
C (480
0
F). This type of hydrogen embrittlement is
the HRE type; however, it is also considered as the IHE by some industries during high temperature
processing such as welding or heat treatment in the present of hydrogen. Graphically, the distinction
between IHE and HRE is not always well recognized for metals that form unstable hydrides, as they are
positioned closely in the overlapping region, as shown in Figure 2.8.1.
Steels:
The HEE susceptibility of steels can generally be viewed in four categories: austenitic, ferritic,
martensitic, and precipitation hardening (see section 3.4). In general, most low strength austenitic steels
are less susceptible to hydrogen embrittlement, relative to the ferritic steels. However, the martensitic and
precipitation hardening steels are known to be extremely susceptible to the HEE and IHE effects. There
are some similarity between the austenitic stainless steels and the Fe-Ni-Cr superalloys in terms of
compositions versus the HEE effects. Concerning the HRE effects, at certain elevated temperatures and
pressures, atomic hydrogen can diffuse through metal and react internally with certain types of elements
and compounds in the steel based alloys. The most common reaction is between hydrogen and iron-
carbides to form methane gas (CH
4
) – Eq. 3.8.1. Because CH
4
cannot diffuse out of steel, an
accumulation occurs, which causes fissuring and blistering that can lead to embrittlement and loss of
strength and ductility. The addition of Chromium and Molybdenum are beneficial for many carbon and
low alloy steels to reduce or prevent the HRE effects that result in decarburizing and fissuring.
Superalloys:
For aerospace applications, superalloys are common materials used in liquid hydrogen & oxygen
propulsion systems. The superalloys are discussed in detail in section 2.5. There are more HEE index
data available for nickel-based alloys than any other types of superalloys. The differences in superalloy
heat treatment and product form can have an effect on the degree of hydrogen embrittlement. In general,
conventional wrought and PM processed superalloys have been found to be slightly less embrittled in
hydrogen than cast polycrystalline superalloys with similar compositions.
Guide for Selecting Proper Materials
At relatively low hydrogen gas pressures, the degradation of fracture properties for many susceptible
materials is not as severe as at high pressure. In addition, at certain cryogenic temperature range, most
materials are negligibly embrittled by hydrogen even when they are exposed to a relatively high hydrogen
pressure of greater than 5 ksi (34.5 MPa). Therefore, depending on the hydrogen pressure and
temperature range, it is possible to select the proper materials for hydrogen applications, based on the
qualitative rating method as shown in Table 2.8.1. Historically, notable service failures associated with
susceptible materials in hydrogen gas environment have been linked to a combination of highly stressed
components that were operating outside of the allowable range of hydrogen pressure and temperature. It
must be noted that the material database, using the HEE Index classification, is only a qualitative material
screening method based on an accelerated test in laboratory and should not be used for components

74
design without the detail fracture analysis, particularly for materials that are qualitatively rated in the
category of High, Severe and Extreme. Selecting proper materials should be done with design using
sufficiently high safety factors, coupled with rigorous material characterization based on fracture
mechanics, non-destructive evaluations, and material testing in the operating hydrogen pressure and
temperature range. Test data taken from thermal pre-charging in hydrogen gas or any electrochemical
method should not be treated as identical to the data taken from actual testing in high pressure gaseous
hydrogen.
Heat treatments can have a profound effect on the degree of hydrogen embrittlement, particularly for
materials with complex microstructures. In general, superalloys and steel based alloys that have low
tensile strengths and heat treated in annealed conditions will tend to have better hydrogen embrittlement
resistance than higher strength alloys. Therefore, tests should be conducted to determine the hydrogen
embrittlement effects in order to select proper thermo-mechanical treatment for susceptible materials. For
example, A-286, JBK-75, and Incoloy 903 the data trend shows that aging treatment can drastically affect
their HEE behavior. In general, aging conditions would dramatically increase the yield strength and
ultimate tensile strength for many materials. However, these aging treatments would cause most of these
high strength materials to have lower ductility and also make them more susceptible to hydrogen
embrittlement.
2.8.6 Hydrogen Effects on Mechanical Properties
Tensile Properties:
It is experimentally found that the values for modulus of elasticity (E) and the yield strength (YS) of most
materials are not strongly affected by hydrogen. However, the ultimate tensile strength (UTS), taken
from smooth tensile specimens, can be moderately reduced if the materials are deemed to be very
susceptible to hydrogen embrittlement. Therefore, the ratio of E, UTS and YS taken from smooth tensile
specimens are not to be used as good indicators for HEE index. The basic tensile properties that are
strongly affected by Hydrogen can be listed as the notched tensile strength (NTS), reduction in area (RA)
and plastic elongation (EL)—see Tables 2.8.2 and 2.8.3. Experimentally, it has been shown that the
general trend for hydrogen effects on NTS ratio, measured from a notched specimen, correlates well with
the RA ratio and EL ratio, measured from a smooth specimen under slow strain rates (SSR) testing.
Fracture Properties:
Hydrogen has a significant influence on the crack initiation and growth behavior, particularly when
reasonably large surface flaws exist on a susceptible material exposed to high pressure hydrogen
environment. Therefore, fracture mechanics analysis is usually required to assess the maximum
allowable stress and service life of a component, based on the surface flaw sizes and crack growth rates,
in hydrogen environment. Using the ASTM E-1681 test standard, the threshold stress intensity factor
(K
TH
) in hydrogen environment can be determined from a pre-cracked specimen, under static loading.
Because of the intrinsic nature from the experimental setup to determine the K
TH
by using monitoring
system for the “onset” of crack initiation, theoretically, it appears that the K
TH
measurement may be more
sensitive as a hydrogen embrittlement indicator than the simple HEE index based on NTS or RA ratio. In
reality, it is difficult to measure K
TH
accurately in gaseous hydrogen at high temperature and pressure set
up conditions. For material screening purpose, K
TH
values can also be used as the HEE Indexes according
to the ASTM-G129 test standard. There are two types of HEE Indexes based on the K
TH
ratios relative to
the fracture toughness K
IC
and K
C
:
1) Plane strain Threshold Stress Intensity Factor Ratio, HEE Index = K
I(TH)
/K
IC
Eq. (2.8.6)

75
2) Threshold Stress Intensity Factor Ratio, HEE Index = K
TH
/K
C
Eq. (2.8.7)
In these equations the values for K
I(TH)
and K
TH
are stress intensity factors measured in hydrogen for plane
strain and non-plane strain specimens, respectively. Accelerated test procedures for K
TH
measurement
have also been proposed in recent years to estimate the K
TH
values from a pre-cracked specimen, without
spending a considerable amount of time for the specimen to be under a constant static loading as baseline
in ASTM-E1681. These relatively rapid test procedures are proposed in terms of using a minute
incrementally rising load or displacement based on relatively slow strain rates (SSR) on the pre-cracked
specimens. Figure 2.8.3 shows the trend behavior of K
TH
values as a function of hydrogen pressure for
Inconel 718 and Incoloy 903 tested at room temperature [7].
Figure 2.8.3 Effects of hydrogen pressure on threshold stress intensity (K
TH
) for Inco 718 and 903.
Low Cycle & High Cycle Fatigue:
Gaseous hydrogen has a considerable effect on Low Cycle Fatigue (LCF) properties for susceptible
materials tested in strain-controlled mode. The hydrogen degradation in LCF life is also a function of
strain range as shown in Figure 2.8.4, for several power metallurgy (PM) superalloys tested at 75
0
F
(24°C) in 5 ksi (34.5 MPa) hydrogen pressure. In general, the lower the strain range the lower the effect
of hydrogen embrittlement degradation for LCF. By selecting a typical strain range from 1% - 2%, the
values for Cycles-to-Failure (CTF) obtained in hydrogen and in air can be compared to indicate the
severity of HEE. For example, at a strain range of 1.2%, typical CTF ratios for the PM superalloys, as
shown in Figure 2.8.4, are reduced nearly by a factor of 10 at room temperature. Because the CTF values
for fatigue testing are plotted on a log-scale, instead of using a linear scale similar to measuring the
notched tensile strength or reduction of area, the ratio of CTF, generally, is not used as the typical HEE
Index as specified in the ASTM-G129 test standard, which is based on a linear scale, with a ratio ranking
from 1 to 0. However, the trend behavior for hydrogen embrittlement based on LCF correlates
qualitatively well with the HEE Index values as shown in Table 2.8.3 for superalloys. In general, the
greatest reduction in LCF life ratio is also found to exhibit near room temperature for most superalloys,
while at cryogenic and at relatively high temperature the LCF properties are not as severely reduced,
similar to the HEE index trend lines for Inconel 718 as shown in Figure 2.8.2. Comparing the LCF data
against the data in Table 2.8.3, some superalloys such as Inconel 100, 718, 625, or Hastelloy-X, which
exhibit severe HEE in high hydrogen pressure at room temperature, are similarly affected in LCF tested in
0
25
50
75
100
0 50 100 150 200 250
K
TH ,
(MPa
-m
1/2
)
Hydrogen Pressure (MPa)
Inconel 718
Incoloy 903

76
strain-controlled mode at room temperature. It has been found that strain-controlled LCF test is more
sensitive to HEE than the one based on the load-controlled mode.
As a general rule, it has been observed that HEE has little effect on High Cycle Fatigue (HCF) properties
for many metallic materials. Typical HCF regimes are usually defined when the cycles-to-failure are at or
above the x10
6
cycles. Because the maximum stress amplitude stays significantly below yield strength
for HCF testing, it is possible that no significant HCF life degradation would be observed because the
majority of the test time involves in HCF testing is for crack initiation mode and not for crack
propagation mode under high cyclic loading at low stress level. HCF life is generally considered to be
around 90% for crack initiation and 10% for crack propagation. In addition, when testing HEE using
smooth tensile specimens, the most severe property degradation usually occurs when the specimens enter
the high plastic strain regions. In the elastic and low plastic strain region, the HEE effects are usually not
detected for smooth specimens. The explanation for this condition is somewhat similar to the axially
loaded, smooth HCF test specimens, when the loading is close to fatigue limit (cycles-to-failure near x10
6
cycles), where the strain range is usually very low.
Figure 2.8.4 Effects of hydrogen on strain controlled Low Cycle Fatigue (LCF) life of superalloys.
Crack Growth Rate:
The HEE effects for cyclic crack growth rates (da/dN) as a function of stress intensity factor range (∆K)
of several superalloys at 5 ksi (34.5 MPa) to 7 ksi (48.2 MPa) are shown in Figure 2.8.5 [7]. With the
exception for Mar-M-246 from conventional cast, which was tested at 538°C (1000°F), the most rapid
crack growth at room temperature was observed for Inconel 718 by the solution treated and aged (STA 2)
at a solutionizing temperature of 940°C (1725°F). Following Mar-M-246, the third fastest cyclic crack
growth rate is Inconel 718 in the labeled STA 1 heat treatment, which is solutionized at 1038°C (1900°F).
The least hydrogen embrittlement effect is with cast Inconel 718 in standard heat treat conditions.
Therefore, heat treatment can change the hydrogen embrittlement behaviors significantly for superalloys,
such as Inconel 718, which have complex microstructures. These crack growth rates are non-linear
curves and also plotted on a log-scale as a function of either K or ΔK values; therefore, these data are not

77
commonly used as HEE Index as specified in the ASTM-G129 test standard but can be used to conduct
damage tolerance analysis.
Figure 2.8.5 HEE effects for cyclic crack growth rates (da/dN) for several superalloys.
2.8.7 Controlling Factors in Hydrogen Embrittlement
Hydrogen Pressure
As hydrogen gas pressure increases, the susceptibility for hydrogen embrittlement is also increased,
resulting in the reduction of HEE Index. However, the HEE index seems to decrease exponentially until a
saturation pressure is reached. The decaying exponent in this relationship may reflect the kinetic effects
or rate limitations in the hydrogen embrittlement process as a function of pressure. High pressure
hydrogen gas has a direct influence on the HEE effects of materials. By reducing the hydrogen gas
pressure to below certain levels, susceptible materials will become less embrittled as compared to high
pressure. At a constant temperature, the influence of hydrogen gas pressure is qualitatively understood
based on the fact that high pressure hydrogen will increase the number of hydrogen atoms available per
unit volume; therefore, enhancing the localized HEE effects at the tip of a propagating crack. Figure 2.8.6
shows the effect of hydrogen pressure on HEE Index based on NTS ratio for several different superalloy
systems that include Nickel, Astroloy, Hastelloy X, Haynes 188, Rene 41 and Inco 718. Historically,
based on Sievert’s pressure-gas law for hydrogen concentration as a function of pressure, the degree of
hydrogen embrittlement was often assumed to be proportional to the square-root of the hydrogen
pressure; however, recent studies [9] have indicated that hydrogen embrittlement may indeed follow a

78
simple power-law relationship based on exponential function of hydrogen pressure instead of the square-
root of hydrogen pressure as shown below:
HEE Index = α. (P)
-n
Eq. (2.8.9)
where: α is a proportional constant, P is the hydrogen pressure at constant temperature, and n is the
material dependent and decaying exponential value, that indicates the embrittlement severity for that
particular material. It can be seen that when n = 0.50, this is just a special case for the “square-root” of
hydrogen pressure P as it was often assumed by early researchers based on Sievert’s pressure-gas law.
Figure 2.8.6 Effects of hydrogen pressure on HEE Index for superalloys at 22°C.
Operating Temperature
It has been observed that HEE can occur over a wide range of temperatures; however, it is most severe in
the vicinity of room temperature for many materials. Based on hydrogen trapping model, a hydrogen
trapping may be considered as the binding of hydrogen atoms to impurities, structure defects, or
microstructure constituents in the alloy. The binding of hydrogen in the “trapping-mechanism” model has
been proposed in order to explain as to why hydrogen embrittlement is most severe near room
temperature and becomes less severe or negligible at higher or lower temperature range. At lower
temperatures, the diffusivity of hydrogen is too sluggish to fill sufficient hydrogen traps, but at high
temperatures, hydrogen mobility is enhanced, and trapping is diminished. At high strain rates, fracture
may proceed without assistance of hydrogen, because the mobility of hydrogen is not sufficient to
maintain a hydrogen trapped atmosphere around moving dislocations. Figure 2.8.7 shows the hydrogen
embrittlement effect of several steels as a function of temperature [8]. It is found that many austenitic
stainless steels (Fe-Ni-Cr) are mostly sensitive to hydrogen embrittlement in the temperature range from -
150°C to +150°C.
For some superalloys, their HEE can occur over a wide range of temperatures from cryogenic to at least
800°C (1500°F), but it is most severe in the vicinity of room temperature. This is an important factor to
consider for safe design since superalloys are often chosen for high temperature applications. This
temperature effect for superalloys is unlike the austenitic stainless steels discussed above. For instance,
the most severe temperature for HEE Index, based on NTS ratio, occurs at 538°C (1000°F) for Astroloy,
Merl 76, Inco 100 and Waspaloy, as shown in Figure 2.8.8 [7]. Experimental data for nickel-based
Udimet 700 superalloy has shown that its extent of hydrogen embrittlement as a function of temperature

79
is far greater at high temperature, than for any other superalloy. At high temperatures more thermal
activation energy is available and there is a potential for the HRE effects from the chemical reaction of
hydrogen with certain superalloy constituents or impurities at the grain boundaries. The HRE type of
embrittlement can add to the HEE at high temperatures, but not at ambient temperature.
Figure 2.8.7 Effects of temperature on HEE index for selected steels.
Figure 2.8.8 Effects of temperature on HEE index for selected PM superalloys.
By selecting a proper operating temperature range, hydrogen embrittlement can be reduced for many
materials. In general, materials are less susceptible to HEE, IHE and even for HRE if the temperatures are
in the cryogenic range. At high temperatures, the HEE and IHE effects will also become less severe for
many materials. However, with materials that can form significant amounts of stable metal hydrides at
elevated temperatures, attention must be given to the HRE effects. Therefore, the HEE index near room
-273 -173 -73 26 126
(-460) (-280) (-100) (80) (260)
Test Temperature, C (F)
HEE Index, (Ratio of plastic elongation in H2/Air)
*Cathodically charged. ** Charged at 61 MPa and 500 C for 36 hrs.
Ϯ Charged with Deuterium at 69 MPa and 345 C for 3 weeks.
0.70
0.75
0.80
0.85
0.90
0.95
1.00
1.05
0 100 200 300 400 500 600 700 800
HEE Index (NTS ratio)
Temperature (°C)
Astroloy (PM)
MERL 76 (PM)
Inco 100 (PM)
Waspaloy (PM)

80
temperature should not be used to estimate the hydrogen embrittlement effects at high temperatures. This
is an important factor to consider for safe design since superalloys are often used for high temperature
applications. Testing must be conducted in the operating environment in order to accurately assess the
potential for hydrogen damage.
Reduction in Stress Levels
Reducing the operating stress level can be a viable method to prevent or control the hydrogen
embrittlement effects for most materials. This can be achieved by increasing the cross section of parts,
avoiding stress raiser in design, or simply reducing the load on the parts. The constant static loading is
usually considered to be more sensitive to hydrogen damage than cyclic or dynamic loading, particularly
at high cycle. It should be noted that this method of reducing the external loads is generally applicable to
HEE and to most IHE cases, but not necessary for all IHE cases because of the possible combination
effects of IHE and HRE. Reducing externally applied load will not help to alleviate HRE type of
embrittlement because the HRE effects can occur even in the absence of stress.
Residual stresses often develop in the metal during manufacturing processes such as heat treatment,
fabrication and welding. These stresses can be high and must be minimized. For wrought products,
fabricating methods such as forming, straightening, and stretching that involve localized plastic
deformation can exceed the elastic limit of the material due to high residual stress. For casting products,
because of the hot or molten metal shrinks as it cools, casting components or welding parts that are joined
into a more complex structure will have the tendency to have high residual stress. Residual stresses can
be reduced through thermal treatments such as annealing, preheating the parts before welding or post-
weld heat treatment. In addition, surface preparation techniques (such as low stress grinding) that would
impact residual compressive stress to the surface can be used to improve resistance to cracking due to
applied tensile stress.
References
1. J.A. Lee, “A Theory for Hydrogen Embrittlement of Transition Metals and Their Alloys,” In: Hydrogen Effects
in Materials, A.W. Thompson & N.R. Moody, (eds.), TMS publication, 1994.
2. J.A. Lee, “Effects of the Density of States on the Stacking Fault Energy and Hydrogen Embrittlement of
Transition Metals and Alloys,” In: Effects of Hydrogen on Materials, Proceedings of the 2008 International
Hydrogen Conference, B. Somerday, P. Sofronis, R. Jones (Eds.), pp. 678-685.
3. M.R. Louthan, G.R. Caskey, J.A. Donovan, D.E. Rawl, “Hydrogen Embrittlement of Metals”, Material Science
Engineering, Vol. 10, 1972, pp. 357-368.W.W. Gerberich, et al “A Coexistent View of Hydrogen Effects on
Mechanical Behavior of Crystals: HELP and HEDE”, In: Effects of Hydrogen on Materials, Proceedings of the
2008 International Hydrogen Conference, B. Somerday, P. Sofronis, R. Jones (Eds.), pp. 678-685.
4. ASTM G-129-00, “Standard Practice for Slow Strain Rate Testing to Evaluate the Susceptibility of Metallic
Materials to Environmentally Assisted Cracking,” Re-approved in 2006.
5. R.P. Jewett, R.J. Walter, W.T. Chandler, R.F. Frohmberg, “Hydrogen Environment Embrittlement of Metals,”
Rocketdyne, NASA Contractor Report, NASA-CR-2163, March 1973.
6. J.A. Lee, “Hydrogen Embrittlement of Superalloys,” in : Gaseous Hydrogen Embrittlement of Materials in
Energy Technologies: The Problem, Its Characterization and Effects on Particular Alloy Classes, Vol. 1, R.P.
Gangloff, B. Somerday (Eds.), Woodhead Publishing Limited, December 2011.
7. J. A. Lee., “Hydrogen Embrittlement”, In: AIAA Guide to Safety of Hydrogen and Hydrogen Systems,
American National Standard, ANSI/AIAA, G-095-2004, New Revision for 2012.
8. J.A. Lee, “Empirical Method to Predict Hydrogen Embrittlement of Metals by High Pressure Hydrogen Gas at
Constant Temperature,” presentation given at the ENERGY 2010 Conference, Sponsored by the American
Ceramic Society, Cocoa Beach, Florida, 2010.
9. ? (p. 76)

81
2.9 Material Behavior in Oxygen-Rich Environments
Samuel Edgar Davis, NASA Marshall Space Flight Center
2.9.1. Introduction
Oxygen (O
2
) is a pale blue odorless and tasteless gas at ambient temperatures. It can also can also exist in
a liquid state at temperatures below -183°C (-297°F) and as a solid below -219°C (-362°F). Oxygen
comprises 20.9% of Earth’s atmosphere and exists primarily in the form of O
2
molecules. Gas turbine
engines draw oxygen from the atmosphere to burn fuel to generate power. Oxygen in its liquid state is
important to the aerospace industry because it is used as a rocket propellant usually in combination with
hydrogen or hydrocarbon as fuel. Liquid oxygen is easily stored, easily transferred from one tank to
another, and is readily converted to gaseous oxygen. Oxygen can readily react with metallic materials to
produce metal oxide, which is usually a highly exothermic reaction. The highly reactive nature of oxygen
requires that special care must be taken when using it in order to ensure the safety of personnel and
equipment. Materials that do not burn in normal atmosphere can burn violently in pure oxygen,
sometimes to the point of explosion. Material selection in oxygen systems must be done with care with
system safety in mind.
The hazards inherent in the oxygen system come primarily from the risk of fires and/or explosions. The
standard fire triangle (Figure 2.9.1) demonstrates that a fire requires three separate and independent
components, represented as legs of the triangle. The three component legs are fuel, oxidizer and ignition
source. The oxidizer system obviously has the oxidizer leg, but the hardware material itself can actually
become the fuel! The pressures and energies generated by fluid flow in a rocket propulsion system are
quite high. For example, the space shuttle liquid engine burns more than 1,000 pounds-per-second (454
kg/s) of propellant, and must have systems that can pump this volume. The large volumes of oxygen
usage can cause the valve and seal materials, seat materials, and sometimes even the metallic materials to
become fuels for combustion.
Fuel
Oxidizer
Figure 2.9.1: The Fire Triangle
This section focuses on material behavior in oxygen systems and some of the hazards of the oxidizer in
propulsion systems and the means by which these hazards can be mitigated.
2.9.2. Examples of oxygen hazards
Designers, engineers, and technicians sometimes fail to recognize how dangerous oxygen-enriched
systems can be, which can lead to disastrous consequences. A few examples of NASA-related oxygen
events and their consequences are described below.
1. Apollo 2 – Three astronauts were killed by a fire in the command module. The cause of the fire was
determined to be related to an electrical wire shortage that occurred after the module was filled with an
oxygen-rich mixture. A short in the electrical circuit caused the wire insulation to ignite which, in turn,
ignited other materials. The burning materials rapidly engulfed the module. It happened so quickly that
σ

82
the astronauts could not escape. The materials that burned rapidly in the oxygen atmosphere of Apollo 2
were actually safe to use in air. [Report of Apollo 2 Review Board, NASA Historical Reference
Collection, NASA History Division at NASA Headquarters]
2. Space Shuttle Extravehicular Mobility Unit – An early design of the Space Shuttle Extravehicular
Mobility Unit, better known as the spacesuits worn for spacewalks, ignited during a laboratory test. This
suit was the selected design that was to be manufactured and worn by the shuttle astronauts. The
circumstances of the event seemed benign. A spacesuit design was being tested on a laboratory table and
oxygen began to flow into the suit in the manner it would when an astronaut is wearing the suit in space.
Suddenly, a flash fire occurred as the technicians were standing next to the suit. The fire resulted from
oxygen flowing against an aluminum regulator which caught fire. This fire resulted in no serious
personnel injuries, but a better spacesuit had to be designed and developed at a high additional cost.
3. Apollo 13 – This oxygen system event is the most significant oxygen related event that happened to a
spacecraft out in deep space. Two oxygen storage tanks were severely damaged, and the astronaut lives
almost lost, when activation of the stirring motor in the oxygen system led to an explosion. The cause of
this fire was a damaged electrical contact on the stirring motor. This damage had actually happened prior
to launch, but was undetected until the explosion. [Information courtesy of NASA – Goddard Space
Flight Center]
2.9.3. Testing of materials for oxygen compatibility
Mechanical Impact Test
Testing is about the only way to select materials that are safe for use in oxygen systems. However, there
is no single decisive test or evaluation method that will clearly lead to the selection of most appropriate
materials for use in a given system. Several test techniques have been developed to help determine which
materials will be safer in oxygen applications on a relative basis. These tests fall into two categories: 1)
ignition tests to determine how easily a material ignites, and 2) burn tests to quantify the burn severity
after ignition. Ambient Pressure Liquid Oxygen Mechanical Impact Test is the oldest test developed in
the early days of NASA and is still in use today. It involves dropping a metal plummet onto a disk of the
material that is immersed in liquid oxygen. Materials that are very incompatible with oxygen will burn,
or even explode, when the energy from the falling plummet is transferred to the sample. This burn, called
a reaction, is witnessed by the test operator. The reaction can be a visible flash, audible report,
appearance of charring on the surface of the sample, or combination of these. Figure 2.9.2A shows a
schematic of the test fixture section where the plummet will strike the material sample. Figure 2.9.2B
shows a severe reaction with a material that is not compatible with liquid oxygen.
After several years of oxygen systems operations, it was realized that the ambient pressure mechanical
impact test, in fact, did not adequately address elevated pressure scenarios because a few materials that
passed the test at ambient pressure were burning in high-pressure oxygen systems. In response, the tester
was modified to perform the mechanical impacts in high-pressure oxygen. This new tester, the High
Pressure Liquid and Gaseous Oxygen Mechanical Impact Tester, performs impact testing at pressures up
to 10,000 psi (68,948 kPa). The new tester works basically the same way as the ambient pressure tester,
except that this test fixture seals a head onto a base in order to hold the elevated test pressure (Figure
2.9.2). This tester was later modified to test materials in gaseous oxygen and also at elevated
temperatures.
The Mechanical Impact Test was used by NASA as the standard test for materials in oxygen systems for
years. However, inspection of materials that burned in high-pressure oxygen systems revealed that this
test alone was also not sufficient. The test provided very useful data for applications where actual

83
impacts occurred within the system, such as a
valve shutting against a valve seat. The test did not, however, provide useful information for other
ignition scenarios. Furthermore, the Mechanical Impact test also did not distinguish the metals that were
very compatible with oxygen and those that were marginally compatible. In order to provide more useful
data, several new test methods were developed.
A. Test fixture schematic B. Test showing reaction
Figure 2.9.2 Ambient Pressure Liquid Oxygen Mechanical Impact Test
Figure 2.9.3 High Pressure Mechanical Impact Tester
Promoted Ignition test

84
The Promoted Ignition Test, or Combustion of Materials in Oxygen test (Figure 2.9.4) has now become
the new baseline standard for determining if a material is safe in an oxygen environment. This test uses a
1/8-inch (3.2mm) diameter, 12-inch long (30cm) rod of the candidate material hanging vertically in a test
chamber. The sample material rod is ignited at the bottom by an aluminum or magnesium promoter. The
rod is surrounded by a gaseous oxygen environment at the highest pressure to which the material could be
subjected in its actual use conditions. The promoter is initiated and the sample rod is observed for its
burn characteristics, primarily its burn length and burn rate. If the sample burns more than 1.2 inches (30
mm) it is considered sustained burn. Samples that burn more than this are considered unacceptable for
unrestricted use in an oxygen system at the test pressure. However, restricted use of that material can still
be allowed under certain circumstances, which will be discussed later in this section.
Figure 2.9.4 Promoted Ignition Test Fixture Schematic

85
Figure 2.9.5 Elevated Temperature Promoted Ignition Tester at MSFC
With Sample Rod in Heating Coil
The tester can be modified to heat the rod sample to study burn resistance at elevated temperatures –
called Elevated Temperature Promoted Ignition Tester. A photograph of a sample being loaded into the
MSFC Elevated Temperature Promoted Ignition Tester is shown in Figure 2.9.5.
Ignition Data for Metallic Materials
The Mechanical Impact and the Promoted Ignition Tests provide the pressures at which a given material
will ignite or burn. However, the two tests provide significantly different values for the lowest pressures
at which a material will burn in oxygen (called threshold pressure). The determination as to which test is
more valuable depends upon the type of material being tested and the application. The Promoted Ignition
Test is more valuable for metals and materials that will form the basic load bearing structure of the
system. The Mechanical Impact Test is more valuable for nonmetals and for seal or seat materials that
will actually be subjected to impact loads during normal system operations.
Table 2.9.1: Minimum Pressures Required to Ignite or Burn Common
Metals as Determined by Promoted Ignition Test and Mechanical Impact Test
a
Material
Promoted Ignition
Test- threshold
pressure for sustained
burning –psi (kPa)
Mechanical impact test –threshold pressure for
ignition – psi (kPa)
Environment
GOX
GOX
LOX
2024 Al
15 (103)
1,500 (10342)
1,500 (10342)
2090 Al
15 (103)
500 (3447)
500 (3447)
2219 Al
15 (103)
1500 (10342)
50 (345)
5052 Al
15 (103)
1500 (10342)
50 (345)
6061 Al
15 (103)
15 (103)
15 (103)
Brass
10,000 (68948)
10,000 (68948)
10,000 (68948)
Copper 12200
10,000 (68948)
10,000 (68948)
10,000 (68948)
Haynes 214
1,000 (6895)
10,000 (68948)
10,000 (68948)
Inconel 718
500 (3447)
10,000 (68948)
10,000 (68948)
Magnesium
<15 (103)
<15 (103)
<15 (103)
Monel K-
400/K-500
10,000 (68948)
10,000 (68948)
10,000 (68948)
Nickel
10,000 (68948)
10,000 (68948)
10,000 (68948)
SS 17-4
400 (2758)
5,000 (34474)
5,000 (34474)
SS 304
500 (3447)
10,000 (68948)
10,000 (68948)
SS 304L
250 (1724)
10,000 (68948)
10,000 (68948)
SS 316
400 (2758)
10,000 (68948)
10,000 (68948)
SS 316L
250 (1724)
10,000 (68948)
10,000 (68948)
SS 420
750 (5171)
10,000 (68948)
10,000 (68948)
SS 440C
3,000 (20684)
10,000 (68948)
10,000 (68948)
Titanium
<15 (103)
<15 (103)
<15 (103)
a
Data for comparison purposes only, not to be considered standard values for listed material
Table 2.9.1 provides summaries of test data generated by the NASA – MSFC (George C. Marshall Space
Flight Center) for common metallic materials in both of these tests. The data clearly show that the
threshold pressure for a given material in Promoted Ignition test is much lower than the threshold pressure
in a mechanical impact test. It should be noted that most of these materials tend to have occasional test

86
series in which they do ignite at a lower pressure than listed. These are exceptions which indicate that a
specific lot or batch of material must be tested in order to eliminate the hazards of lot and batch
composition variability.
The Promoted Ignition Test is a harsh test and is not a perfect test for materials in oxygen environments
and hence the test data should be applied with caution. A vast majority of materials that are commonly
used in oxygen systems, viz., stainless steel (SS) alloys, do not meet this criterion at high pressures.
Therefore, a more realistic hazards evaluation process for allowing such materials has been developed.
This process is called Oxygen Compatibility Assessment, which will be discussed later in this section.
2.9.4 Combustion Probability and Severity for Materials in Oxygen Systems
The ignition and combustion properties of materials can vary from one oxygen system to another. There
are several factors that determine ignition probability and fire severity in an oxygen system. The most
important factors that significantly increase both the probability of ignition and the severity of the fire that
ensues are oxygen pressure and temperature. The data in Table 2.9.2 shows the pressure effects on the
burning rate of metals. Combustible metals, with few exceptions, burn far more readily and rapidly in
higher pressure oxygen environments.
Table 2.9.2: Upward Flammability of Metals versus Pressure in 100% Oxygen
a,b,c
Material
Test Pressure
12-inch (305 mm) Rod
Burn Length
Burn Rate
in/sec (mm/sec)
Bronze/Aluminum
Mixture
50 psi (345 kPa)
100 (689 kPa)
0” (0 mm)
12” (305 mm)
0.0 (0.0)
0.3 (7.6)
Aluminum 4043
25 psi (172 kPa)
50 psi (345 kPa)
4.4” (111.8 mm)
12” (305 mm)
0.6 (15.2)
1.1 (27.9)
316 Stainless Steel
500 psi (3447 kPa)
1,000 psi (6895 kPa)
1.7” (43.2 mm)
12” (305 mm)
0.3 (7.6)
0.4 (10.2)
347 Stainless Steel
500 psi (3447 kPa)
650 psi (4482 kPa)
3,000 psi (20684 kPa)
2.7” (68.6 mm)
8” (203 mm)
12” (305 mm)
0.3 (7.6)
0.4 (10.2)
0.5 (12.7)
304 Stainless Steel
500 psi (3447 kPa)
1,000 psi (6895 kPa)
3.8” (96.5 mm)
12” (305 mm)
0.3 (7.6)
0.4 (10.2)
303 Stainless Steel
500 psi (3447 kPa)
1,500 psi (10342 kPa)
1.1” (27.9 mm)
12” (305 mm)
0.3 (7.6)
0.4 (10.2)
316L Stainless Steel
250 psi (1724 kPa)
1,000 psi (6895 kPa)
2.6” (66.0 mm)
12” (305 mm)
0.2 (5.1)
0.4 (10.2)
a
Data for pressure effects comparison only, not to be considered standard values for listed material
b
Data based upon rods tested per ASTM G-124 and ISO14624-4 with rod dimensions 12” length, 0.125”
diameter
c
Data derived from testing at the NASA – MSFC
Temperature effects on combustible materials, with very few exceptions, are analogous to pressure affects
in that materials burn far more readily and rapidly in a gaseous oxygen environment as the temperature is

87
increased, see Table 2.9.3. It should be noted that temperatures can increase substantially within a system
during normal operation. For instance, adiabatic heating and frictional heating within the system can raise
the oxygen temperature and cause ignition followed by combustion. Although liquid oxygen is much
colder than gaseous oxygen, many materials tend to be more reactive and burn more readily in liquid
oxygen systems. This result is attributed to the fact that liquid oxygen has more oxygen molecules per
unit volume (higher density).
Table 2.9.3: Upward Flammability of Metals versus Temperature in 100% Oxygen
a,b,c
.
Material
Identification
Test Pressure
psi (kPa)
Test
Temperature
12” Rod Average
Burn Length
Burn Rate
in/sec (mm/sec)
304L Stainless
Steel
500 (3447)
500 (3447)
75 °F (297 °K)
1,000 °F (811 °K)
4” (102 mm)
12” (305 mm)
0.35 (8.9)
0.43 (10.9)
15-5 PH Stainless
Steel
500 (3447)
500 (3447)
75 °F (297 °K)
1,000 °F (811 °K)
2.9” (74 mm)
12” (305 mm)
0.33 (8.4)
0.35 (8.9)
Inconel™ 718
750 (5171)
750 (5171)
75 °F (297 °K)
1,700 °F (1200°K)
4.2” (107 mm)
12” (305 mm)
0.35 (8.9)
0.60 (15.2)
316 Stainless Steel
500 (3447)
500 (3447)
75 °F (297 °K)
1,000 °F (811°K)
5.6” (142 mm)
12” (305 mm)
0.34 (8.6)
0.37 (9.4)
a
Data for temperature effects comparison only, not to be considered standard values for listed material
b
Data based upon rods tested per ASTM G-124 and ISO14624-4 with rod dimensions 12” length, 0.125”
diameter
c
Data derived from testing at the NASA – MSFC (George C. Marshall Space Flight Center)
The data presented here demonstrate that fire hazards are far greater in systems with higher pressures and
temperatures than experienced in normal atmospheric conditions. Oxygen system designers can minimize
the dangers that are inherent in oxygen systems by using certain techniques that are discussed in detail
next.
2.9.5 Fire safety in oxygen systems design
Designers of oxygen systems look for ignition and burn resistance properties in materials to minimize the
risk of fire. In general, the higher the oxygen pressure and temperature the materials are exposed to, the
more readily they ignite and burn. So, the designer should use the lowest possible operating pressure and
temperature. Thinner sections ignite and burn more readily than thicker sections and so thicker sections
should be preferred. In addition there are systemic effects that contribute to fire hazards. For instance, the
higher the flow rates of oxygen passing over a material, the higher is the likelihood of the material
igniting and burning in the direction of the flow. Therefore, flow rates within the system should be kept as
low as possible. The recommended practice for the design and development of safer oxygen systems
include the following:
- Minimize oxygen and combustible materials within the system
- Maximize the use of the burn-resistant materials
- Configuration control
- Minimize the potential ignition sources that are inherent in all systems.
Each practice is described in detail.

88
Minimize Oxygen and Combustible Materials
The safest systems will minimize the amount of oxygen in the system, which reduces the likelihood of
ignition, and allows for quenching in case a fire. This can be accomplished by keeping the system
pressure at no higher than absolutely necessary, using the smallest amount of oxygen needed for the
application, and by designing the system such that the flow path for oxygen is shortest possible. The
safest oxygen systems will also minimize the amount of combustible materials within the system, thus
providing less fuel available to burn. At the same time it should be noted, however, that thicker sections
of a material are far less likely to ignite than thinner sections. Therefore, the ignition hazard of a material
must be weighed against the safety of utilizing less material within a system.
Maximize the use of oxygen compatible materials
Poor material choices can greatly increase the likelihood of a fire occurring in an oxygen system.
Therefore, careful selection of materials can lessen the chances of ignition and promoted combustion, thus
limiting the amount of damage resulting from a potential fire. Despite the fact that heat sources can be
inherent to an oxygen system or its surroundings, design elements can limit the amount, or dissipate
altogether, the heat generated within the system. After meeting the functional requirements the selected
materials must be compatible with the system oxygen environment and not undergo any dangerous
reaction. The best materials for oxygen environments, from a compatibility standpoint should be a)
difficult to ignite, b) self-extinguish quickly if ignited, and c) burn slowly with low heat-of-combustion.
These properties are determined by testing. Extensive test data generated by the government and private
industries already exist and is available for use. However, newer materials, and even some older ones,
have no test data. Therefore, it is important to generate the required test data for the desired materials. A
word of caution is necessary here. When designers do not have the test data on a material of interest, they
sometimes tend to predict these properties by “similarity” to other materials whose properties are known.
This approach is risky since even small composition variations can drastically change the oxygen
compatibility of a material.
Due to their mechanical strength, a vast majority of the materials in oxygen systems will be metallic.
Typically, the structural materials are metallic, with nonmetals only being designed into the systems as
valve seals and seats, lubricants, or other places where rigid materials cannot be used. Fortunately, metals
are generally more compatible with oxygen than nonmetals. Unfortunately, metals become more
incompatible with oxygen as the pressures within the system increase. Furthermore, metals tend to burn
much more violently, burn for longer durations, and burn at much higher temperatures than nonmetals.
Therefore, proper selection of metals for specific applications is critical. No single metal or alloy is best
suited for all applications. The test data provided in Table 3.9.2 and Table 3.9.4 clearly show that many
materials will work well in oxygen systems, and many others will not and should be avoided. The
designer must choose the best materials by considering all of the factors involved, including oxygen
compatibility under use conditions. The materials that are most oxygen compatible include nickel alloys,
copper, brass and bronze. The metals that are more easily ignited, and should be avoided, include
magnesium, titanium and aluminum alloys. The maximum use pressure within the system will drive the
material choices.
Configuration control
The energy required to ignite a material or sustain its burning is not a fixed value but is influenced by
several factors. The amount of energy required to ignite a material, as measured by the minimum
temperature and pressure at which it will ignite, is determined by the thickness of the material, the shape
of the part produced by the material, and the surface configuration.

89
The flammability of a metal is strongly influenced by its configuration -- size and shape of the part. Solid
metals are the most resistant to ignition and burn the least if ignited. Metal parts with large surface areas
will burn more easily than those with smaller surface area. If a metal tube and a metal rod of the same
material and diameter are tested, the tube will ignite more easily. Metal mesh materials, such as filter
materials, are the easiest of all configurations to ignite. For example, a 316 stainless steel rod will not
ignite until the pressure is generally more than 400 psi (2758 kPa), but a 316 stainless steel mesh filter
material shaped into a rod of the same dimensions will ignite in oxygen below atmospheric pressure!
Stainless steels are used extensively in high-pressure oxygen systems even though they are flammable
under these pressures by making them hard to ignite. Oxygen system components for high-pressure
applications typically have very think walls to withstand the stress. This thickness is also advantageous
for ignition resistance. The data in Table 2.9.2, for Promoted Ignition Test shows the flammability of a
1/8-inch (3.2 mm) diameter rod. If the thickness of the metal is higher than this, then the minimum
pressure required to ignite the metal will also be higher.
Minimize Ignition Sources and Mechanisms
An ideal oxygen system will have nothing inside that could create an ignition potential. There would be
no contaminant, no floating debris, no metal shavings from pipe threading, and only pure, clean oxygen
entering into the system. In reality however, ignition sources do exist and therefore, steps must be taken
to minimize the effects of the ignition sources and mechanisms that will certainly find their way into the
system. Ignition sources are materials that can ignite within an oxygen system and in turn, spread the
burning to other parts or materials. The most common ignition sources are contaminants in the system.
The contaminant particles are typically incompatible with the oxygen and can ignite even under ideal
system operations. Ignition mechanisms are processes by which ignition may occur within the system
even in the absence of an outside ignition source. These mechanisms usually result from improper system
designs that allow sufficient energy to cause an ignition event to occur in the system. The safest oxygen
systems are designed to mitigate the ignition hazards that are evaluated by the following questions: (1)
Which ignition sources could be present in the system? (2) Which ignition mechanisms could be present?
(3) What is the severity of the hazards produced? (4) What hazards could surface from the worst-case
scenario, such as any danger to humans or systems?
Several ignition sources and mechanisms have been determined by oxygen system users after many years
of failure investigations. The list, provided below, is not complete but does represent the most common
ignition sources and mechanisms:
(1) Contamination (FOD) (9) External Hazards (less common)
(2) Particle impact (a) Lightening
(3) Rapid pressurization (b) Welding on Hardware
(4) Mechanical impact (c) Fires in Vicinity
(5) Friction (d) Vehicular Impact
(6) Static discharge (e) Static Discharge
(7) Electrical arc (f) Weather Damage
(8) External heat
The reference [20]: NASA/TM-2007-213740 gives the details of these ignition sources and mechanisms. A
few selected topics are discussed below.
A contaminant is any foreign particle or debris that enters into a system and that can come into contact
with oxygen. Aerospace system workers commonly use the acronym FOD, or foreign object debris, when
referring to contaminants within a system. FOD is the most common ignition source and is probably the
most dreaded term to an oxygen system user or designer. Contamination entering the system typically

90
comes from one of the following, listed in no particular order: (1) Dirt and other debris entering the
system during assembly. (2) Excess lubricants that leak from threading. (3) Metal flakes that emanate
from the pipe threading during assembly. (4) Particles brought into the system in impure oxygen. (5)
Particulates that emanate from within the system, such as by a breakdown of seals, flaking of vessel
plating, valve friction shearing metal pieces, etc. (6) Hand tools, writing instruments, articles of clothing,
etc. that have been dropped into the system by workers. Even the most careful assembly and quality
controls cannot prevent every contaminant, only lessen the frequency.
The particle impact ignition mechanism involves heat being generated by a particle striking the surface of
another material with a velocity that will generate sufficient heat to ignite the particle or the material.
This particle can be introduced during the assembly of the system, or by one released during system
operation. This ignition mechanism generally requires a metal particle and metal surface to strike. Figure
2.9.5 shows one particle impact ignition scenario. The particle impact ignition hazard can be mitigated by
several strategies, including: (1) Oxygen system components must be specifically cleaned for oxygen
service and must be assembled using clean techniques in order to lessen the chances of outside particles
entering the system. (2) Pipe threading must be done with care so not to release particles. (3) Internal
filter elements can be used for trapping particles, thus preventing them from flowing downstream and
impacting highly flammable materials. (4) Oxygen flow rate should be regulated down to the lowest
tolerable level, preferably less than the particle impact threshold limit. (5) Systems must be designed to
produce flow paths that have minimal points where particles can strike at severe angles. (6) Components
that can generate particles, such as rotating valves, sliding parts, etc. must be minimized.
Figure 2.9.5 Particle Impact Ignition Could Result from a Particle Striking a Flammable Part of a Valve –
Note the Orifice Accelerating the Particle Increasing Ignition Probability [20]
The rapid pressurization, also known as heat-of-compression or adiabatic compression, ignition
mechanism involves extreme heat generated by the oxygen gas itself undergoing pressurization. The
Ideal Gas Law and thermodynamic equations for an adiabatic process, i.e., no heat loss, demonstrate that
if the oxygen gas pressure increases rapidly then the gas temperature increases (under adiabatic
conditions), sometimes beyond the ignition point of the materials. Figure 2.9.6 illustrates this mechanism
in a system. Polymeric materials are more readily ignited in this way than metallic materials.

91
Figure 2.9.6 Rapid Pressurization Ignition Results from Rapidly Compressing Oxygen against the
Nonmetal [20]
Rapid pressurization ignition potential must be minimized in oxygen systems by good design practices.
The most important design practices include: (1) limiting pressurization rates, (2) minimizing the amount
of nonmetals, including contaminants, in areas affected by pressurization, (3) burying nonmetals behind
metal parts in the flow path, and (4) not compressing oxygen in the vicinity of soft goods, such as
exposed valve seats or lubricants. A good practice sometimes involves utilizing devices that can slow the
oxygen flow within the system, such as filter elements and various types of meters.
The mechanical impact ignition mechanism involves heat energy generated when two objects collide.
There are numerous collisions that occur with the normal operation of an oxygen system. Collisions such
as valves closing are designed into the system. However, collisions sometimes occur with large pieces of
contaminant debris or by parts of the system breaking free. Both of these sources of mechanical impact
must be mitigated when designing oxygen systems. Figure 2.9.7 shows a mechanical impact ignition
hazard that has resulted in a number of fires during an oxygen transfer process.
Figure 2.9.7 Mechanical impact Ignition Results from a Wrench Falling onto an Asphalt Pad Covered in
Liquid Oxygen [20]
The friction ignition mechanism involves the heat energy generated when two objects rub together.
Friction ignition can occur if three factors are present: (1) Two metals are rubbing together. (2) The
rubbing must be at a high speed in order to generate enough heat to ignite one of the metals. (3) The

92
metals must be exposed to high loads, i.e., press together with enough force to make the rubbing severe.
Figure 2.9.8 illustrates a condition in which friction ignition can occur in an oxygen system.
Figure 2.9.8 Frictional Ignition Occurs Due to Damaged or Worn Soft Goods Resulting in Metal to Metal
Rubbing [203]
Some components, such as check valves, regulators, and relief valves, may become unstable and chatter
during use. Chattering can result in rapid oscillation of the moving parts within these components,
creating a friction ignition hazard. For example, damaged or worn soft goods can result in metal-to-metal
rubbing between the piston and the cylinder of a reciprocating compressor that could lead to frictional
ignition. The friction ignition hazard should be minimized by avoiding the rubbing together of two
metals parts, or by slowing the rate at which they rub.
Importance of Appropriate Cleaning
The most important factor in the safe use of any oxygen system is appropriate cleaning to remove
contaminants that are a potentially hazardous ignition source. Contaminant particles are easily ignited and
can also accumulate to dangerous levels. The following are keys to having clean oxygen systems:
- Use only oxygen system approved cleaning agents and techniques.
- Clean all parts prior to system assembly.
- Minimize the number of different materials used for assembly, such as seal materials, lubricants, etc.
(This will allow the assembler to more quickly notice an incorrect material.)
- Visually inspect all components before assembly and reject any component that does not appear to be
100% visually clean.
- Be extremely cautious of vendor supplied parts that are listed as “oxygen compatible.” It is highly
recommended that the vendor claim is independently verified or the part is rebuilt using oxygen
compatible materials.
- Protect clean parts from contamination by keeping them covered until assembly, and assembling as
many parts as possible in a clean area.
- Assemble carefully so that two surfaces rubbing together will not generate particulates that can enter the
system.
- Use lubricants only when absolutely necessary, and ensure that the lubricants are oxygen compatible.
Use the smallest amount of lubricant allowable.
- Ensure that verification testing of the cleanliness level has been performed and that the cleanliness level
is within the predetermined tolerance.
- Ensure that vent lines are guarded against contaminants entering the system from the outside.
- Use an inert gas to blow through the system in order to remove any stray particles prior to oxygen being
introduced.

93
NASA requires that all aerospace components that will contact oxygen be cleaned to meet stringent
requirements, as called out in MSFC-SPEC-164C, and other NASA documents.
2.9.6 Oxygen Compatibility Assessment
The safety of propulsion oxygen systems is especially critical because of the complexity and extreme
pressures required to create the oxidizer side of a propulsion system. In order to elevate the safety of the
propulsion oxygen systems, a process tool called an Oxygen Compatibility Assessment, or OCA, has
been developed, which is a Hazards Analysis for oxygen systems. More details on an OCA can be found
in NASA publication NASA TM-213740, mentioned earlier. Industries that evaluate oxygen system
safety have adopted evaluation methods very similar to those used by NASA.
The Oxygen Compatibility Assessment is a tool that provides a step-by-step procedure for assessing the
risks associated with an oxygen system. The OCA is a stepwise approach that uses the system materials
list, drawings of components, and system operating conditions to proceed through a structured risk
assessment. The OCA helps prevent some areas from being overlooked while providing a structural
approach to any necessary remedies. An oxygen system designer will find that the OCA helps outline the
known hazards that may be present, suggests areas that need further review, and provides safety
improvement strategies. The basic steps involved in this process are listed below:
(1) Determine the worst case operating conditions at each point within the system
(2) Assessing the flammability of the oxygen-wetted materials at their “worst case” conditions
(3) Evaluating potential ignition mechanisms and determining their probability of occurrence
(4) Evaluating any kindling chain within the system, and determining the most severe possible affects
(5) Determining the reaction effects, i.e., the severity of the worst potential outcome of a hazard,
including human casualty, equipment destruction, etc.
(6) Compiling the list of hazards and determining methods of correcting the hazards
(7) Documenting the results for each hazard or component
(8) Providing required modifications and recommendations for system improvement
(9) Providing limitations of the assessment
(10) Determining the safety of the system if it is built exactly as it is designed
An Oxygen Compatibility Assessment will not be necessary in cases where all of the materials used
within the system are oxygen compatible at the maximum use temperature and pressure of the system.
This approach has been tried but it allowed very few materials to be used and almost all of the systems
turned out to be extremely heavy. The desire to allow a wider selection of materials, especially lighter
weight materials, necessitated the development of the OCA tool.
NASA has provided the following important resources to individuals who are interested in doing work
related to oxygen system safety: (1) The NASA technical publication NASA TM-213740, Guide for
Oxygen Compatibility Assessments on Oxygen Components and Systems. This publication is a good
starting point for performing an Oxygen Compatibility Assessment. (2) The NASA Materials and
Processes Technical Information System (MAPTIS) database. This database houses the most current, and
most extensive, data and information related to aerospace materials. Literally, tens-of-thousands of pages
of materials information are contained within the database. MAPTIS provides materials information for
most aerospace vehicle applications, not just oxidizer systems.

94
References
The information provided in this chapter is only an introduction to the topic of oxygen system materials
behavior and safe system design. More information is required for a proper design of a complex oxygen
system. The following is a list of useful references on the subject. They are publically available and found
through most internet search engines.
1. NASA Materials and Processes Technical Information System (MAPTIS.) This is the official NASA
materials database, which houses volumes of materials data, including oxygen compatibility information
and data. This database is useful to the experienced oxygen system designer, but not as much to the new
designer. It can be found at http://maptis.nasa.gov.
2. NASA-STD-6016, Standard Materials and Processes Requirements for Spacecraft. This document
provides a more in-depth discussion of material selection for NASA missions.
3. NASA-STD-6001, Flammability, Offgassing, and Compatibility Requirements and Test Procedures.
As was mentioned earlier in this chapter, materials must be tested to ensure that they can be used safely in
oxygen systems. This NASA standard provides the test methods that NASA utilizes to determine if a
material is acceptable for use on a NASA mission, including those used in oxygen systems.
4. ASTM Manual 36, Safe Use of Oxygen and Oxygen Systems: Handbook for Design, Operation, and
Maintenance. This manual is the most comprehensive reference source for materials used in oxygen
systems.
Additional References (listed in alphabetical order)
1. ASTM D 2512, Standard Test Method for Compatibility of Materials with Liquid Oxygen, ASTM International,
100 Barr Harbor Drive, West Conshohocken, PA 19428-2959
2. ASTM G 74, Standard Test Method for Ignition Sensitivity of Materials to Gaseous Fluid Impact, ASTM
International, 100 Barr Harbor Drive, West Conshohocken, PA 19428-2959
3. ASTM G 86, Standard Test Method for Determining Ignition Sensitivity of Materials to Mechanical Impact in
Ambient Liquid Oxygen and Pressurized Liquid and Gaseous Oxygen Environments, ASTM International, 100 Barr
Harbor Drive, West Conshohocken, PA 19428-2959
4. ASTM G 124, Standard Test Method for Determining the Burning Behavior of Metallic Materials in Oxygen-
Enriched Atmospheres, ASTM International, 100 Barr Harbor Drive, West Conshohocken, PA 19428-2959
5. ASTM G 128, Standard Guide for Control of Hazards and Risks in Oxygen Enriched Systems, ASTM
International, 100 Barr Harbor Drive, West Conshohocken, PA 19428-2959
6. ASTM G 145, Standard Guide for Studying Fire Incidents in Oxygen Systems, ASTM International, 100 Barr
Harbor Drive, West Conshohocken, PA 19428-2959
7. ASTM Manual 36 (MNL36), Safe Use of Oxygen and Oxygen Systems: Handbook for Design, Operation, and
Maintenance, ASTM International, 100 Barr Harbor Drive, West Conshohocken, PA 19428-2959
8. CGA G-4, Oxygen, Compressed Gas Association, Inc., 4221 Walney road, 5
th
Floor, Chantilly, VA 20151, email:
9. CGA G-4.1, Cleaning Equipment for Oxygen Service, Compressed Gas Association, Inc., 4221 Walney road, 5
th
Floor, Chantilly, VA 20151, email: cga@cganet.com
10. ISO 14624-4, Space Systems – Safety and Compatibility of Materials – Part 4: Determination of upward
flammability of materials in pressurized gaseous oxygen or oxygen-enriched environments, International
Organization for Standardization, 1, ch. de la Voie-Creuse, CP 56, CH-1211 Geneva 20, Switzerland, email
11. ISO 15859-1, Space Systems – Fluid characteristics, sampling and test methods – Part 1: Oxygen, International
Organization for Standardization, 1, ch. de la Voie-Creuse, CP 56, CH-1211 Geneva 20, Switzerland, email
12. ISO 22538-1, Space Systems – Oxygen Safety, Part 1: Design of oxygen systems and components, International
Organization for Standardization, 1, ch. de la Voie-Creuse, CP 56, CH-1211 Geneva 20, Switzerland, email

95
13. ISO 22538-2, Space Systems – Oxygen Safety, Part 2: Selection of metallic materials for oxygen systems and
components, International Organization for Standardization, 1, ch. de la Voie-Creuse, CP 56, CH-1211 Geneva 20,
Switzerland, email [email protected]g
14. ISO 22538-3, Space Systems – Oxygen Safety, Part 3: Selection of non-metallic materials for oxygen systems
and components, International Organization for Standardization, 1, ch. de la Voie-Creuse, CP 56, CH-1211 Geneva
20, Switzerland, email centr[email protected]
15. ISO 22538-4, Space Systems – Oxygen Safety, Part 4: Hazards analyses for oxygen systems and components,
International Organization for Standardization, 1, ch. de la Voie-Creuse, CP 56, CH-1211 Geneva 20, Switzerland,
email cent[email protected]
16. ISO 22538-5, Space Systems – Oxygen Safety, Part 5: Operational and emergency procedures, International
Organization for Standardization, 1, ch. de la Voie-Creuse, CP 56, CH-1211 Geneva 20, Switzerland, email
17. ISO 22538-6, Space Systems – Oxygen Safety, Part 6: Facility planning and implementation,
International Organization for Standardization, 1, ch. de la Voie-Creuse, CP 56, CH-1211 Geneva 20, Switzerland,
email cent[email protected]
18. NASA-STD-6001, NASA Technical Standard, Flammability, Offgassing, and Compatibility Requirements and
Test Procedures, National Aeronautics and Space Administration, Washington, D.C. 20546-0001
19. NASA-STD-6016, NASA Technical Standard, Standard Materials and Processes Requirements for Spacecraft,
National Aeronautics and Space Administration, Washington, D.C. 20546-0001
20. NASA/TM-2007-213740, NASA Technical Memorandum, Guide for Oxygen Compatibility Assessments on
Oxygen Components and Systems, National Aeronautics and Space Administration, Washington, D.C. 20546-0001
21. NFPA 53, Recommended Practice on Materials, Equipment, and Systems Used in Oxygen-Enriched
Atmospheres, NFPA, 1 Batterymarch Park, Quincy, MA 02169-7471
22. SAE AIR825, Aerospace Information Report, Oxygen Equipment for Aircraft, SAE International, SAE
Aerospace, 400 Commonwealth Drive, Warrendale, PA 15096-0001
23. SAE AIR825/1, Aerospace Information Report, Introduction to Oxygen Equipment for Aircraft, SAE
International, SAE Aerospace, 400 Commonwealth Drive, Warrendale, PA 15096-0001
24. SAE AIR825/13, Aerospace Information Report, Guide for Evaluating Combustion Hazards in Aircraft Oxygen
Systems, SAE International, SAE Aerospace, 400 Commonwealth Drive, Warrendale, PA 15096-0001
25. SAE AIR5648, Aerospace Information Report, Fuel Versus Oxygen: Evaluations and Considerations, SAE
International, SAE Aerospace, 400 Commonwealth Drive, Warrendale, PA 15096-0001
26. SAE ARP1176, Aerospace Recommended Practice, Oxygen System and Component Cleaning and Packaging,
SAE International, SAE Aerospace, 400 Commonwealth Drive, Warrendale, PA 15096-0001

96
2.10 Polymers and Composites
Joseph Koo, University of Texas, Austin
2.10.1 Introduction
Solid materials are often classified as metals, ceramics, and polymers. This scheme is based primarily on
chemical makeup and atomic structures, and most materials fall into one distinct grouping or another,
although there are some intermediates. In addition, there are the composites, combinations of two or more
of the above basic material classes. Polymers are organic compounds that are chemically based on carbon,
hydrogen, and other nonmetallic elements (e.g. O, N, and Si). They have very large molecular structures,
often chain-like in nature that has a backbone of carbon atoms. Some of the common polymers are
polyethylene (PE), nylon or polyamide (PA), poly(vinyl chloride) (PVC), polycarbonate (PC),
polystyrene (PS), silicone rubber, epoxy, and phenolic. Polymers are different from the other materials in
numerous ways but generally possess lower densities, thermal conductivities, and moduli. The lower
densities of polymeric materials offer an advantage for applications where light-weight is a concern. The
addition of thermally and/or electrically conductive fillers allows polymers to be used for isolative or
conductive applications. As a result, polymers may find applications in lightning strike, electromagnetic
interference (EMI) shielding, and antistatic protection applications. Polymers can further be classified into
three basic polymeric categories: thermoplastics, thermosets, and elastomers.
2.10.2 Types of Polymers
Thermoplastics, consisting of individual long-chain molecules, can be reprocessed; products can be
graduated and fed back into the appropriate machine. Thermosets contain an infinite three-dimensional
network, which is only created when the product is in its final form, and cannot be broken down by
reheating. Elastomers (rubbers) contain looser three-dimensional networks, where the chains are free to
change their shapes. Neither thermosets nor elastomers can be reprocessed. Some polymers, such as
polyurethanes, can be produced in both thermoplastic and thermoset variants.
2.10.2.1 Thermoplastics
The relative importance of thermoplastics can be judged from their U.S. annual production, sales, and
captive use data (Table 2.10.1 [1]). The 2014 total thermosets production is 15,814 million lb. (14.62% of
the total resins) vs. total thermoplastics production of 92,298 million lb. (85.38% of the total resins). The
production rate increase of thermoplastics and thermoset from 2013 to 2014 are -0.3% and 5.6%,
respectively. The first five in the table are regarded as commodity thermoplastics. Many manufacturers
complete to supply these polymers. Prices change quite rapidly, in response to the price of crude oil, so
the table indicates relative prices. The remaining thermoplastics in Table 2.10.1 are called engineering
thermoplastics because of their superior mechanical properties. They are produced on a smaller scale and
have prices about twice that of the commodity thermoplastics. Finally, there are specialty plastics which
only sell a few thousand tons per annum. An example is polytetra-fluoro ethylene (PTFE) which has
unique low friction properties.
Table 2.10.1 U.S. Resin Production, Sales & Captive Use of 2013 and 2014 (Source: American
Chemistry Council, www.americanchemistry.com )

97
Thermoplastics can be divided into amorphous and semi-crystalline solids. The amorphous polymers
are glassy at temperatures lower than T
g
(glass transition temperature) and rubbery liquids at higher
temperature. Semi-crystalline thermoplastics have an amorphous phase, and a crystalline phase with a
melting temperature, T
m
. The densities, glass transition, and crystal melting temperatures of some
commonly used thermoplastics are listed in Table 2.10.2 [2].
Table 2.10.2 Polymer Densities, Melting and Transition Temperatures of Common Thermoplastics

98
2.10.2.2 Thermosets
The basic thermosetting resins all possess a commonality is that they will, upon exposure at elevated
temperature from ambient to upward of 232
o
C, undergo an irreversible chemical reaction often referred to
as polymerization or cure [3]. Each family has its own set of individual chemical characteristics based on
its molecular component and its ability to either homopolymerize, copolymerize, or both. This
transformation process represents the line of demarcation separating the thermosets from the
thermoplastic polymers. Crystalline thermoplastic polymers are capable of a degree of crystalline cross-
linking, but there is little, if any, of the chemical cross-linking that occurs during the thermosetting
reaction. The important beneficial factor lies in the inherent enhancement of thermoset resins in their
physical, electrical, thermal, and chemical properties due to their ability to maintain and retain these
enhanced properties when exposed to severe environments. The cross-linking reaction, which occurs
during the fabrication of thermosets, also provides good adhesion to other materials. As a result, epoxy
and polyester resins are used for fiber-reinforced composites, and phenolics are used for bonding fibers to
brake pads, and sand for metal casting. Table 2.10.3 shows some comparison of thermoplastic and
thermoset resin characteristics [4].
Table 2.10.3 Comparisons of Thermoplastic and Thermosetting Resin Characteristics
Thermoplastic Resin
Thermosetting Resin
High MW solid
Low MW liquid or solid
Stable material
Low-medium viscosity, requires cure
Re-processable, recyclable
Cross-linked, non processable
Amorphous or Crystalline
Liquid or solid
Linear or Branched polymer
Low MW oligomers
Liquid solvent resistance
Excellent environmental/solvent resistance

99
Short process cycle
Long process cycle
Neat up to 30% filler
Long or short fiber reinforced
Injection/Compression/Extrusion
RTM/FW/SMC/Prepreg/Pultrusion
Limited structural components
Many structural components
Neat resin + nanoparticles
Neat or fiber reinforced + nanoparticles
Commodity – high performance areas for
automotive, appliance housings, toys
Commodity – advanced materials for
construction, marine, aircraft, aerospace
A thermosetting matrix is defined as a composite matrix capable of curing at some temperature from
ambient to several hundred degrees of elevated temperature and cannot be reshaped by reheating. In
general, thermosets contain two or more ingredients, a resin matrix with a curing agent that causes the
matrix to polymerize (cure) at room temperature. Thermosets can also be thermally cured at elevated
temperature with long curing cycle without curing agent. Some commercially available resins (matrices)
are polyester and vinyl ester, polyurea, epoxy, phenolic, bismaleimide, polyimide, cyanate ester, and
phenyl triazine.
Polyester and vinyl esters. Polyester matrices have had the longest period of use, with wide
application in many large structural applications. They will cure at room temperature with a catalyst
(peroxide), which produces an exothermic reaction. The resultant polymer is nonpolar and very water
resistant, making it an excellent choice for marine constructions. The isopolyester resins are the most
water-resistant polymers in this polymer group. They have been chosen as the prime matrix material for
use for a fleet of U.S. Navy mine sweepers.
Epoxy. The most widely used matrices for advanced composites are the epoxy resins, even though
they are more costly and do not have the high-temperature capability of the bismaleimides or polyimide.
The selection factors of epoxy are listed in Table 2.10.4 [3]. When epoxy is reinforced with fibers, it
forms polymer matrix composites (PMCs). The properties of continuous and aligned glass-, carbon-, and
aramid-fiber reinforced epoxy composites are included in Table 2.10.5 [5]. Thus, a comparison of the
mechanical characteristics of these three composites may be made in both longitudinal and transverse
directions.
Table 2.10.4 Epoxy Resin Selection Factors [3]
Advantages
Disadvantages
1. Adhesion to fibers and to resins
1. Resins and curatives somewhat toxic in uncured
form
2. No by-products formed during
cure
2. Absorb moisture – heat distortion point lowered by
moisture and change in dimensions and physical
properties due to moisture absorption
3. Low shrinkage during cure
3. Limited to about 200
o
C for upper temperature use
(dry)
4. Solvent and chemical resistance
4. Difficult to combine toughness and high
temperature resistance
5. High or low strength and
flexibility
5. High thermal coefficient of expansion
6. Resistance to creep and fatigue
6. High degree of smoke liberation in a fire and
flammable
7. Good electrical properties
7. May be sensitive to ultraviolet light of degradation
8. Solid or liquid resins in uncured
8. Slow curing

100
state
9. Wide range of curative options
Table 2.10.5 Properties of Continuous and Aligned Glass-, Carbon-, and Aramid-Fiber Reinforced Epoxy
Matrix Composites in Longitudinal and Transverse Directions (Fiber Volume Fraction is 0.60 in All
Cases) [5]
Property
Glass (E-glass)
Carbon (High
Strength)
Aramid (Kevlar 49)
Specific gravity
2.1
1.6
1.4
Tensile modulus
Longitudinal [GPa (10
6
psi)]
Transverse [GPa (10
6
psi)]
45 (6.5)
12 (1.8)
145 (21)
10 (1.5)
76 (11)
5.5 (0.8)
Tensile strength
Longitudinal [GPa (10
6
psi)]
Transverse [GPa (10
6
psi)]
1020 (15)
40 (5.8)
1240 (180)
41 (6)
1380 (200)
30 (4.3)
Ultimate tensile strain
Longitudinal
Transverse
2.3
0.4
0.9
0.4
1.8
0.5
Bismaleimides (BMIs). The BMI resins have found their niche in high-temperature aircraft design
applications where temperature requirements are in the 177
o
C (350
o
F) range. BMI is the primary product
and is based on the reaction product from methylene dianiline (MDA) and maleic anhydride: bis (4
maleimidophynyl) methane (MDA BMI). Variations of tis polymer with compounded additive to improve
impregnation are now on the market and can be used to impregnate suitable reinforcement to result in
high-temperature mechanical properties.
Polyimides (PIs). The PI resins are the highest temperature polymers in the general advanced
composite, with a long-term upper temperature limit of 232 to 316
o
C (450 to 600
o
F).
Polyureas. Polyureas involve the combination of novel MDA polymers and either amine ore imino-
functional polyether polyols. The resin systems can be reinforced with milled glass fibers, flaked glass,
wollastanite, or treated mica, depending on the compound requirements as to processability or final
product.
Cyanate ester (CE) and phenolic triazine (PT). The CE resins have shown superior dielectric
properties, and much lower moisture absorption than any other structural resin for composites. The
physical properties of CE resins are comparable to those of a representative BMI resin. The PT resins also
possess superior elevated temperature properties, along with excellent properties at cryogenic
temperatures. They are available in several viscosities, ranging from a viscous liquid to powder, which
facilitates their applications that use liquid resins, such as filament winding (FW) and resin transfer
molding (RTM).
2.10.2.3 Elastomers
Another important group of polymers is the group that is elastic or rubberlike, known as elastomers. This
group of materials including thermoplastic elastomers (TPEs), melt processable rubbers (MPRs),
thermoplastic vulcanizate (TPV), synthetic rubbers, and natural rubbers (NR) [6]. Applications, such as

101
conveyor belts, pressure hoses, think layers of either steel wire or polymeric fiber reinforcement take the
main mechanical loads. These layers, with elastomer interlayers, allow flexibility in bending, whereas the
reinforcement limits the in-plane stretching of the product. The applications are dominated by natural
rubber (NR) and styrene butadiene copolymer rubber (SBR). Other rubbers have specialized properties:
butyl rubbers have low air permeability, nitrile rubbers have good oil resistance, while silicone rubbers
have high and low temperature resistance. The rubbery behavior of the amorphous phase in semi-
crystalline thermoplastics is an important property.
2.10.2.4 Fillers
The term fillers refer to solid additives that are incorporated into the polymer matrix. Fillers are generally
inorganic materials and can be classified according to their effect on the mechanical properties of the
resulting mixture. Inert or extender fillers are added mainly to reduce the cost of the compound, while
reinforcing fillers are added to improve certain mechanical properties, such as modulus or tensile strength.
Although, termed inert, inert fillers can affect other properties of the compound besides cost. They may
increase the density of the compound, reduce the shrinkage, increase the hardness, and increase the heat
deflection temperature. Reinforcing fillers will increase the tensile, compressive, and shear strengths;
increase the heat deflection temperature; reduce shrinkage; increase the modulus; and improve the creep
behavior. Reinforcing fillers improve properties via several mechanisms. In some cases, a chemical bond
is formed between the filler and the polymer; in other cases, the volume occupied by the filler affects the
properties of the thermoplastic. As a result, the surface properties and the interaction between the filler
and the thermoplastic are of great importance. The particle shape, the particle size, and distribution of
sizes, and the surface chemistry of the particle affects the polymer properties. In general, the smaller the
particle, the greater the improvement of the mechanical property, such as tensile strength. Larger particle
size may have adverse effects. Particle shape can also influence the properties. Plate-like particles or
fibrous particles may be oriented during processing. This may result in properties that are anisotropic. The
surface chemistry of the particle is important to promote interaction with the polymer and to allow for
good interfacial adhesion. It is important that the polymer wet the particle surface and have good
interfacial bonding so as to obtain the best property enhancement.
Examples of inert or extender fillers include china clay (kaolin), talc, and calcium carbonate. Calcium
carbonate is important filler with a particle size of about one micron. It is a natural product from
sedimentary rocks and is separated into chalk, limestone, and marble. Calcium carbonate may improve
interaction with the thermoplastic. Glass spheres are also used as thermoplastic fillers. They may be either
solid or hollow, depending on the particular application. Talc is a type of filler with a lamellar particle
shape. It is a natural, hydrated magnesium silicate with good slip properties. Kaolin and mica are also
natural materials with lamellar structures. Other fillers include wollastonite, silica, barium sulfate, and
metal powders. Carbon black is used a filler primarily in the rubber industry, but it also finds application
in thermoplastics for conductivity, UV protection, and as a pigment. Fillers in fiber form are often used in
thermoplastics. Types of fibers include cotton, wood flour, fiberglass, and carbon. Table 1.6 shows the
fillers and their forms [7].
Table 2.10.6 Forms of Various Fillers
Spherical
Lamellar
Fibrous
Sand/quartz powder
Mica
Glass fibers
Silica
Talc
Asbestos
Glass spheres
Graphite
Wollastonite
Calcium carbonate
Kaolin
Carbon fibers
Carbon black
Whiskers

102
Metallic oxides
Cellulose
Synthetic fibers
2.10.3 Polymer Structure and Synthesis
A polymer is prepared by stringing together a series of low-molecular-weight species, such as ethylene
into an extremely long chain, and as polyethylene, similar to one would string together a series of beads to
make a necklace (Fig. 2.10.1) [7]. The chemical characteristics of these starting species will determine the
final properties of the polyethylene. When two different low-molecular-weight species are polymerized
the resulting polymer is termed as copolymer, such as ethylene vinylacetate as depicted in Fig. 2.10.2 [7].
Polymers can be separated into thermoplastics and thermosets as stated in the previous section. A
thermoplastic material is a high-molecular-weight polymer that is not cross-linked. It can exist in either a
linear or a branched structure (Fig. 2.10.3) [7]. Upon heating, thermoplastics soften and melt, which
allows them to be shaped using polymer processing equipment. A thermoset has all of the chains tied
together with covalent bonds in a three-dimensional network (cross-linked) as depicted in Fig. 2.10.3.
Thermoset materials will not flow once it is cross-linked, but a thermoplastic material can be reprocessed
by simply by heating it to the appropriate temperature. The difference types of structures are shown in
Fig. 2.10.3. The properties of different polymers can vary widely. Properties can be varied for each
individual polymer material as well, simply by varying the microstructure of the material.
Figure 2.11.1 Polymerization
Figure 2.11.2 Copolymer structure.
Figure 2.10.3 Linear, branched, and cross-linked polymer structures
Linear
Branched
Cross-linked

103
There are two primary polymerization approaches: step-reaction polymerization and chain-reaction
polymerization [7]. In step-reaction (also referred to as condensation polymerization), reaction occurs
between two poly-functional monomer, often liberating a small molecule, such as water. As the reaction
proceeds, high-molecular-weight species are produced as longer and longer groups react together. For
example, two monomers can react to form a dimer, then react with another monomer to form a trimer.
The reaction can be described as n-mer + m-mer (n + m) mer, where n and m refer to the number of
monomer units for each reactant. Molecular weight of the polymer builds up gradually with time, and
high conversions are usually required to produce high-molecular-weight polymers. Polymers synthesized
by this method typically have atoms other than carbon in the backbone, such as polyesters and
polyamides.
Chain-reaction polymerization (also referred to as addition polymerizations) require an initiator for
polymerization to occur. Initiation can occur by a free radical or an anionic or cationic species, which
opens the double bond of a vinyl monomer and the reaction proceeds as shown in Fig. 2.10.1. Chain-
reaction polymers typically contain only carbon in their backbone and include such polymers as
polystyrene and polyvinyl chloride.
2.10.4 Processing of Polymers
Processing is the technology of converting raw polymer, or compounds containing raw polymer, to parts
of desired shape. Considering the wide variety of polymer types and even wider variety of components
made from them, a complete description and analysis of the processing techniques would be impossible in
this section. An outline of the common processing techniques, introducing a relevant terminology and
consider how the different techniques are used in the fundamentals previously discussed. Polymer matrix
composite is the dominant composite used for aerospace structural application, this type of composite will
be the focus for the remainder of this section.
2.10.4.1 Basic Processing Operations
Polymer processing operations can be classified into five broad categories – extrusion, molding, spinning,
calendaring, and coating. Of these techniques, extrusion is perhaps the most widely used for aerospace
composites. Applications of extrusion include the continuous production of composite pipe, sheet, and
rods. Molding is normally a batch process, principally in the form of compression molding used to make
aerospace components.
2.10.4.2 Fiber- Reinforced Thermoset Molding
Many polymers do not possess enough mechanical strength for structural applications. When these
polymers reinforced with high modulus fibers, the polymeric composites have high strength-to-weight
ratios and can be fabricated in a wide variety of complex shapes. Glass and other fibers are used
extensively to reinforce thermosetting resins, such as epoxies, bismaleimides, polyimides, and cyanate
esters. Fiber glass-reinforced plastics are now used for about all boats under 40 ft. in length, truck cabs,
low production volume automobile bodies, structural panels, and aircraft components, etc. Many of these
parts are fabricated by hand layup process. The mold surface is often first sprayed with a pigmented but
non-reinforced gel coat of the liquid resin to provide a smooth surface finish. The gel coat is followed by
successive layers of fiber glass, either in the form of woven cloth or random matting, impregnated with
the liquid resin, which is then cured to give the finished product. The molds are relatively inexpensive
because no pressure is required. The major drawback of this process is the expense of the hand labor
involved.

104
A special gun chops continuous fibers into approximately 1 inch lengths. The chopped fibers are
combined with a stream of liquid resin and sprayed directly onto the mold surface. Although the random
chopped fibers do not reinforce as well as woven cloth or random mat, the labor savings are substantial.
This process is used to fabricate sinks, bathtubs, recreational vehicle bodies, etc.
In fiber-glass or graphite fishing rod, vaulting poles, golf club shafts, the fibers are arranged along the
long axis to resist the bending stress applied. Filament winding extends this principle to more complex
structures. Continuous filaments of the reinforcing fiber are impregnated with liquid resin and then wound
on a rotating mandrel. The winding pattern is designed to resist most efficiently the anticipated stress
distribution. This technique is used to produce rocket motors and missile structures, gun barrels in the
defense industry, tanks and pipes for the chemical process industries.
Pultrusion is used to produce continuous lengths of objects with a constant cross section, such as
structural beams. Continuous fibers (rovings) and/or mat are impregnated by passing them through a bed
of liquid resin and pulled slowly through a heat die of the desired cross section. The resin cures to a solid
in the die.
2.10.5 Mechanical Behavior of Polymers
2.10.5.1 Stress-Strain Behavior
The mechanical properties of polymers are modulus of elasticity, and yield and tensile strengths. For
many polymeric materials, the simple stress-strain test is employed for the characterization of some of the
mechanical parameters [8]. The mechanical characteristics of polymers are highly sensitive to the rate of
deformation (strain rate), the temperature, and the chemical nature of the environment (the presence of
water, oxygen, organic solvents, etc.).
Typically three different types of stress-strain behavior are found for polymeric materials as illustrated
in Fig. 2.10.4 [9]. Curve A illustrates the stress-strain behavior of a brittle polymer, it fractures while
deforming elastically. Curve B is similar to that for many metallic materials; the initial deformation is
elastic, which is followed by yielding and a region of plastic deformation. The deformation displayed by
curve C is totally elastic; this rubber-like elasticity (large recoverable strains produced at low stress
levels) is displayed by elastomers.

105
Figure 2.10.4 The stress-strain behavior for brittle (curve A), plastic (curve B), and highly elastic
(elastomeric) (curve C) polymers.
Modulus of elasticity (termed tensile modulus) and ductility in percent elongation are determined for
polymers using the stress-strain curve (Fig. 2.10.4). For plastic polymers (curve B, Fig. 2.10.4), the yield
point is taken as a maximum on the curve, which occurs just beyond the termination of the linear-elastic
region (Fig. 2.10.5) [9]. The stress at this maximum is the tensile yield strength (ơ
y
). Tensile strength (TS)
corresponds to the stress at which fracture occurs (Fig. 2.10.5); TS may be greater than or less than ơ
y
.
Table 2.10.7 shows some mechanical properties for several polymeric materials [9].

106
Figure 2.10.5 Schematic: stress-strain curve for a plastic polymer showing how yield and tensile strengths
are determined.

107
Table 2.10.7 Room-Temperature Mechanical Properties of Some Common Polymers
2.10.5.2 Strength
There are different kinds of strength. There is tensile strength which is important for a material to be
stretched or under tension. A polymer has compression strength, if it is strong when under compression.
A polymer has flexural strength, if it is strong under compression or bending. A polymer sample’s
torsional strength is testing by twisting it. A polymer sample has impact strength if it is strong when one
hits it sharply and suddenly with a hammer or similar.
2.11.5.3 Elongation
Elongation is a type of deformation. A polymer sample when deforms by stretching, becoming longer, the
deformation is known as elongation. It is usually measured in per cent, which is just the length of the
polymer sample is after it is stretched (L), divided by the original length of the sample (L
o
), and
multiplied by 100.
L/L
o
x 100 = % elongation
Two important elongations which are measured are ultimate elongation and elastic elongation.
2.10.5.4 Fracture
If a glassy polymer is stressed very rapidly or is stressed at a temperature that is much lower than its glass
transition temperature, it tends to break or fracture in a brittle manner. An amorphous polymer tends to
draw down in a homogenous manner if stressed at temperature above its glass transition temperature and

108
shows large strains before fracturing. At intermediate temperatures and low rates of deformation, the
polymer can yield before fracturing or fracturing in a ductile manner by neck formation. At low strain
(i.e., <1%), the deformation of most polymers is elastic, which means that the deformation is homogenous
and full recovery can occur over a finite time. At high strains, the deformation of glass polymers occur by
either crazing, characteristic of brittle polymers or by a process called shear bonding, which is the
dominant mechanism for ductile polymers. Such deformations are not reversible unless the polymer is
heated above its glass transition temperature.
2.10.5.5 Modulus
Modulus is measured to know how well a material resists deformation. There are different types of
modulus. The Young’s modulus is the material resistance to tensile deformation in a uniaxial tensile
deformation, and is calculated by the slope of the stress-strain curve in the initial linear region. Shear
modulus is the material resistance to shear deformation. The flexural modulus is the material resistance to
bending.
2.10.5.6 Toughness
Toughness is really a measure of the energy a polymer sample can absorb before it breaks. Strength tells
how much is needed to break sample, and toughness tells how much energy is needed to break a sample.
It is not necessary that just because a polymer sample is strong, it will be tough as well.
2.10.6 Aging of Polymers
For extended periods of exposure to elevated temperatures, moisture, oxygen, and ultra-violet rays;
polymers are known to exhibit changes in their molecular structure that can have profound effects on the
long-term durability of the polymer and the associated composite material. This process is known as
aging [10]. Aging is classified into three different types: physical, chemical, and hydrothermal. Physical
aging is the slow contraction of the molecular network that occurs over time when exposed to sub-T
g
temperatures. This densification of the material leads to embrittlement and loss of toughness. Chemical
aging is the oxidation and continued curing mechanisms that act on the polymer structure during extreme
environmental exposure. This aging mechanism can lead to embrittlement, loss of toughness, and
discoloration of the polymer. Hydrothermal aging introduces changes into the polymer structure due to
the presence of moisture. As water molecules diffuse into the polymer from the structural surface, the
water can change the bulk polymer density, can reduce the mechanical integrity of the material, and can
chemically react with the polymer to alter the bulk polymer properties. All three aging mechanisms are
generally detrimental to the durability of a polymer. Many polymers are formulated to specifically resist
the effects of one or more aging mechanisms.
2.10.7 Polymers for Aerospace Composites
2.10.7.1 History of Resins (Matrices)
The introduction of fiberglass-reinforced structural application in 1949 brought a new polymers
application which began with the consumption of 10 lb. annual into over a few billion lb. over the next
several decades. This usage has been and still is taking place in applications that take advantage of
extraordinarily low weight to high strength ratio inherent in these fiber-reinforced composite materials.
Polymers used as the matrix component of composites in aerospace structures must be exceptionally
durable to resist the cyclic mechanical loads associated with aircraft operation. Furthermore, many
aerospace structures must also be tolerant of high temperatures, moisture levels, thermal cycling, and UV-
radiation. For most aerospace vehicles, cost is not as big of a consideration as in other industries, so
higher-performing polymers that may be relatively expensive are often chosen over less-expensive
polymers with lower-performing qualities.

109
Thermosetting polymers are typically used in aerospace applications where high temperatures are
expected. Examples of thermosetting composites include the skin of supersonic aircraft and some re-entry
vessels. The most common thermosets used in aerospace vehicles are epoxies, bismaleimides (BMI),
cyanate esters (CE), phenolics, and polyimides (PI) [11, 12]. Epoxy resins are the most commonly used
matrix material for composites, but their use in aerospace structures is limited by relatively low service
temperatures and susceptibility to brittleness and moisture attack. BMIs are similar to epoxies except for
improved temperature performance with a relatively high performance-to-cost ratio. CE resins are more
easily processed than BMI, and offer excellent strength, moisture absorption, and electrical properties.
Similar to epoxy and BMIs, CE resins can be brittle if not toughened properly. Phenolic resins are low-
cost, flame-resistant, and low-smoke resins that are primarily used in interior aircraft panels and ablative
and rocket nozzle applications. Thermosetting PI resins have good adhesion and heat and chemical
resistance as well as superior mechanical properties. The processing of some PI resins can be difficult due
to the need for using highly corrosive chemicals.
Thermoplastic polymers are a more cost-effective alternative for thermosets when extremely high
temperature resistant requirements are not needed. Thermoplastic also have a much higher impact
strength than thermosets. Applications of these materials in aerospace applications include aircraft
interiors, wing ribs and panels, and land gear doors. Common thermoplastic polymers used in aerospace
structures include poly(ether ketone) (PEEK), polyetherimide (PEI), poly(p-phenylene sulfide) (PPS), and
thermoplastic polyimides. PEEK has good resistance to moisture attack, corrosion, abrasion, and chemical
and radiation exposure. PEEK has low smoke emission and excellent stiffness. PEI polymers have high
heat resistance, strength, and modulus, but can degrade with exposure to aggressive fluids such as
hydraulic fluid. PPS has excellent resistance to oils, fuels, solvents, anti-icing agents, and acids/bases. It
also has excellent hardness, dimensional stability, and excellent fire resistance. Thermoplastic polyimides,
like their thermosetting counterparts, offer excellent performance at elevated temperatures.
2.10.7.2 Reinforcements [12]
Fiberglass. Fiberglass possess high tensile strength and strain to failure, but the real benefits of its use
relate to its heat and fire resistance, chemical resistance, moisture resistance, and very good thermal and
electrical properties .
Graphite. Graphite fibers have the widest variety of strength and moduli and also the greatest number of
suppliers. These fibers start out as organic fiber -- rayon, polyacrylonitrile, or pitch called the precursor.
The precursor is stretched, oxidized, carbonized, and graphitized. The relative amount of exposure to
temperatures from 2500 to 3000
o
C will then determine the graphitization level of the fiber. A higher
degree of graphitization will usually result in a stiffer (high modulus) fiber with greater electrical and
thermal conductivities.
Aramid. The organic fiber Kevlar® 49, an aramid, essentially revolutionized pressure vessel technology,
because of its great tensile strength and consistency coupled with low density, resulting in very weight-
effective designs for rocket motors.
Boron. Boron fibers, the first fibers to be used in the production of aircraft, are produced as individual
monofilaments upon a tungsten or carbon substrate by pyrolytic reduction of boron trichloride (BCL) in a
sealed glass chamber.
2.10.8 Overview of Manufacturing of Composites
In general there are different fabrication processes relating to the product forms and their processes to
manufacture composite parts as shown in Table 2.10.8 which includes: Pultrusion, resin transfer molding
(RTM), compression molding, filament winding, hand lay-up, and auto tape laying [13]. In this section a

110
brief discussion of these fabrication processes to manufacture composite parts will be included based on
F. C. Campbell’s excellent text on “Manufacturing Processes for Advanced Composites [13].”
Table 2.10.8 Typical Material Product Forms vs. Process
Material
Form/Process
Pultrusion
RTM
Compression
Molding
Filament
Winding
Hand Lay-
Up
Auto Tape
Laying
Discontinuous:
Sheet Molding
Compound
●
Bulk Molding
Compounds
●
Random
Continuous:
Swirl mat/Neat
Resin
●
●
●
●
●
Oriented
Continuous:
Unidirectional
Tape
●
●
●
Woven Prepreg
●
●
Woven
Fabric/Neat
Resin
●
●
●
●
Stitched
Material/Neat
Resin
●
Prepreg Roving
●
Roving/Neat
Resin
●
●
●
Preform/Neat
Resin
●
2.10.8.1 Prepreg lay-up is a manufacturing process which individual layers of prepreg are laid up on a
tool and then cured, as shown in Fig. 2.10.6. The layers are laid up in the required direction and to the
desired thickness. At thin nylon vacuum bag is the placed over the lay-up and the air is evacuated to draw
out the air between the plies. The bagged part is placed in an oven or an autoclave (a heated pressure
vessel) and cured under the specified time, temperature and pressure. If oven curing is used, the
maximum pressure that can be obtained is atmospheric (14.7 psia or less). An autoclave (Fig. 2.10.7)
works on the principal of differential gas pressure. The vacuum bag is evacuated to remove the air and the
autoclave supplies gas pressure to the part. The pressure vessel contains a heating system with a blower to
circulate the hot gas. The autoclave offers the advantage that much higher pressures (e.g., 100 psig) can
be used resulting in better compaction, higher fiber volume percentages, and less voids and porosity.
Presses can also be used for this fabrication process, but they have several disadvantages as follows:
(1) Size of the part is limited by the heated press platen size;
(2) Platens may produce high- and low-pressure spots if the platens are not exactly parallel; and
(3) Complex shapes are difficult to produce.

111
Fig. 2.10.6 Prepreg hand lay-up process [13].
Fig. 2.10.7 Principle of autoclave curing [13].
Automated ply cutting, manual collation or lay-up and autoclave curing (Fig. 2.10.8) is the most widely-
used fabrication process for high-performance composites in the aerospace industry. While manual ply

112
collation is expensive, this process is capable of making high-quality complex composite parts. Since cost
has become a major driver, there is a tremendous amount of research being conducted to identify more
cost-effective material product forms and processes (Table 2.10.8).
Fig. 2.10.8 Traditional lay-up and autoclave cure process [13].
2.10.8.2 Filament winding (Fig. 2.10.9) is a process that has been used for decades to build highly-
efficient structures that are bodies of revolution or near bodies of revolution such as solid rocket motors.
Wet winding, in which dry fiber rovings are pulled through a resin bath prior to winding on the mandrel,
is the most prevalent fabrication process, but prepregged roving or tows can also be filament wound.
Curing is usually conducted in an oven with or without a vacuum bag. Hoop windings are often applied
over separator sheets to provide compaction pressure during cure.
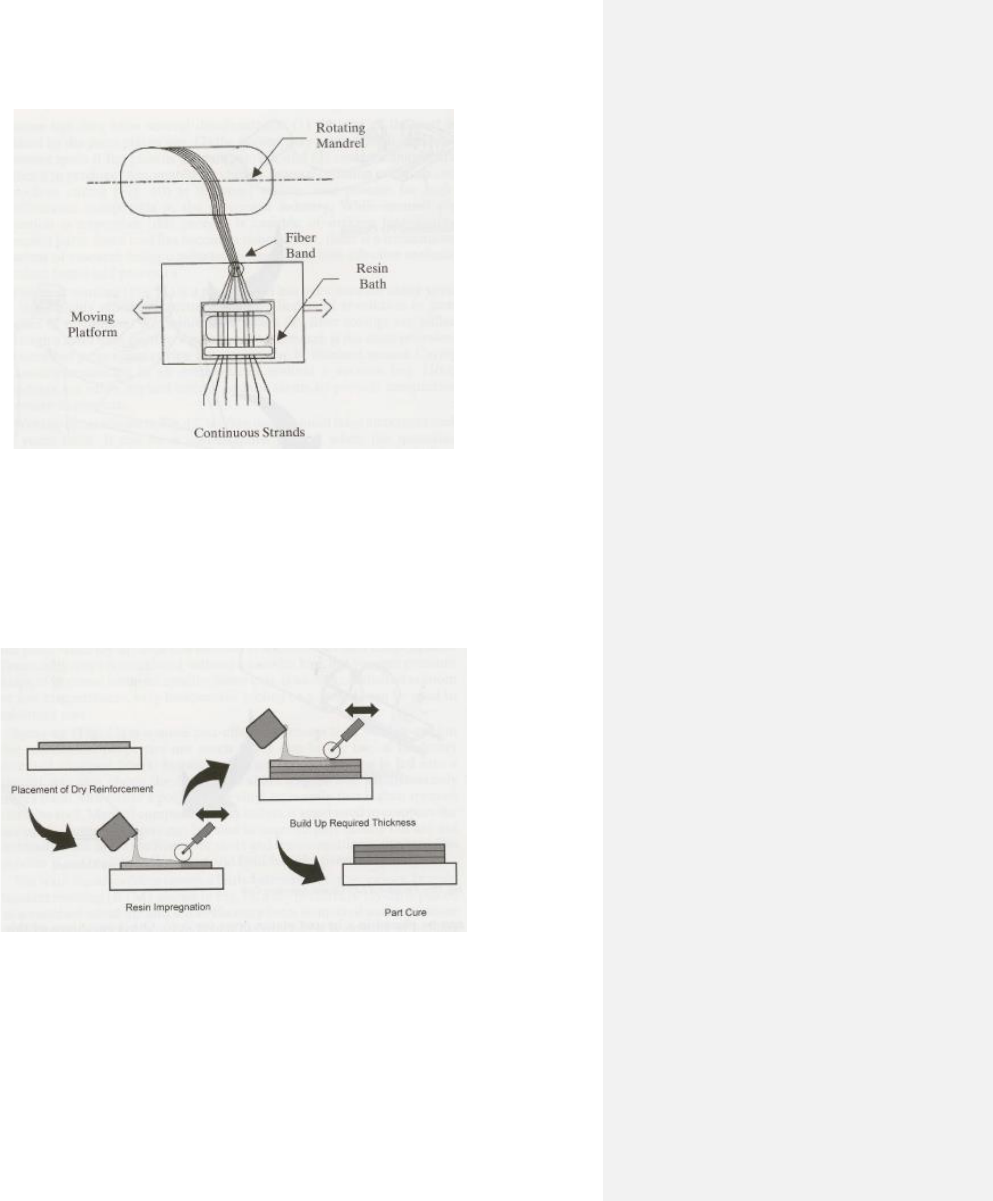
113
Fig. 2.10.9 Filament winding process [13].
2.10.8.3 Wet lay-up process (Fig. 2.10.10) is often used to build large structures such as yacht hulls. It can
be cost-effective fabrication process when the quantities required are small. Dry reinforcement, usually
woven cloth or mat material, is hand-laid on ply at a time. During or before lay-up, each ply is
impregnated with a low viscosity resin. After the ply is placed on the lay-up, hand rollers are used to
remove excess resin and air and compact the plies. After lay-up, cure can be done at room or elevated
temperatures. Frequently, cure is conducted without a vacuum bag, but vacuum pressure helps to improve
laminate quality. Since cure is usually conducted at room temperature or low temperature, very
inexpensive tooling (e.g., wood) can be used to minimize cost.
Fig. 2.10.10 Wet lay-up process [13].
2.10.8.4 Spray up process (Fig. 2.10.11) is a more cost-effective process than wet lay-up, but the
mechanical properties are much lower due to the use of randomly oriented chopped fibers. Normally
continuous glass rovings is fed into a special gun that chops the fibers into short lengths and
simultaneously mixes them with either a polyester or vinyl ester resin that is then sprayed onto the tool.
Manual compaction with rollers is again used to compact the lay-up. Vacuum bag cures can be used to

114
improve part quality but are not normally used. Since the fibers are short and the orientation is random,
this process is not use to make structural load-bearing parts.
Fig. 2.10.11 Spray-up process [13].
2.10.8.5 Liquid molding covers a fairly extensive set of fabrication processes. In resin transfer molding
(RTM) (Fig. 2.10.12), a dry preform or lay-up is placed in a matched metal die and a low-viscosity resin is
injected under pressure to fill the die. Since this is a matched-die process, it is capable of holding very
tight dimensional tolerances. The die can contain internal heaters or can be placed in a heated press for
cure. Other variations of this process include vacuum assisted RTM (VARTM), in which a single-sided
tooled is used along with a vacuum. Instead of injecting the resin under pressure, a vacuum pulls the resin
through a flow medium that helps impregnate the preform.
Fig. 2.10.12 Resin transfer molding process [13].
2.10.8.6 Compression molding (Fig. 2.10.13) is another matched-die fabrication process that uses either
discontinuous, randomly oriented sheet molding compound (SMC) or bulk molding compound (BMC). A
charge of predetermined weight is placed between the two dies and then heat and pressure are applied.
The molding compound flows to fill the die and then rapidly cures in 1 to 5 minutes, depending on the
type of polyester or vinyl ester resins used. Thermoplastic composites, usually consisting of glass fiber
and polypropylene, are also compression molded for the automotive industry.

115
Fig. 2.10.13 Compression molding process [13].
2.10.8.7 Injection molding (Fig. 2.10.14) is a high-volume fabrication process capable of making small-
to medium-size parts. The reinforcement is usually chopped glass fibers with a thermoplastics resin,
because they process faster and have higher toughness than thermoset resin. In the injection molding
fabrication process, polymer pellets containing embedded fibers or chopped fibers and polymer are fed
into a hopper. They are heated to their melting temperature and then injected under high pressure into a
matched metal die. After the thermoplastic part cools, they are ejected and the next cycle is started.
Fig. 2.10.14 Injection molding process [13].
2.10.8.8 Pultrusion process (Fig. 2.10.15) is a rather specialized composite fabrication process that is
capable of making long constant-thickness parts. Dry E-glass rovings are normally pulled through a wet
resin bath and are the preformed to the desired shape before entering a heated die. Mats and veils are
frequently incorporated into the finished part. Cure occurs inside the die and the cured part is pulled to the
desired length and cut off. Quick curing polyesters are vinyl esters are the predominant resin systems.

116
Fig. 2.10.15 Pultrusion process [13].
2.10.9 Summary
This section provides a brief introduction of the three different categories of polymers: thermoplastics,
thermosets, and elastomers and examples were given. Processing of polymers and an overview of
fabrication processes to manufacture composites are introduced, such as prepreg lay-up, autoclave
curing, traditional lay-up and autoclave cure, filament winding, wet lay-up, spray-up, resin transfer
molding, compression molding, injection molding, and pultrusion.
References
[1] American Chemical Council Plastics Statistics Data. www.americanchemistry.com.
[2] Mills, N.J. Plastics – Microstructure and Engineering Application, 3
rd
Edition. Oxford, UK:
Elsevier, 2005. pp. 15.
[3] Wright, R. E. “Thermosets, Reinforced Plastics, and Composites.” Handbook of Plastics,
Elastomers, and Composites, 4
th
Edition. New York, NY: C. A. Harper, McGraw-Hill, 2002. pp. 109-
188.
[4] Koo, J. H. Polymer Nanocomposites: Processing, Characterization, and Applications. New York,
NY: McGraw-Hill, 2006. p. 52.
[5] Floral, R. F., and Peters, S. T., “Composite Structures and Technologies,” tutorial notes, 1989.
[6] Margolis, J. M. “Elastomeric Materials and Processes.” Handbook of Plastics, Elastomers, and
Composites, 4
th
Edition. New York, NY: C. A. Harper, McGraw-Hill, 2002. pp. 189-228.
[7] Baker, A-M. M., and Mead, J. “Thermoplastics.” Handbook of Plastics, Elastomers, and
Composites, 4
th
Edition. New York, NY: C. A. Harper, McGraw-Hill, 2002. pp. 1-108.
[8] ASTM Standard D 638. “Standard Test Method for Tensile Properties of Plastics.”
[9 Callister, W. D. Materials Science and Engineering - An Introduction, 7
th
Edition. New York, NY:
John Wiley & Sons, 2007. pp. 525-543.

117
[10] Odegard, G. M., and Bandyopadhyay, A. “Physical Aging of Epoxy Polymers and Their
Composites.” Journal of Polymer Science Part B: Polymer Physics (2011): 49, pp. 1695-1716.
[11] Fried, J. R. Polymers in Aerospace Applications. UK: Smithers Rapra Technology, 2008.
[12] Wright, R. E. “Thermosets, Reinforced Plastics, and Composites.” Handbook of Plastics,
Elastomers, and Composites, 4
th
Edition. New York, NY: C. A. Harper, McGraw-Hill, 2002. pp. 166-
172.
[13] Campbell, F. C. Manufacturing Process for Advanced Composites. New York, NY: Elsevier,
2004, pp. 17-35.

118
2.11: Polymer Matrix Composites in Aerospace Structures
Alan Nettles, NASA Marshall Space Flight Center
2.11.1 Introduction
This section addresses the subject of carbon fiber reinforced polymer matrix composites (PMC)
(aka carbon fiber PMC’s or simply carbon fiber composites) in aerospace structures. The subject
matter is based on launch vehicle dry structures such as interstage and payload fairing as
examples, although the content can apply to other launch vehicle components of LV (Chapter 7),
aircraft (Chapter 5) and spacecraft (Chapter 6). Many of today’s launch vehicles (Figure 2.11.1)
utilize carbon fiber composites in their structures.
Figure 2.11.1. Examples of launch vehicles that utilize carbon fiber composites.
This section will briefly discuss the following topics:
Delta 4
Atlas 5
Ariane 5
Falcon 9
H iiB
GSLV

119
- Differences between composites and metallic materials
- Composites for launch vehicles and how they differ from use in aircraft
- Methodology of generating “allowables” for composites
- Why fatigue is not an issue in most composite structures…and certainly not in Launch
Vehicles
- Mechanical testing of composites (tension and compression)
- Predicting composite tensile and compression strength
2.11.2 Carbon Fiber Composites versus Aluminum
Since the apparent alternative to using composites for most aerospace structures is high strength
aluminum or aluminum-lithium alloys some of the differences in these materials is highlighted.
The approximate cost and classification [2-4] of these materials is presented in Figure 2.11.2a
Typical stress-strain curves for Al-Li and carbon/epoxy PMCs are shown in figure 2.11.2a and b
to give the reader an idea of the behavior and relative strengths of these two materials in both
their strongest and weakest directions. This chart also notes that Al-Li is like composites in that
it is not isotropic and is sometimes considered a “composite” (Figure 2.11.2a).
Figure 2.11.2b gives the impression that carbon/epoxy is at least 4 times stronger than Al-Li,
which, given the limited configuration of the test specimens, it is. Figure 2.11.2c shows the
extreme lack of strength in a direction perpendicular to the fibers. In practical applications, loads
are rarely totally in one direction. Furthermore, without multi-angle layers, composites tend to
split parallel to the fibers. Thus, for composites, fibers are typically placed in a multidirectional
pattern
as shown in Figure 2.11.3, usually in angles of 0°, 45°, and 90° and135 °
(more
commonly denoted by -45°).
The multidirectional composite is stronger (~120 ksi vs. ~80 ksi) and lighter (1.3 g/cm
3
vs. 2.5
g/cm
3
) than AL-Li, but in practice, no structure made from composites can be designed to these
strengths due to allowances in damage, flaws and/or other stress concentrations that are
inevitable in any practical structure.

120
Figure 2.11.2a. Candidate materials for use on launch vehicles.
Figure 2.11.2b Stress-Strain curves of AL/Li [5] and unidirectional carbon epoxy in strogest direction.
Figure 2.11.2c Stress-Strain curves of AL/Li [5] and Unidirectional carbon epoxy in weakest direction.
PMC, unidirectional
Density = 1.3 g/cc
Al/Li with grain
Density = 2.5 g/cc
Stress
(ksi)
Strain
0.9%
82
Stress
(ksi)
Strain
1.5%
398
PMC, unidirectional
Density = 1.3 g/cc
Al/Li against grain
Density = 2.5 g/cc
Stress
(ksi)
Strain
0.9%
78
Stress
(ksi)
Strain
0.5%
9

121
Figure 2.11.3. Schematic of Multidirectional composite and associated stress-strain curve.
For composites, strength versus flaw (or damage severity) looks like Figure 2.11.4. In this
example, compression strength versus increasing impact damage severity level is plotted. In
general, there is a rapid decrease in strength with increasing damage severity. This drop in
strength “levels out” at large damage severity levels in this example (representing penetration of
the laminate due to the impact event).
The pristine (undamaged) value of 120 ksi listed in the figure can never be used in design.
Knowing this “ideal” value only makes one regret what might be realized if not for having to
deal with damage or stress concentrations…an unrealistic scenario. The more realistic and
practical value of compression strength at a lower value to account for damage and/or stress
concentrations is what will inevitably be designed to on virtually all aerospace hardware.
Damage in metallic structure are also be accounted for but there are major differences.
Stress
(ksi)
Strain
1.5%
120
Damage Severity
Smallest damage being designed to
Compression
Strength
120 ksi
Highest Strength with
damage
Can never be used!
Penetration (hole)

122
Figure 2.11.4. Example of compression strength of a composite laminate versus increasing impact
energy.
Figure 2.11.5 is a simple schematic that shows what is of concern in metallic structures. Metallic
structures are concerned with the growth of a single crack whereas composites are immune to
single cracks due to the immediate blunting of the crack by the embedded fibers as shown in
Figure 2.11.6. References to “crack growth” in current composite documents are a holdover from
metallic structure and can be misleading.
Figure 2.11.5. Schematic of a crack growing in a metallic structure
Gray=> Matrix (resin) Black=> Fiber
Fibers arrest cracks
Top View
Side View
Microscopic Scale

123
Figure 2.11.6. Schematic of crack blunting in a composite.
Rather than a single crack growing, composites are mainly concerned with delaminations, or the
separating of the layers making up the laminate as shown schematically in figure 2.11.7. This is
an important concept to bear in mind when attempting to apply metallic type damage tolerance
requirements to composites. The small micocracks between plies are benign compared to the
delaminations.
Figure 2.11.7. Laminate cross-sectional schematic showing the difference between “cracks” and
“delaminations”.
As to the question of what material to use (metallic or composite), the first question that needs to
be answered is
“
What do you need the part to do?” There is not a single material suitable for all
structure in a launch vehicle. A plethora of materials are at the designer’s disposal and carbon
fiber laminates are simply one of these engineering materials, suitable for some needs, but
certainly not all structural parts. Questions on material selection such as this one are discussed in
detail in Chapter 3.
Once it is determined that carbon fiber PMC laminates are the material of choice, how to use this
material and make aerospace parts from them is then explored. One of the biggest problems that
the author has noted within the launch vehicle industry is that composites knowledge comes from
the aircraft industry, but if one is not building an airplane, much of this knowledge is not
applicable.
2.11.3 Composites for Launch Vehicles - how they differ from use for aircraft
Figure 2.11.8 presents the basic concept of this section: namely ‘a rocket is not an airplane’.

124
Figure 2.11.8. The basic concept of this section.
Airplanes are designed for thousands of flights over decades and most launch vehicles are flown
once and then discarded, thus the differences in designing for each are very different. This
section will point out many of these differences and how launch vehicles have an advantage over
airplanes in that not as much up front time and money need be spent in materials
characterization.
First it should be noted that several types of composites have been used in manned launch
vehicles and spacecrafts. For example Table 2.11.1 lists some of these composites used in the
Space Shuttle Orbiter.
Table 2.11.1 Composites flown in Space Shuttle Orbiter*
Composite Material type
Application
Reinforced carbon-carbon
Fuselage nose cap and wing leading edge
Fuselage chin panel
Graphite/epoxy
Payload bay doors and OMS pod shells
Wing intermediate spar webs (OV-103 & subsequent)
Boron/epoxy
Thrust structure stiffening
Boron/aluminum
Mid-fuselage frame tubes
Aluminum honeycomb sandwich
Upper wing panel
Elevons and body flap
Rudder/speed brakes
NLG and MLG doors

125
Internal airlock
*Courtesy: Tom Modlin “Space Shuttle Orbiter Composites and Certification” Sept. 10, 2008
Most of the information concerning how to design and build with composites laminates comes
from the aircraft industry in general and Composite Materials Handbook (CMH-17) in particular
[6]. However, launch vehicle structure is typically stiffness driven and aircraft structure is mostly
strength driven. Aircraft can be designed for “get home” loading cases whereas there is no
control over a launch vehicle after launch. Launch vehicles are inspected in detail before each
flight whereas aircraft can go many flights before an inspection. Finally, launch vehicles are (or
should not be) subjected to foreign object impacts whereas airplanes are under a constant barrage
of foreign object impacts (hail, runway debris) and must continue to fly after these events. These
are some of the differences that actually simplify what needs to be done as far as material
characterization when building a launch vehicle versus building a large airplane.
The concept of lifetimes and inspection intervals, so often mentioned in CMH-17, is relevant to
airplanes and helicopters and emphasizes the economic drivers of airplane design. Rockets are
much easier to deal with since they typically have a lifetime of one flight, not thousands, between
either next flight (such as Shuttle) or discarding (such as Space Launch System). An example of
the differences in “lifetimes” of an airplane and a rocket are shown schematically in Figure
2.11.9.
Figure 2.11.9. Schematic example of “lifetimes” of an airplane wing and a launch vehicle component.
1 or 2
Cycles
% Limit
Load
Cycles
Millions
100
One Lifetime
Airplane Wing
One Lifetime
Launch
Vehicle
Interstage
% Limit
Load
Thousands
Hundreds

126
It has been established that launch vehicle hardware see just a fraction of the number of load
cycles that an aircraft part does thus the problem of fatigue is eliminated and need not be a part
of any future discussion with regard to launch vehicles. Figure 2.11.10 is experimental evidence
of this fact. Note that for the major design driver for launch vehicle hardware and that mentioned
in ref. [1]), namely compression after impact, the impact damage does not reduce the fatigue life
of the material until at least one million cycles at or above 60% of ultimate load. This kind of
severe high amplitude loading is not an issue for most aircraft parts and certainly not for any
launch vehicle hardware. In fact, the “Design space for launch vehicles” area of figure 2.11.10 is
not even populated with any data as it is known that no detrimental effects to the laminate can
occur in this region and thus it is simply not tested for.
0
20
40
60
80
100
120
0 1 2 3 4 5 6 7
Percentage of static CAI Strength
Cycles to Failure (10
x
)
Figure 2.11.10 Example of fatigue data with reference to launch vehicle design space [from reference 7].
It should also be noted that the motivation for using composites is different for aircraft and for
launch vehicles. Aircraft have many reasons that composites are preferred over metallic, weight
reduction being just a small driver. Composites allow a commercial airplane to operate with
higher pressure and humidity in the cabins increasing passenger comfort. The excellent corrosion
and fatigue resistance of composites allow longer intervals between costly inspections and larger
windows to exist in the fuselage. For launch vehicles, weight reduction is the only reason to
consider composites over metallic.
Until the difference in damage tolerance requirements between aircraft and launch vehicles are
considered, composite launch vehicle parts will not be as light as their metallic counterparts.
UL
LL
Loads too High
Too many
Cycles
Design space
for launch
vehicles
Note: No failure in
this zone…stress
too low.
Data from [7]
Data from References in [7]

127
Figure 2.11.11 shows two photographs of the type of damage that are in the design space of
aircraft. Extreme amounts of damage must be tolerated for an aircraft. In contrast, figure 2.11.12
shows the types of superficial damage that will ground a launch vehicle until the damage is
dispositioned. In both of these instances the hardware was scrapped.
Figure 2.11.11 Examples of the extreme damage aircrafts are designed to.
TOS-II Rocket Motor Case

128
Figure 2.11.12 Example of minor damage that will ground a launch vehicle.
Figure 2.11.13 Compression after impact (CAI) strength data of various fiber/resin systems.
Another benefit of not copying what aircrafts do is that the best fiber/resin system for the given
part can be used. Take for instance the CAI strength data of various fiber/resin systems shown in
Figure 2.11.13. Note the superior strength of the 8551-7 resin. For a piece of hardware driven by
CAI strength (launch vehicle interstage for example), the IM7/8551-7 systems appears to be the
best, however this system is rarely used on aircraft since it has inferior “hot/wet” strength and the
“hot/wet” environment is required for aircraft components. The “hot/wet” environment is not
applicable to virtually all launch vehicle hardware since the “wet” portion for airplanes is driven
by takeoff/landing cycles, which launch vehicles do not have. This is often overlooked and a
system such as IM7/977-3 is often chosen since “airplanes use it a lot” or because “the F-22
program has produced a large database of coupon test data”.
Conclusion: A launch vehicle is not an airplane. Simply copying what the aircraft industry has
done should be questioned and requirements should be chosen that are launch vehicle specific.
2.11.4 Alternate methodology for generating allowables
This section is an attempt to raise awareness about generating costly and time consuming
“allowables” for pristine lamina and laminate strength properties. The author is suggesting that
Commented [BBN(1]: What is CAI? Also, since the publisher
does not use color, you may want to use a B&W version of it.

129
this lower level of the “building block approach” can be eliminated since the data will never be
used and instead, generation of strength data be developed on damaged composite, since this is
what the vehicle is being designed to. In fact, a common methodology used with carbon fiber
laminates is to set the maximum allowable strain at 0.4% and this is well below what any of the
measures allowables on coupon specimens will give.
One of the concepts of this alternative methodology basically states that if a loading case is not
governing the structure being designed, then developing ‘allowables’ for this benign , or even
nonexistent, type of loading is a waste of time and resources. For example, if a rocket motor case
is the hardware in question, then developing compression and shear allowables may not be
warranted as the structure is so heavily tension dominated.
Figure 2.11.14 is a visual representation of the basic concept of this alternative methodology. As
damage severity increases, the strength that one uses for design decreases as noted previously in
section 2.11.2. If a certain amount of damage must assume to exist in the structure, then testing
for higher strength values in pristine configurations is useless and only serves to cause regrets
about the drastically higher values that could be used if not for having to deal with damage.
This figure uses compression as the measure of strength and impact energy as the measure of
damage severity noting where to obtain the allowables. If damage greater than what was
designed to exists, then the part is repaired or rejected before flight.
Figure 2.11.14 Strength data showing level at which allowables should be developed using compression
after impact as an example of the critical design driver.
Worst case impact damage being
designed to
Compression
Strength
Impact Energy
Time and money are typically spent attempting to find this
strength value
Strength value used to design final
product…get allowables here
Adequate
Strength
No fly (repair)

130
The basic steps typically taken to arrive at “allowables’ for a composite component is to generate
strength allowables for all loading cases (or all failure loads). This means that a statistically
significant amount of strength values for tension, compression and shear are determined for
unidirectional lamina no matter the critical loading of the hardware in question. The analysts
require these lamina level properties to put into some commercial code to predict the strength of
subsequent laminates and these laminates are then tested to verify the code. Once the strength
predictions have been validated some optimum lay-up is then defined by the designer. These
optimum laminates are then tested for strength, again, typically at all failure modes just like the
lamina specimens. Once these data are at hand, then the details of the loading cases, operating
environment and damage tolerance are considered for the already defined and unchangeable lay-
up. The lay-up is unchangeable at this point because all laminate data are for a certain lay-up and
any change in lay-up would require the entire allowables program be repeated (a cost prohibitive
option). So even if a more damage tolerant lay-up is identified, it would not be utilized at this
point due to the time and expense invested in the “pristine allowables” generation.
In the alternate method of generating allowables only load cases (failure modes) that are known
to be critical are tested for. And then only laminate data with whatever level of maximum
damage is allowed in the structure (usually barely visible impact damage) is tested. It is common
practice to set the “damage” as a ¼ inch hole and use strength values based on that.
Note both methodologies end with the same basic information (data used for final production
design), only the alternative methodology has laminates that are optimized with the damage
tolerance requirements considered rather than whatever pristine lay-up of test coupon gives the
highest strength value.
Also, with regard to “allowables” it is interesting to note the fidelity of the data. Figure 2.11.15 is
a schematic of the increasing fidelity of strength data with increasing number of specimens
tested. One of the hallmarks of A and B basis allowables is that more specimens give higher
fidelity (and thus a slightly higher allowable).
This is typically interpreted as “more specimens means higher reliability for the final structure”.
However, note that the A and B basis coupon strength data are eventually reduced to far below
their values by arbitrary amounts such as factor of safety, which has no mathematical basis. At
this point, assuming that coupon strength data actually has meaning to the final structure, the
high fidelity gained by testing many more specimens is almost miniscule by the time the average
strength value is reduced due to these arbitrary “knockdowns”. This raises the question of using
“statistically significant” A or B basis values over something much simpler and cost effective
such as average strength.
Testing only damaged laminates also has some other advantages other than the obvious one of
not spending time and money generating data that will never be used. One of these advantages, is
obtaining strength data that is directly applicable without having to rely on questionable

131
theoretical concepts such as “interactive failure criteria” and/or “first ply failure”. The fallacy of
“first ply failure” will be covered in detail in section 2.11.6.
Using Hart-Smith’s “10% Rule” [8] is a good enough estimate of pristine strength, particularly
given what happens to the pristine strength data as shown in Figure 2.11.15. This is covered in
more detail in section 2.11.7.
Figure 2.11.15 Schematic of fidelity of strength data.
2.11.5 Why fatigue is not an issue in most composite structures
This section touches on the heavy emphasis on fatigue testing and terminology that has found its
way into composite materials documents, undoubtedly as a result of the importance of fatigue in
metallic structure. This terminology still persists today in FAA documents and CMH-17 even
though composites are far superior in fatigue resistance than metals and the only practical
implications of studying fatigue in composites are in rare applications that experience millions of
(Calculated mathematically)
Pristine Allowable
Allowable Actually Used (DT
“Knockdown” with Factor of Safety)
Number of Specimens
Percentage of
Average
Strength
100
50
10
15
20
25
90
80
70
40
30
Average Strength with Safety
Factor and damage tolerance
reductions
Increased
fidelity (pristine)
Increased fidelity
(damage)
Arbitrary (Non-
Mathematical)
Reduction

132
load cycles near limit load (such as helicopter rotors). Generally speaking, launch vehicles would
not experience such fatigue loading as mentioned in section 2.11.3.
The gradual reduction in strength of a metal (due to fatigue) versus the sudden decrease in
strength of a composite (due to a discrete source event) is shown schematically in figure 2.11.16
from reference [6]. For the metallic material, it is possible to “catch and repair” the growth of the
crack during an inspection interval and prevent the metal from not being able to carry ultimate
load. The composite on the other hand has an immediate drop in load carrying capability after
the impact event and there is no time to “catch and repair” this damage before the next scheduled
inspection interval. All of this is irrelevant to many aerospace structures since the inspection
interval is set at every flight, something unheard of in the aircraft industry.
Figure 2.11.16 Chart from CMH-17 showing decreased strength as a function of damage for metals
(fatigue damage) and composites (impact damage)
Throughout CMH-17 and FAA (Federal Aviation Administration) documentation there is much
made of “damage growth” and how this growth affects certification. The next figures are data of
damage growth and how it manifests itself in carbon composite laminates. It was noted decades
ago that if any damage growth could be measured, this growth was sudden and rapid, not gradual
as a crack grows in metals [9]. In analogy with metallic structure, any growth that occurs is
supposed to be monitored during inspection intervals and when the growth (crack length in
metals) reaches some “critical” stage, the damage is repaired. Note that if any growth is sudden
and rapid that it can easily occur between inspection intervals and cause catastrophic failure.
Thus relying on detecting delamination growth before failure is an obvious safety issue. Thus
damage “growth’ is a poor measurement parameter in composites as applied to safety and
certification. Figure 2.11.17 shows an example of damage “growth” that is simply an artifact of
Impact Event

133
testing small coupons and not “true” damage growth [10]. Despite the obviousness that the initial
damage area does not grow, these data are reported as damage “growth”. Unlike metallic
structures, fatigue cycled composites actually get stronger after a fatigue spectrum. This is due to
the large number of crack paths that can be formed and then immediately arrested allowing for
stress relaxation around any points within the material that experience stress concentrations that
would normally lead to premature static failure.
Figure 2.11.17 Example of reported “damage growth” that really isn’t. Data from [10]. (Text in italics
author’s comments not part of original figure)
2.11.6. Mechanical Testing of Composites
This section is presented to give the reader insight into some of the peculiarities of some of the
mechanical tests commonly performed to generate composite material allowables. By
understanding these tests, and their limitations, it will be revealed that even if a “pristine”
structure could be designed to, the allowables are dubious and do not represent what they are
supposed to be; namely material variability. A no cost solution as to what to use for “allowables’
(as first proposed by Hart-Smith [11]) is presented at the end of this section.
For tension and compression testing, the advantages of testing a “notched” specimen (specimen
with a hole) are presented in figure 2.11.18. Many carbon fiber composite structures are designed
such that a ¼ inch hole is assumed to exist anywhere in the structure. This accounts for a vast
array of damage tolerance concerns and represents conservative strength values, although if one
is designing to reduce weight these values may result in an overly heavy structure. Since
laminates tend to be weaker in compression than tension, the design value of interest is thus
often Open Hole Compression (OHC) strength. It is interesting to note that for IM7 carbon fiber
laminates, the OHC strength of a quasi-isotropic lay-up is about 48 ksi and since the modulus is
about 8.4 MSI, the strain to failure is about 0.57%. Applying a 1.2 factor safety of lowers this to
Edge Delamination, not
damage growth
Initial Damage

134
0.47% and using the often assumed 85% knockdown for “B-basis” scatter gives a final design
strain of 0.40 which is what is commonly designed to for carbon fiber laminated structures as
mentioned previously in section 2.11.4.
Figure 2.11.18 Schematic explaining why testing notched specimens reduces variability in strength
measurements.
As an example of how test technique can affect the measured tensile strength of a laminate and
thus nullify the whole notion of ‘allowables”, figure 2.11.19 shows tensile strength data
generated by the author. All values are the tensile strength averages from the same fiber/resin
panel. The only difference is that the 734 MPa value average were coupons cut such that the 0º
fibers where in the outside surfaces of the test specimen. Note that doing this gives a
significantly lower measured tensile strength value (734 versus 814 MPa), despite the panel not
changing.
Also noted in this figure is how testing laminates with a hole, which is what is typically designed
to anyway, removes the problem of lay-up orientation giving artificially low values. If the
Specimen preparation is critical for “smooth” (undamaged, no
stress concentration) specimens
Specimen breakage can
initiate anywhere. Precision
machining needed to avoid
stress concentration along
entirety of both edges. Also
premature breakage at
gripping tabs can be a
problem
“Smooth”
Really a “test of the test
method”
Specimen with stress
concentration (hole for
example) will break at hole.
Machining of most of
specimen not critical. Tabs
not needed eliminating
premature breakage at this
location
Hole
Specimen
breakage will
initiate here
This helps reduce
“scatter”

135
alternative method of generating allowables as outlined in section 2.11.4 is used, many of the
problems with generating “allowables’ would be eliminated. The measured scatter in strength
would decrease and the erroneous attribution of high scatter to material variability and not test
technique would be avoided.
Figure 2.11.19 Tensile strength of quasi-isotropic laminates. Data showing lower strength values by
having 0º plies on the outside.
A mechanical coupon level test worth noting is the transverse lamina tensile strength. Transverse
(90º) tensile strength is a test with no fibers carrying any load since the load is applied
perpendicular to the fibers. Meaning of this test and some potential pitfalls of performing this test
will be discussed.
The strength values determined by this test are extremely low, as might be expected since the
fibers are useless (or even detrimental) to the strength of the bulk polymer matrix material in this
configuration. Figure 2.11.20 shows the typical tensile strength values determined by performing
this test. The values are about 7-8 ksi (or about 5000 microstrain). This is about 1/3 the tensile
failure strain of most practical laminates in use. The specimens will show a clean straight break

136
parallel to the fibers since any fracture path would not cross through fibers because the fibers are
so strong.
Figure 2.11.20 Schematic noting typical transverse (90⁰) tensile strength of composites.
Figure 2.11.21 Schematic showing transverse (90°) tensile strength in realistic laminate. Note that when
sandwiched between plies of 0º orientation, the 90º ply does nothing until near failure when the stress in
the 90º ply is now about 16,000psi…much greater than the predicted 8000 psi.
0.005 in
(1-ply)
Until near failure
(~15,000µε),
nothing happens
When ply stress
(calculated per Classical
Lamination Theory) is
around 7000-8000 psi
(~5000µε) ply should
“fail”?
90º ply between two 0º plies
16 plies (.08 in) per
ASTM D-3039
Between 7000
and 8000 psi
(~5000µε)
specimen breaks

137
Figure 2.11.21 points out that when 90º plies are embedded between load bearing plies, nothing
happens in tension until near failure (~120 ksi) but according to the 90º tensile test, the 90º plies
should have “failed” at about 7-8 ksi. By “failure’ (as in “first-ply-failure”) it is assumed this
means matrix cracking which can develop in cross-ply laminates if enough 90º plies are clumped
together. Figure 2.11.22 is presented to show, not only has it been qualitatively known that “first-
ply-failure” will be lower as more 90º plies are clumped together but quantitative data has been
in the literature since at least 1982 [12]. As pointed out in this figure, since real engineering
laminates do not clump plies together, the “real” value of “first-ply-failure” is closer to 15 ksi
rather than the oft quoted 7-8 ksi.
Figure 2.11.22 Shows relationship between transverse ply “failure stress” and thickness.
Data from [12]. Text is author’s addition, not part of original figure.
Figure 2.11.23 notes the criticality of the gage length when compression testing laminates. Long
gage lengths will cause global buckling and very short “stubby” gage lengths can cause some
artificially high values. Thus something “in-between” is needed but what defines this gage length
value that gives a “true” compressive strength value?
Testing notched laminates will give you more useful information and reduce the influences of
test parameters, Figure 2.11.24 notes that if a hole were present in the coupons in the previous
Stress at first
observed
Microcracks
Values quoted in Databases
More Realistic Values
Increasing 90° ply clumping

138
figure, then the compression strength would all tend toward the same value regardless of gage
length since the failure is localized to the hole.
Figure 2.11.23 Geometry dependence of compression test strength values.
Thin/long specimen
buckles prematurely
Wide/Short specimen
gives artificially high
results
Something in between more
representative, but if result is
dependent on geometry, what
size is appropriate?

139
Figure 2.11.24 Open hole specimens would eliminate geometry affects. Note: As long as specimen
width/ hole diameter > 6, similar values are obtained since failure is forced at holes
By testing specimens with holes, the scatter goes down which helps prove that much of the
measured scatter in strength is not from the material, but from the specimen preparationThe
reduced scatter of specimens with holes can deliver B-Basis allowables near or above those for
specimens without a hole. The sketch in figure 2.11.25 is from a John Hart-Smith publication
[11] in which he made this same point. Since tabs must be used for pristine specimens, premature
breaks due to poor tab bonding can occur and give values lower than specimens with holes since
these specimens do not need tabs thus eliminating these premature breaks due to poor tab
preparation.
Figure 2.11.25 Hart-Smith’s schematic (no actual data) on coupons with holes having less scatter
resulting in a near equal B-Basis allowable than unnotched coupons (from [11].
In closing the variability obtained by the type tests presented in this section is more a measure of
specimen preparation and test technique than material variability [Ref. 11] despite all scatter
being attributed to material variability. Simple proof that the material is not responsible for all
scatter is the lower scatter that is always obtained for open hole testing. The material does not
magically become more uniform because a hole is drilled in a specimen yet that is what is
assumed in large databases of “allowables” in which the high scatter from testing smooth
specimens is attributed entirely to the prepreg material.
A simple solution to obtaining pristine lamina data in which no tests need even be performed is
first proposed by Hart-Smith [11]. He suggests using vendor supplied data. The most reliable
(and highest) strength data usually comes from the material manufacturers. All end users now
use the same database for a given material and then appropriately attribute their lower measured
strength values and higher scatter to errors in processing the test specimens and the tests
themselves. In the author’s experience this is usually the case anyways, since the first thing done
Measured net
section
strength
No Holes (poor tabs)
Holes (no tabs)
Average
B-Basis

140
after performing a series of tests is to compare results to what others have gotten and rejecting
results if they fall on the low side.
2.11.7 Strength of Composite Laminates
As has been the theme throughout this section, pristine strength allowables of multidirectional
laminates are of little practical use, but should they be needed, this section shows a no-cost way
to obtain these values for tension and compression. The methodology to do this has been
independently arrived at by two of the most respected composites engineers in the field [8, 13].
Before entering into discussions of strength of multidirectional laminates it is important to know
the terminology about stacking sequence used in this section. Usually the stacking sequence is
written with the numbers in the brackets indicating angles in degrees from some reference point.
For laminates that only contain plies with angles of 0º, +45º, -45º and 90º (π/4 angles) with no
other angles present, the stacking sequence can be notated by the percentage of each of these
four angles in the laminate. The percentage of 0º plies is noted first, followed by the percentage
of +45º and -45º plies combined. Finally, the third number indicates the percentage of 90º plies
in the laminate. A laminate with more 0º plies will have a higher first number at the expense of
lowering one (or both) of the other two.
For “quasi-isotropic type” laminates (i.e. laminate only contains some combination of 0°, 45°, -
45° and 90° fibers), the nomenclature is sometimes written in the form:
[% 0° plies/% 45° plies + % -45° plies/% 90° plies]
Thus a [+45°/90°/-45°/0°]
S
laminate can be written as: [25%/50%/25%]
and a [+45/90/-45/0
2
]
S
laminate can be written as: [40/40/20]
Figure 2.11.26 presents the tensile strength and failure strain of various multidirectional
laminates of various IM7 fiber/polymer matrix systems. The lay-ups are noted with the
percentage type designations just discussed and are noted in the brackets above each value bar.
As expected, a vast range of stress values are realized since the laminates have differing
percentage of 0º plies which are responsible for most of the strength contribution. When plotted
as strain, the values all tend toward 1.5% failure strain despite some of the resins being of
different classes (epoxy and bismaleimide (BMI)).

141
Figure 2.11.26 Tensile data for strength of multidirectional laminates.
Figure 2.11.27 contains an example of a stress-strain curve of a multidirectional laminate
generated by the author.. It shows the linear behavior of the laminates that is routinely seen
despite “first-ply-failure’ theory predicting a “knee” at the lower end of the curve. This linear
behavior will help to simplify strength predictions. In this figure the typically used design strain
of 0.4% is highlighted to show that for any practical applications, the stress strain behavior is
linear even if some non-linearity appears near the failure stress.
Note that if a linear stress-strain relationship holds, then the tensile strength of a laminate made
of IM7 carbon fiber is simply the modulus multiplied by 0.015 failure strain. For AS4 carbon
fiber laminates, this value would be 0.012. Table 2.11.2 shows how much error is present if all
IM7 carbon fiber laminates are assumed to fail at 1.5% strain. With one exception the data are
within 10% and arguments have been made about the difficulty in testing pristine laminates so
this variation between measured values is not surprising. Thus any lay-up, IM7 fiber composite
with any polymer matrix can be expected to fail at about 1.5% strain with little error by this
assumption.

142
Figure 2.11.27 Typical stress-strain curve for a multidirectional laminate.
Table 2.11.2 Percent error if all IM7 carbon fiber laminates are assumed to fail at 1.5 percent strain
Note: Strain commonly designed to (0.4%)
0
20
40
60
80
100
120
140
160
0 0.5 1 1.5 2
8Q4
Stress (ksi)
Stress (ksi)
Strain
T800/AR250
(+45/90/-45/0)
S
(2) NCAMP
(1) F22
Source:
(3) AFRL
(4) Bristol U.

143
Although the π/4 type of laminates are by far the most commonly used, sometimes the strength
of a laminate with plies at some angle other than 0°, 45° or 90° may be desired. Classical
lamination theory works very well to calculate the modulus of any given lay-up if the
unidirectional elastic constants are known. Vendor data is typically not difficult to obtain thus
the modulus of any lay-up can easily be calculated with a basic computer code that can do
classical lamination theory.
Since in compression the resin helps support the fibers and prevent them from micro-buckling,
the resin does play a larger role in determining strength in compression than strength in tension.
Also compression testing of laminates is more difficult due to specimen buckling and obtaining a
uniform application of load, especially as the laminate becomes stronger and stiffer (more 0°
plies).
Consider figure 2.11.28 which shows compression strength data from IM7 carbon fiber laminates
with various percentages of 0° plies [14]. Note that when plotted as failure strain, the laminates
all tend to the same value of ~1.3%, with those with higher percentage of 0° plies giving slightly
lower values due to the test limitations of laminates with more 0° plies as mentioned above.
Figure 2.11.28 Compression data for strength of multidirectional laminates [14].
Compression
Strength (ksi)
200
100
50
150
Layup Type
1
2
3
4
5
6
1= [11/67/22]
2= [22/56/22]
3= [33/56/11]
4= [44/56/0]
5= [56/44/0]
6= [67/33/0]
Layup Type
1
2
3
4
5
6
1.4
1.0
0.5
1.2
Compression
Strain (%)

144
The measured values in figure 2.11.28 are close to those predicted if the vendor data [15] for
compression of a uniaxial laminate is used along classical laminated plate theory and a cut-off
failure strain of 1.3%. Considering these values will be greatly reduced as mentioned many times
in this section, these values can be used as preliminary design estimates if need be.
Estimating the B-Basis strength values can be done by taking 85% of the average strength values
as mentioned previously in section 2.11.6. This is a common practice for carbon fiber
composites. To obtain an A-basis strength value, typically 70% of the average strength value is
used.
2.11.8 Summary
This section discusses the behavior of composites as structural materials and compares them with
metallic materials such as aluminum and Al-Li alloys. It makes the point that composites and
metals are different and the damage and failure mechanics are entirely different. Very often
aircraft type requirements that are levied upon launch vehicles when composites are used despite
the two vehicles having vastly different purposes and lifetimes. The aircraft industry has far
more stringent requirement for the many reasons mentioned, especially the fact that they must fly
with damage. Argument is made that costly building block approach to generating material
allowables using pristine lamina and laminate strength properties is not really necessary.
Strength data must be developed on damaged structures, since this is what the vehicle is designed
to. Fatigue testing important for metals is a non-issue for most applications of carbon fiber
composites. Further, the section sheds light on what “allowables” values are, the tests that
generate them and why they are far from the high fidelity they claim. It presents a simple method
to determine the tensile and compressive strength of any carbon fiber laminate with no testing
needed.
REFERENCES
1. NASA Marshall Space Flight Center (2006). Fracture control requirements for composite
and bonded vehicle and payload structures, MSFC-RQMT-3479, Marshall Space Flight
Center (MSFC), AL, USA.
2. Anon (2012). Future materials: aluminum-lithium, standard metals or composites”
Leeham News and Comment. Retrieved online November 1, 2013.
3. Hicks, J.P. (1989). Business Technology: New Materials altering the aircraft industry.
New York Times, December 20, 1989.
4. Anon (2008). The impact of composites on the aerospace and defense industry.
Aerospace and Defense Advisory, Summer 2008.
5. Hales, S.J. and Hafley, R.A. (2001). Structure-property correlations in al-li alloy
integrally stiffened extrusions. NASA TP-2001-210839.
6. Composites Material Handbook 17G (2013). Volume 3, Chapter 12.

145
7. Nettles. A.T., Hodge, A.J. and Jackson, J.R. (2011). An examination of the compressive
cyclic loading aspects of damage tolerance for polymer matrix launch vehicle hardware,
Journal of Composite Materials, 45: 4; 437-458.
8. Hart-Smith, L.J. (1992). The ten-percent rule for preliminary sizing of fibrous composite
structures. Weight Engineering, 52: 2; 29-45.
9. Horton, R.E., Whitehead, R.S. et. al. (1988). Damage tolerance of composites, Vol. I,
AFWAL-TR-87-3030.
10. Han, H.T., Mitrovic, M. and Turkgene, O. (1999). The effect of loading parameters on
fatigue of composite laminates: Part III. DOT/FAA/AR–99/22.
11. Hart-Smith, L.J. (2005). An account of one engineer’s long term involvement with
aerospace applications of composite structures, Part I: Analytical Developments. Boeing
paper PWDM05-0089.
12. Flaggs, D.L. and Kural, M.H. (1982). Experimental determination of the in situ
transverse lamina strength in graphite/Epoxy laminates, Journal of Composite Materials,
16: 103-116.
13. Tsai, S.W. and Melo, J.D. (2015). Composite materials design and testing, Unlocking the
mystery with invariants. ISBN: 978-0-9860845-1-5.
14. Nettles. A.T. (2014). Notched compression strength of 18-ply laminates with various
percentages of 0° plies, Journal of Composite Materials, 49: 4; 495-505.
15. Marlett, K. (2011). Hexcel 8552 IM7 Unidirectional Prepreg 190 gsm and 35% RC
Qualification Material Property Data Report, National Institute for Aviation Research
Report CAM-RP-2009-015.
