
Wine Australia
WINE CHANNEL PURCHASE BEHAVIOUR OF AUSTRALIAN WINE CONSUMERS
MAIN REPORT
Project Management
1

Contents
Background and objectives 3
Subscription service/wine club –
Winery owned deep dive
35
Key findings 4
Subscription service/wine club –
Independent deep dive and
comparison with winery owned
41
Demographics 6 Winery website deep dive 48
Frequency and spend
characteristics
7
Online retailer deep dive and
comparison with winery wine club
53
Wine purchasing channels 12 Barriers to buying online 59
Changes in wine purchasing
behaviour
17 Methodology 63
Cellar door deep-dive 27
2
Project Management
1
2
3
4
5
6
7
8
9
10
11
12
13

Background and objectives
3
Project Management
The outcome of this research is to provide
practical suggestions for wine producers to
consider when developing retail channel
strategies.
Specifically, it will explore the different
purchasing channels with a particular focus on
buying wine:
• in person from a cellar door / winery during a
visit
• through subscription services with a winery or
an independent retailer, and
• online through a winery website or other
online alcohol retailer websites.
For each of the channels in focus, it is important
to understand the following:
• previous channel purchasing
• how often are consumers using the channel to
purchase wine
• how much wine they are purchasing through
the channel
• how much they are spending through the
channel
• what their motivations are for using the channel
• frustrations they have with using the channel,
and
• suggestions as to what could be helpful to them
to use the channel more.
Since COVID-19, there has been considerable change to the way that consumers purchase wine, and it is uncertain as to
what extent the impact has been made on changing consumer behaviour in the long term.

Key findings
4
Project Management
Nearly all channels experienced a decrease in frequency of use in 2020 given the
extensive disruption that COVID-19 had on people’s ability to purchase wine (p 18).
Some respondents noted that they weren’t drinking as much or had budget constraints
(p 24-25). Others noted that they had shifted to online channels (p 56) because of
COVID-19. The transition to online for many is expected to continue going forward (p 18).
1
2
The most commonly used channels to purchase wine in Australia in 2019 was in person at
the bottle shop / drive through, followed by in person at the cellar door and thirdly through
online retailers. Only in 2020 did online retailers become the second most popular channel;
however, this is expected to move back into third place once cellar doors reopen and
travel returns (p 13).
There is an opportunity for wineries to increase direct to consumer purchases by focusing
on exclusivity. This was evident at the cellar door with a third believing that it would
encourage them to purchase (p 32), especially when some are doing price comparisons
whilst there (p 33). This was also a point of difference to be explored between winery
owned wine clubs compared to other clubs (p 47), and winery websites compared to
online retailers (p 57).
3

Key findings continued
5
Project Management
When compared to online retailer websites, a higher proportion indicated that assistance
with using the winery website would improve their ability to purchase wine (p 57). Where
possible, wineries should review their websites to improve the customer journey. This would
include from first landing on the site, finding the information they need and the ease in
making a purchase. This is especially important, with one-third of respondents giving up if
they run into difficulties whilst buying online (p 61).
4
5
Most respondents are happy to pay a tasting fee whilst at the cellar door as long as it is
considered to offer value for money, and they are provided with a positive experience (p
31, 33).
Staying connected with a winery is important to some as they chose to join wine clubs or
buy direct from the winery website to support local businesses. Interestingly, subscriptions
services such as Naked Wines also deliver on this desire (p 45, 46). That connection is also
important at the cellar door (p 33).
6
Around a half did not buy wine at all online since 2019. This is despite three quarters being
confident in using the internet to make purchases, with the majority buying other items
online. Whilst there are many that will not change their minds to using this channel to
purchase wine, there are some issues that could be addressed. Some of these include;
concerns about damages through delivery or not knowing which website to buy from
(p 62).
7

Demographics of respondents
6
Project Management
53.7%
46.1%
0.2%
34%
25%
20%
8%
9%
1%
3%
n=1,007 – Australian wine drinkers who purchase wine
Age groups
Household income before tax
Highest level of education
Gender
Reside

Frequency and
spend
CHARACTERISTICS
7

Regularity of wine consumption by age and location
8
Project Management
Two-thirds (67%) of respondents consume wine regularly during the week.
There are no significant differences in the frequency of consumption between states or territories. By age, 21% of people surveyed aged over 55
report drinking wine less than once per month, higher than the 15% on average reportedly drinking it this often.
S4. How often do you consume wine?
Base: Wine-drinking Australians n=1007 (18-34 n=280, 35-54 n=372, 55+ n=355; NSW and ACT n=342, Victoria n=253, Queensland
n=202, South Australia n=80, Western Australia n=90, Northern Territory n=10*, Tasmania n=30
14
12
12
17
15
13
14
16
10 10
7
30
33
29
29
29
31
35
26
24
40
27
23
22
28
19
25
24
17
19
32
20
30
17
21
17
14
16
19
17
18
21
20
13
15
12
13
21
15
13
18
21
12
10
23
TOTAL 18-34 35-54 55+ NSW & ACT VIC QLD SA WA NT* TAS
Most days/every day 2-5 times a week About once a week 1-3 times a month Less than once per month
%
Significance two tailed test of difference by segment
[ / significantly less/more than the total sample]
*Caution: small base

Typical spend on wine by age and location
9
Project Management
A1. How much do you typically spend on wine every month?
Base: Wine-drinking Australians n=1007 (18-34 n=280, 35-54 n=372, 55+ n=355; NSW and ACT n=342, Victoria n=253, Queensland
n=202, South Australia n=80, Western Australia n=90, Northern Territory n=10*, Tasmania n=30
When it comes to typical monthly spending on wine, Australians aged over 55 appear to not only have a higher tendency to spend
the least on wine each month (11% compared to 8%), but there is also a higher tendency to spend $100 or more compared to the
average (12% compared to 9%). Additionally, significantly fewer people over 55 are in the mid-range of spending, with 14%
spending $20–$29.99 per month compared to 19%. Again, no significant differences are found when comparing regional wine
expenditure.
8
5
6
11
9
7
7
8
4
10
17
15
16
14
15
11
17
17
19
18
17
14
16
12
13
15
13
14
9
18
10
0
19
25
21
14
20
20
19
18
17
20
27
18
18
19
19
18
16
19
19
21
30
20
17
14
19
17
18
18
15
18
13
20
17
9
6
9
12
10
9
7
11
9
10
3
TOTAL 18-34 35-54 55+ NSW & ACT VIC QLD SA WA NT* TAS
<$10 $10 to $14.99 $15 to $19.99 $20 to $29.99 $30 to $49.99 $50 to $99.99 $100 or more
%
Significance two tailed test of difference by segment
[ / significantly less/more than the total sample]

14
13
15
13
12
12
18
26
8
30
22
23
28
35
36
37
26
26
23
22
17
28
17
24
25
33
27
17
15
23
14
22
14
12
13
26
15
28
21
16
14
13
7
3
14
TOTAL Under $20,000 $20,000 -
$49,999
$50,000 -
$79,999
$80,000 –
$99,999
$100,000 -
$149,000
$150,000 -
$199,000
$200,000+ Prefer not to
say
Most days / every day 2-5 times a week About once a week 1-3 times month Less than once per month
Regularity of wine consumption by household income
10
Project Management
Compared to the average, respondents earning $200,000 or more were more likely to be regular wine consumers during the week (overall 85%
compared to 67% overall). This was similar to those with a household income before taxes between $150,000–$199,000 (81%). Those earning less
than $50,000 have a tendency to drink wine less regularly.
S4. How often do you consume wine?
Base: Wine-drinking Australians n=1007 (Household income before taxes - Under $20,000 n=54, $20,000-$49,999 n=189, $50,000-
$79,999 n=234, $80,000-$99,999 n= 125, $100,000 - $149,000 n=201, $150,000-$199,000 n=99, $200,000+ n=39, Prefer not to say n=66)
%

8
20
13
8
7
5
2
3
5
15
30
22
12
15
14
4
5
15
14
15
14
14
14
12
9
5
24
19
9
17
26
20
19
17
8
24
18
24
18
15
18
19
25
18
17
17
0
10
16
20
22
26
31
9
9
2
6
10
6
8
16
31
6
TOTAL Under $20,000 $20,000 -
$49,999
$50,000 -
$79,999
$80,000 –
$99,999
$100,000 -
$149,000
$150,000 -
$199,000
$200,000+ Prefer not to
say
<$10 $10 to $14.99 $15 to $19.99 $20 to $29.99 $30 to $49.99 $50 to $99.99 $100 or more
Typical spend on wine by household income
11
Project Management
Not surprisingly, those in the higher household income bracket i.e. $150,000 plus are spending more on wine each month – typically $50–$99.99
(26% compared to 17%) but even more so for $100 or more (31% compared to 9%). Those in the lower household income brackets are more
likely to spend under $15 each month while those in the middle-income brackets are more likely to spend $20–$29.99. It is important to take into
consideration that the overall proportion of respondents with a household income over $150,000 represented 14% of the total sample.
A1. How much do you typically spend on wine every month?
Base: Wine-drinking Australians n=1007 (Household income before taxes - Under $20,000 n=54, $20,000-$49,999 n=189, $50,000-
$79,999 n=234, $80,000-$99,999 n= 125, $100,000 - $149,000 n=201, $150,000-$199,000 n=99, $200,000+ n=39, Prefer not to say n=66)
%

Wine purchasing
channels
12

Channel mix for purchasing wine
13
Project Management
A2. Which of the following channels did you purchase wine from in 2019?
A2. Which of the following channels did you purchase wine from in 2020?
B3. Over the next 12 months, how often do you plan on using the following channels?
Base: Wine-drinking Australians n=1007
• The most commonly-used channel of wine
purchasing was in-store; 96% of wine-
drinking Australians surveyed purchased
wine on at least one occasion at a local
bottle shop, drive-through or similar store
in 2019. A small decline was experienced
in 2020 to 94%, which is expected not to
change in the future.
• Bottle shops are popular because people
like to see the wine, its easy and
convenient. The 2 percentage point drop
in 2020 was mostly due to concerns about
COVID-19 and restrictions.
• 2020 saw a reduction in wine purchasing
across most channels except for online
retailers e.g. Dan Murphy’s.
%
19
18
18
20
27
40
49
96
17
17
16
20
23
40
39
94
17
17
18
20
26
43
47
94
Winery
telemarketing
Winery email
Winery wine club
Non winery wine
club
Winery online
Online retailers
Cellar door
Bottle shop
Future
2020
2019

Channel mix for purchasing wine in 2019
14
Project Management
A2. Which of the following channels did you purchase wine from in 2019? Mean calculated based on the following - Never (0), 1-2 times (2), 3-5 times (4), 6-8
times (7), >8 times (8). Base: Wine-drinking Australians n=1007
% Never 1-2 times 3-5 times 6-8 times
more than
8 times
At least
once
Mean
In person – local bottle shop, drive-
through etc
4 24 21 14 37
96
5.3
In person –
from a cellar door / winery during a visit
51 31 9 4 5
49
1.6
Online -
through an online retailer (including bottle shop
websites) that isn’t a winery (e.g. Dan Murphy’s)
60 20 11 5 5
40
1.5
Online –
through a cellar door / winery’s own website
(through the online shopping cart)
73 16 7 2 2
27
0.9
Subscription service / wine club with an independent
company e.g. The Wine Society, Qantas wine club or
Naked Wines
80 11 7 2 1
20
0.7
Mailing list –
when a winery calls you directly
81 11 5 2 1
19
0.6
Mailing list –
through an email sent from the winery
82 11 4 2 1
18
0.6
Subscription service or wine club –
with a cellar door/winery
82 10 5 1 1
18
0.6
In addition to being the most commonly-used method of purchasing wine in 2019, in-person shopping was undertaken on the most
occasions by Australian wine drinkers surveyed; 37% purchased wine in-store from a bottle shop or drive-through more than 8 times in
2019. Other channels were undertaken less often, and on fewer occasions. Cellar door visits were the second-most common way to
purchase wine, though 31% reported only doing so once in the year.

Channel mix for purchasing wine in 2020
15
Project Management
A2. Which of the following channels did you purchase wine from in 2020? Mean calculated based on the following - Never (0), 1-2 times (2), 3-5 times (4), 6-8
times (7), >8 times (8). Base: Wine-drinking Australians n=1007
In 2020, in-person wine purchases from local bottle shops and drive-throughs remained the top channel, undertaken by 94% of wine-
drinking Australians surveyed, an average number of 5 times. For the second-most common channel, 2020 saw online wine retailers
overtaking cellar door / winery purchases, both in terms of the average number of times wine was purchased, and the number of
Australians that purchased there, resulting in an increase in the mean from 1.6 to1.7 times. The change in popularity was due to a decrease
in in-person winery and cellar door purchases, down from 49% to 39%, with an average number of purchases of 1.6 to 1.3, likely influenced
by lockdowns and travel restrictions. Online winery websites also saw a decrease, from 27% purchasing at least once in 2019, to 23% in 2020.
% Never 1-2 times 3-5 times 6-8 times
more than
8 times
At least
once
Mean
In person – local bottle shop, drive-
through etc
6 27 21 13 33
94 5.0
Online -
through an online retailer (including bottle shop
websites) that isn’t a winery (e.g. Dan Murphy’s)
60 16 13 4 7 40 1.7
In person –
from a cellar door / winery during a visit
61 25 8 3 3 39 1.3
Online –
through a cellar door / winery’s own website
(through the online shopping cart)
77 12 6 3 3 23 0.9
Subscription service / wine club with an independent
company e.g. The Wine Society, Qantas wine club or
Naked Wines
80 11 5 2 1 20 0.7
Mailing list –
when a winery calls you directly
83 8 5 2 1 17 0.6
Mailing list –
through an email sent from the winery
83 10 4 2 1 17 0.6
Subscription service or wine club –
with a cellar door/winery
84 8 5 2 1 16 0.6

Channel mix for purchasing wine going forward
16
Project Management
B3. Over the next 12 months, how often do you plan on using the following channels? Mean calculated based on the following - Never (0), 1-2 times (2), 3-5
times (4), 6-8 times (7), >8 times (8). Base: Wine-drinking Australians n=1007
Over the next 12 months, in-person wine purchases from local bottle shops and drive-throughs will continue to be the top channel, 94% of
wine-drinking Australians surveyed, an average number of 5 times. What’s changing though is with lockdown restrictions ending,
respondents anticipate returning to cellar doors and making purchases (up from 39% in 2020 to 47%). More also anticipate using online
retailers more often (up from 40% in 2020 to 43%).
% Never 1-2 times 3-5 times 6-8 times
more than
8 times
At least
once
Mean
In person – local bottle shop, drive-
through etc
6 25 24 14 32
94 5.0
Online -
through an online retailer (including bottle shop
websites) that isn’t a winery (e.g. Dan Murphy’s)
57 18 13 5 8 43 1.8
In person –
from a cellar door / winery during a visit
53 31 10 3 3 47 1.5
Online –
through a cellar door / winery’s own website
(through the online shopping cart)
74 14 7 3 2 26 0.9
Subscription service / wine club with an independent
company e.g. The Wine Society, Qantas wine club or
Naked Wines
80 11 6 2 2 20 0.7
Mailing list –
when a winery calls you directly
83 9 5 2 1 17 0.6
Mailing list –
through an email sent from the winery
83 10 4 2 1 17 0.6
Subscription service or wine club –
with a cellar door/winery
82 10 5 2 1 18 0.6

Changes in
WINE PURCHASING BEHAVIOUR
17

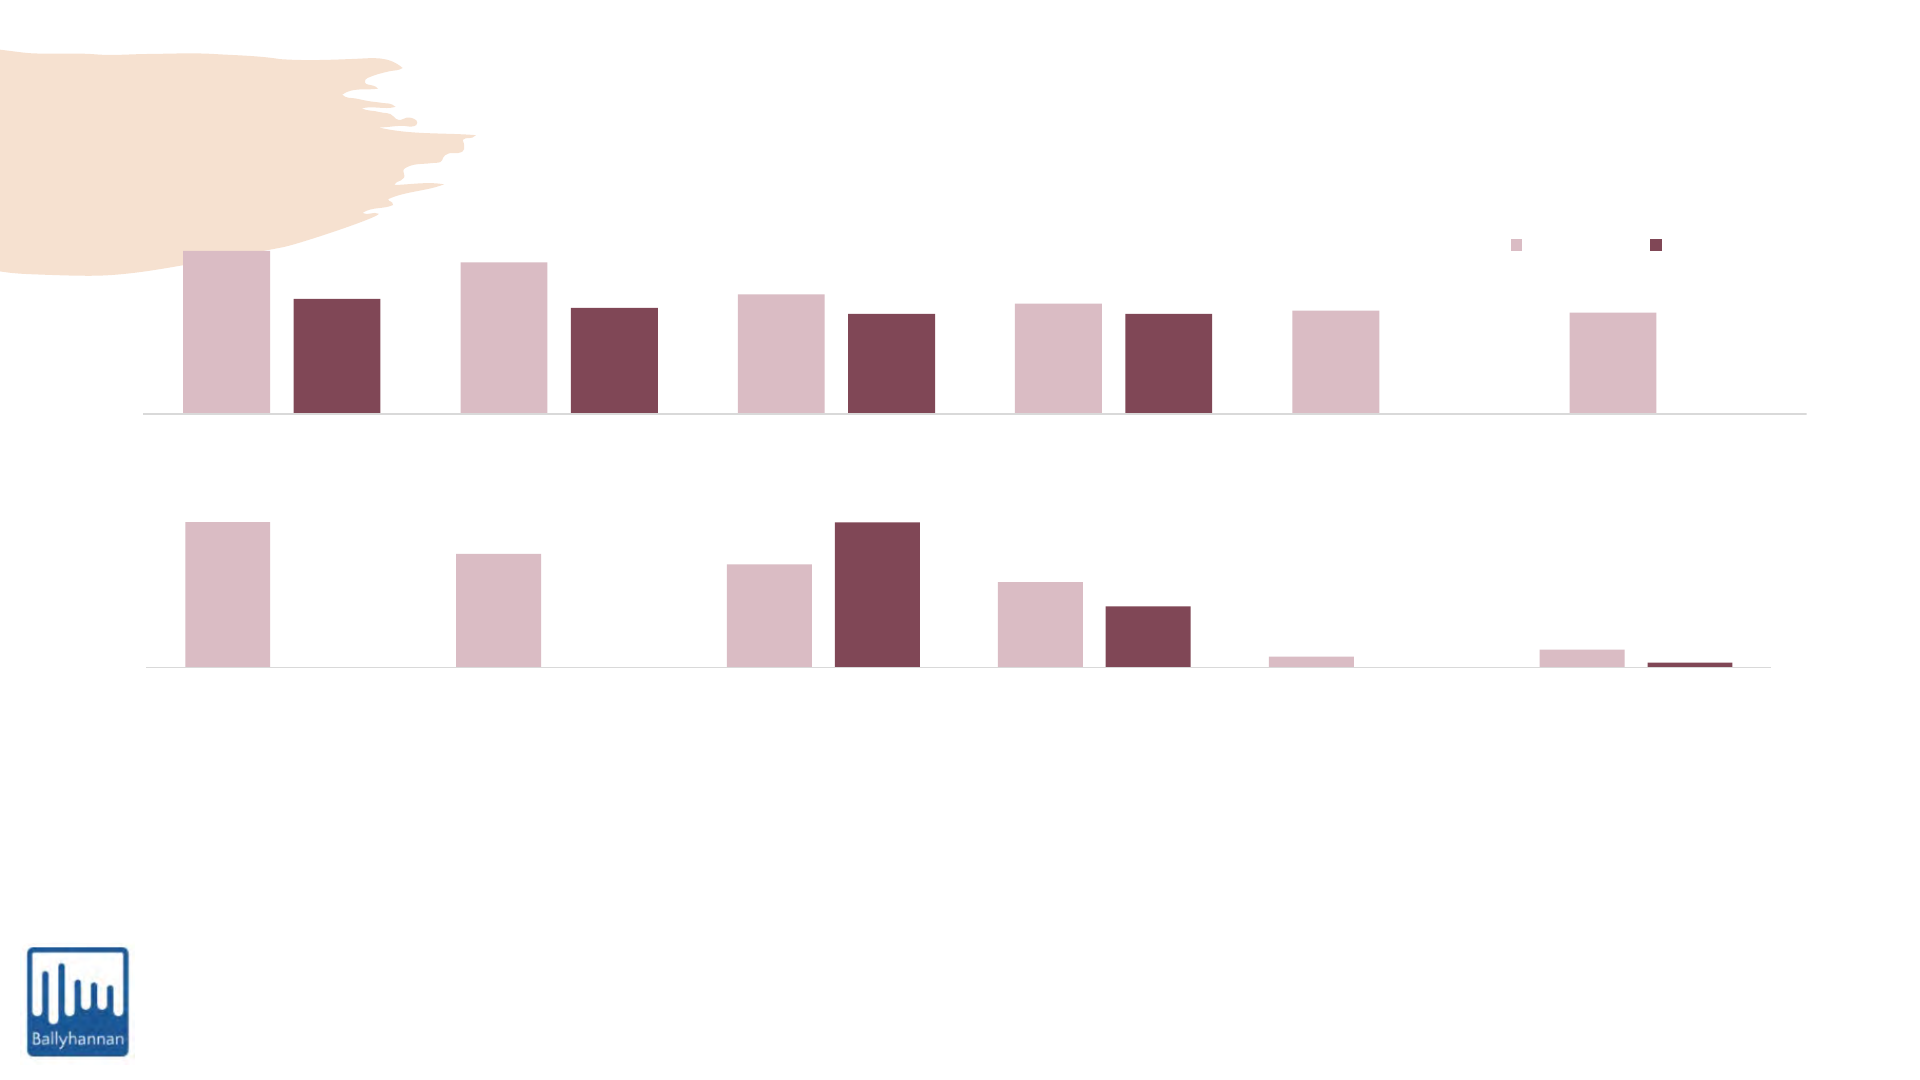
Change in purchase behaviour for the channels
18
Project Management
A2. Which of the following channels did you purchase wine from in 2019? A3. Which of the following channels did you purchase wine from in 2020? B3. Over the next 12
months, how often do you plan on using the following channels?
Base: Australian wine drinkers that purchased wine in each of the channels n=1,007
Cellar doors as a wine purchasing channel were greatly impacted in 2020 as a result of COVID-19 restrictions with the
percentage of those that used the channel much lower than in 2019. But going forward respondents were keen to return.
It is interesting to note that nearly all channels experienced a decrease in frequency of use in 2020, with many noting that
they weren’t drinking as much. While the proportion of respondents who purchased through a winery website declined in
2020, the proportion of those using online retailers was steady. Both are expected to grow further over the next 12
months.
-12
-10
-8
-6
-4
-2
0
2
4
6
8
10
Bottle shop Cellar door Direct call Direct mail Winery owned
wine
club/subscription
service
Other
subscription
service
Winery website Online retailer
Change from 2019 to 2020 Change from 2020 to next 12 months
Percentage point change in channels used
(%)

9
9
9
10
10
13
10
13
9
19
19
29
32
30
33
32
32
28
18
18
22
23
21
22
20
21
21
19
19
18
14
16
16
16
19
18
16
16
12
10
10
7
8
9
13
19
19
10
11
12
9
14
5
11
Total Bottle shop Cellar door Direct call Direct mail Winery owned
wine
club/subscription
service
Other subscription
service
Winery website Online retailer
18-24
25-34
35-44
45-54
55-64
65 and over
Users of each channel by age bracket in 2019
19
Project Management
A2. Which of the following channels did you purchase wine from in 2019?
Base: Australian wine drinkers that purchased wine in each of the channels 1-2 times, 3-5 times, 6-8 times, >8 times
Younger respondents were more likely to purchase wine through non-brick and mortar
channels compared to the average. Those aged between 25–34 years and 35–44 years had a
greater tendency to purchase wine online in 2019. In 2020, a higher proportion of 25–34 years
were purchasing wine when wineries called them directly or sent an email, but this is not
expected to continue going forward.
%

33
34
35
41
42
45
41
38
37
25
25
26
19
22
23
24
26
26
20
20
15
14
13
13
13
14
18
9
9
10
9
8
6
7
7
7
8
8
9
10
9
8
8
9
5
3
3
3
4
4
3
3
4
4
Total Bottle shop Cellar door Direct call Direct mail Winery owned
wine
club/subscription
service
Other subscription
service
Winery website Online retailer
NSW
VIC
QLD
WA
SA
TAS
ACT
NT
Users of each channel by state
20
Project Management
A2. Which of the following channels did you purchase wine from in 2019?
Base: Australian wine drinkers that purchased wine in each of the channels 1-2 times, 3-5 times, 6-8 times, >8 times
Those residing in NSW are more likely than the average to purchase wine through non-bricks
and mortar channels in 2019. This increased in 2020, however only purchasing online is
expected to be used more going forward. Victorians expect to be using all channels more
than they were back in 2019.
%

8
7
5
8
8
4
5
5
8
20
20
15
16
14
18
15
19
16
25
25
20
18
18
20
18
17
20
35
35
43
38
40
37
42
43
42
11
12
15
19
19
19
18
15
13
0.8
0.7
1.0
1.1
0.5
1.1
0.5
0.7
0.7
Total
Bottle shop
Cellar door
Direct call
Direct mail
Winery
owned wine
club/subscrip
tion service
Other
subscription
service
Winery
website
Online
retailer
Primary school
Some secondary school
Completed secondary school
No formal schooling
Trade or technical qualification
University diploma or degree
Postgraduate
Prefer not to say
Level of education for users of each channel
21
Project Management
A2. Which of the following channels did you purchase wine from in 2019?
Base: Australian wine drinkers that purchased wine in each of the channels 1-2 times, 3-5 times, 6-8 times, >8 times
Respondents with a university education are strongly represented across all wine purchasing
channels but are more likely to purchase wine at the cellar door, online and from subscription
services.
%

Reasons for using channel more
22
Project Management
B4. What are the reasons for you using [channel] more to purchase wine?
In person – local bottle shop,
drive-through etc.
• Convenient, live near a shop
• Easy to buy
• Like to browse
In person – from a cellar door /
winery during a visit.
• Hoping to travel again, restrictions permitting
• Because people like going to wineries
• Convenient and easy for those living near wine regions
• Like the choice, variety and high quality
Mailing list – when a winery calls
you directly.
• Because of lockdown/restrictions
• Convenient
• Good deals
Mailing list – through an email
sent from the winery.
• Because of lockdown/restrictions
• Easy to use and access
• Convenient
• Trusted supplier
• Good variety and cheaper prices

Reasons for using channel more, continued
23
Project Management
B4. What are the reasons for you using [channel] more to purchase wine?
Subscription service or wine club –
with a cellar door/winery.
• Because of lockdown/restrictions
• Convenience
• Wines are good value and can get discounts, rewards and special deals
• Like trying new wines
• Deliver direct to residence and good service attitude
Subscription service/wine club
with an independent company
e.g. The Wine Society, Qantas
wine club or Naked Wines.
• Allows access to wines not at bottle shops
• Good deals, choices and service
• Convenient and easy
• Good pricing and cheap freight
• Contactless
• Use reward points
Online – through a cellar door /
winery’s own website (through the
online shopping cart).
• Because of lockdown/restrictions
• Convenience
• Contactless
• Easy to use / access
• Wanted to buy wine after visiting the winery
• Can take my time / compare prices
• Support local business
• New releases / new flavours / good wines
• Promotion / offers
Online - through an online retailer
(including bottle shop websites)
that isn’t a winery (e.g. Dan
Murphy’s).
• Because of lockdown/restrictions
• Convenience
• Contactless
• Easy to use / access
• Like the discounts and special offers
• Good selection at reasonable prices
• Free delivery

Reasons for not using channel or using less
24
Project Management
B5. What are the reasons for you using [channel] less to purchase wine?
B6. What are the reasons for not purchasing wine through [channel]?
In person – local bottle shop,
drive-through etc.
• Risk associated with COVID-19
• Restrictions / lockdowns
• Drinking less
• Moved to online
• Less spare money to buy wine
In person – from a cellar door /
winery during a visit.
• Unknown when restrictions are easing
• Not planning to visit/not convenient
• Have had a bad experience in the past
• Drinking less
• Prefer using other channels
• Wineries are expensive
Mailing list – when a winery calls
you directly.
• Cheaper at bottle shops, can’t afford it at the time they call
• Don’t like being on mailing lists
• Don’t like pushy sales people
• Wines on offer aren’t attractive, small variety offered
• Unknown about how the wine tastes
• Paying for shipping can be expensive and delivery can be slow
• Prefer other channels better, not interested in using this channel
Mailing list – through an email
sent from the winery.
• Do not deal with wineries
• Prefer other channels i.e. buying in person
• Don’t send emails of the wines I like
• Ignore when too many emails are sent
• Winery closed down during COVID-19 lockdown
• Afraid of scams

Reasons for not using channel or using less, continued
25
Project Management
B5. What are the reasons for you using [channel] less to purchase wine?
B6. What are the reasons for not purchasing wine through [channel]?
Subscription service or wine club –
with a cellar door/winery.
• Expensive / can’t afford / not considered value for money
• Delivery concerns / too slow / damaged
• Drinking less / rationalising purchases / budget limitations
• Don’t want to use this channel, prefer using other channels
• Don’t always want the scheduled wine / or be locked in
• Potential to buy too much wine
• Too many emails / feel harassed
Subscription service/wine club with
an independent company e.g. The
Wine Society, Qantas wine club or
Naked Wines.
• Not preferred channel / never considered using
• Concerned about quality of wine
• Want to save money
• Want to drink less / concerned will buying too much / don’t drink enough to subscribe
• Too expensive / can’t afford
• Don’t want to commit
• Concerned about long delivery wait times
Online – through a cellar door /
winery’s own website (through the
online shopping cart).
• Prefer other channels
• Like to buy in person / get advice / try first
• Expensive / budget constraints
• Don’t need to
• Buying less wine
• Delivery concerns / too slow / expensive
• Not convenient
Online - through an online retailer
(including bottle shop websites) that
isn’t a winery (e.g. Dan Murphy’s).
• Don’t like paying delivery fees
• Like to buy in person / get advice / try first
• Don’t always have wine of choice
• Drinking less during COVID-19
• Bad experience with wine purchased as it did not taste nice

Channel deep dive
26

Purchasing wine
in-person
CELLAR DOOR
27

Average quantity purchased at the cellar door
28
Project Management
You indicated that you have purchased wine, in person – from a cellar door / winery during a visit. The following questions are
focused on this channel. [S/R]
CB1. On average, how many bottles do you purchase per transaction through this channel?
Base: Wine-drinking Australians that bought wine at a winery / cellar door in 2019-2020 n=317 (18-34 n=127, 35-54 n=113, 55+ n=77)
13
36
17
9
5
12
4
3
18
36
18
9
6
9
1
3
11
34
20
10
6
9
7
4
6
39
12
6
4
22
6
4
1 bottle 2 bottles 3 bottles 4 bottles 5 bottles 6 bottles 7-12 bottles More than 12
bottles
TOTAL 18-34 35-54 55+
%
Mean
2.93
Mean
3.40
Mean
3.74
Mean
3.29
Significance two tailed test of difference by segment
[ / significantly less/more than the total sample]
Overall, half of respondents purchased 2 to 3 bottles whilst at a cellar door. While this was the
same for those aged 55 and above, this segment were significantly more likely to purchase 6
bottles compared to the total. Only a small percentage buy more than a dozen bottles.

4
19
25
26
14
9
3
4
17
24
29
13
9
4
3
16
24
27
18
10
4
5
26
29
19
10
9
1
>$10 $10 - $14.99 $15 - $19.99 $20 - $24.99 $25 - $29.99 $30 - $49.99 $50 or more
TOTAL 18-34 35-54 55+
Typical spend at the cellar door
29
Project Management
You indicated that you have purchased wine, in person – from a cellar door / winery during a visit. The following questions are
focused on this channel. [S/R]
CB2. What is the average price you pay per bottle when you are at the cellar door?
Base: Wine-drinking Australians that bought wine at a winery / cellar door in 2019-2020 n=317 (18-34 n=127, 35-54 n=113, 55+ n=77)
%
The split between paying less than $20 versus $20 or more is relatively even (48/52).
Those aged 55 and above however typically will spend less than $20 a bottle (60/40)
while those aged 35–54 will spend more (42/58).
Overall, the two most common price brackets are $15–$19.99 and $20–$24.99

Reasons for buying wine at the cellar door
30
Project Management
You indicated that you have purchased wine, in person – from a cellar door / winery during a visit. The following questions are
focused on this channel. [M/R]
CB3. What are your reasons for buying from the cellar door?
Base: Wine-drinking Australians that bought wine at a winery / cellar door in 2019-2020 n=317
%
The appeal of visiting wineries and making a purchase is directly associated with the social interaction
through talking with staff and getting recommendations (28%), and tasting the wine at the cellar
door(39%). Respondents also appreciated providing support to businesses and buying directly from the
winery (32%).
However, respondents are less likely to use this channel when it comes to getting discounts or price
transparency.
39
32
28
26
25
24
I like to try before I buy I like buying directly from
the winery
I like to get
recommendations from
the winery staff
Special offers Convenience Better value for money
23
23
17
14
14
3
Wines I want not available
elsewhere
Better range Price transparency Discounts on volume I trust this channel more
than others
Don’t know / unsure

Feelings towards tasting fees at the cellar door
31
Project Management
You indicated that you have purchased wine, in person – from a cellar door / winery during a visit. The following questions are
focused on this channel. [M/R]
CB5. How do you feel about paying a tasting fee at the cellar door?
Base: Wine-drinking Australians that bought wine at a winery / cellar door in 2019-2020 n=317 (18-34 n=127, 35-54 n=113, 55+ n=77)
%
The majority of respondents that purchased wine at a cellar door are happy to pay for a tasting
fee, but only of it is a reasonable price and/or offers value for money.
Of the quarter (27%) that are not willing to pay a tasting fee, this was mostly driven by those aged
55 and above.
42
39
27
14
5
50
41
22
17
2
38
40
23
16
8
32
35
42
8
6
I am happy to pay a tasting
fee if it’s a reasonable
amount e.g., less than $10
per person
I am happy to pay a tasting
fee only if it is redeemable
e.g. I get value for money or
the amount is deducted
from a purchase
I am not willing to pay a
tasting fee
I like to book and pay for a
seated tasting
Don't know/Other
TOTAL 18-34 35-54 55+

Areas for improvement
32
Project Management
You indicated that you have purchased wine, in person – from a cellar door / winery during a visit. The following questions are
focused on this channel. [M/R]
CB6. What could be put in place to improve this channel for purchasing wine?
Base: Wine-drinking Australians that bought wine at a winery / cellar door in 2019-2020 n=317
%
To improve wine purchasing from cellar doors, 49% of respondents surveyed feel that the wine on
sale could be more competitively priced. Additionally, 33% feel selling wines exclusive to the cellar
door and having a better experience would improve wine purchasing at wineries and cellar doors.
This is interesting when compared to the motivations for using the channel as it was less likely used to
get discounts and only around a quarter used it to buy wine exclusive to the cellar door.
49
33
33
32
22
10
1
Wine is more
competitively priced
Winery provides a
better cellar door
experience
Wine is exclusive to
the cellar door
Bigger range Improved service
Don’t know / unsure
Other

A look at the cellar door experience
33
Project Management
Base: In-depth interviews of Australian wine drinkers that have visited a cellar door/winery in the last 6 months, n=20
Visiting
When planning to visit, respondents local to an area would generally go with friends and
/ or family after conducting Google searches on the day to see what was open. The
decisions of which wineries to go to was generally decided by consensus of the group
based on if they have a restaurant/cafe, offer activities, the brand, accessibility of
location (i.e. easy access along main routes) and opening times. When in location, some
respondents said recommendations from other wineries were important, as this may
drive them off their planned route. When respondents were not local to the area, they
may go to tourism offices for recommendations.
Most respondents were happy to pay a tasting fee if the price was reasonable, offered
value for money, received a price reduction off purchased wine, or they were provided
something in return. Notably, demographics were a contributing factor with lower
income earners requesting discounts and/or gifts; whilst higher income earners wanted
an experience, older vintages or exclusive wines only sold at the cellar door.
Tasting
fees
Some respondents conducted price comparisons to see if they could purchase cheaper
from a retailer.
Price
checks

A look at the cellar door experience, continued
34
Project Management
Base: In-depth interviews of Australian wine drinkers that have visited a cellar door/winery in the last 6 months, n=20
Experie
nces
The majority of respondents said that a large proportion of their decision to purchase/not
purchase at the cellar door was based on the staff. Positive interactions included staff
having knowledge about the wine, conversations between staff/consumers and being
personable. This would see consumers purchase >2 bottles based on the experience.
However negative experiences; no knowledge of wine, not being looked after and/or
forgotten about, may see no purchases or 1-2 bottles only to support the time of the staff
and not the cellar door.
Reliable delivery was a concern as it is generally believed that cellar doors delivery is nor
reliable and takes too long.
Exclus
ivity
Several consumers were looking for special packaging, special releases, older vintage,
or wines that they could not get at a retailer.
Delivery

Subscription
service/wine club
WINERY OWNED
35

Average quantity delivered through winery service
36
Project Management
You indicated that you have purchased wine through a subscription service or wine club- with a cellar door/winery. The following
questions are focused on this channel. [S/R]
CE2. On average, how many bottles are provided in a club pack or in your delivery?
Base: Wine-drinking Australians that bought wine through a subscription service with a winery / cellar door in 2019-2020 n=119 (18-
34 n=49, 35-54 n=48, 55+ n=22*)
%
The number of bottles delivered to those that had purchased wine through a wine club or winery
subscription service varied with 4 bottles, half a dozen and 7–12 bottles in a delivery being the most
common amounts. Fewer were receiving more than a dozen.
3
8
10
22
13
18
21
5
1 2 3 4 5 6 7-12 More than 12
*Small sample, only total shown.

Annual spend per delivery through winery subscription
service/wine club
37
Project Management
You indicated that you have purchased wine through a subscription service or wine club- with a cellar door/winery. The following
questions are focused on this channel. [S/R]
CE3. How much is your annual spend per delivery with the wine club each year?
Base: Wine-drinking Australians that bought wine through a subscription service with a winery / cellar door in 2019-2020 n=119
%
Around a quarter (23%) tend to spend between $200–$249 a year on their winery subscription service/wine
club. Almost half (48%) of this is made up of 18–34 years and 70% have a household income before taxes of
$80,000 or more. For the 18% spending $300 or more they were mostly from NSW/VIC, aged between 35–54
years and earning $80,000 plus a year.
*Small sample, only total shown.
10
14
18
23
14
18
2
Under $100 $100 - $149 $150 - $199 $200 -$249 $250 - $299 $300 or more
Don’t know / unsure

Reasons for buying wine through winery subscription service
38
Project Management
You indicated that you have purchased wine through a subscription service or wine club- with a cellar door/winery. The following
questions are focused on this channel. M/R]
CE4. What are your reasons for using this channel?
Base: Wine-drinking Australians that bought wine through a subscription service with a winery / cellar door in 2019-2020 n=119
%
Special offers, convenience and value for money are the key motivations for purchasing wine through this
channel.
*Small sample, only total shown.
35
32
29
28 28
26
Special offers Convenience Better value for money Better range Price transparency I like buying directly from
the winery
26 26
18 18
11
1
Wines I want not available
elsewhere
Discounts on volume I like to try before I buy I like to get
recommendations from
the winery staff
I trust this channel more
than others
Other

Reason for joining and level of customisation
39
Project Management
You indicated that you have purchased wine through a subscription service or wine club- with a cellar door/winery. The following
questions are focused on this channel.
CE6. Do you prefer being able to choose your own wines or have them chosen for you? CE7, What are the main reasons for joining
a winery’s wine club?
Base: Wine-drinking Australians that bought wine through a subscription service with a winery / cellar door in 2019-2020 n=119
%
For those that use wine clubs, being able to
provide flexibility in the order is important with
more than half (55%) wanting the ability to
choose their own wines while another 39% want
the option to customise when they want to vary
from the set pack.
*Small sample, only total shown.
15
28
39
55
I like to choose my own wines
I like to have set packs but be
able to customise them if I want
to
I like to have wines chosen for me
– set packs
I have no preference either way
Preference for customisation
n=119 (%)
Reasons for joining winery subscription service
n=119 (%)
Most users of this channel joined because they
wanted to stay connected with the winery and
support local businesses.
A good portion also joined whilst at the cellar
door because they were asked or so they could
get a discount.
37
37
39
40
Signed up to get an initial discount
at the cellar door
Want to support local businesses
Was asked to join whilst at the
cellar door for a tasting
Want to stay in touch with the
winery and see their latest offers

Areas for improvement for winery subscriptions
40
Project Management
You indicated that you have purchased wine through a subscription service or wine club- with a cellar door/winery. The following
questions are focused on this channel. [S/R]
CE8. What could be put in place to improve this channel for purchasing wine?
Base: Wine-drinking Australians that bought wine through a subscription service with a winery / cellar door in 2019–2020 n=119
%
Free delivery was the main suggestion for improvement for almost half of respondents. Improving value for
money through better deals and extras/treats were also popular options for over a third of those using this
channel.
*Small sample, only total shown.
46
35
34 34
33
28
27
23
4
2
Free delivery More deals Easier ordering
process
Extras/treats
included in
delivery
Bigger range Faster delivery
timings
More reliable
delivery timings
More
information to
help me
choose which
wine to buy
Don’t know /
unsure
Other

Subscription
service/wine club
WINERY OWNED WINE CLUBS
COMPARED TO INDEPENDENT
WINE CLUBS
41

Wine club/subscription services being used
42
Project Management
You indicated that you have purchased wine through a subscription service / wine club with an independent company that isn’t a
winery. The following questions are focused on this channel. [M/R] CF5. Which wine club do you have a subscription with?
Base: Wine-drinking Australians that bought wine through an independent subscription service in 2019-2020 n=157 (18-34 n=53, 35-
54 n=65, 55+ n=39)
%
Naked Wines, CellarMasters and the Qantas Wine Club are three of the most commonly used subscription services.
Naked Wines and Qantas Club are more popular with those aged between 18–34 years while Cellar Masters is more
popular for those aged 55+.
Other subscription services were with Virgin Wines, Wine Selectors and Good Pair Days.
38
35
31
26
11 11
11
5
42
34
40
28
21
4
11
4
40
32
29
32
9
5
14
3
31
41
21
13
3
33
5
10
Naked Wines CellarMasters Qantas wine club The Wine Society Love and Other
Drinks
Other Vinomofo
Don’t know /
unsure
TOTAL 18-34 35-54 55+

Average quantity delivered through wine clubs
43
Project Management
CE2 & CF2. On average, how many bottles are provided in a club pack or in your delivery?
Base: Wine-drinking Australians that bought wine through an independent subscription service n=157 and through a winery owned
club or subscription service n = 119
%
Compared to those using winery subscription services/wine clubs, respondents using independent
subscriptions are receiving more bottles in each delivery.
3
8
10
22
13
18
21
5
4
10
13
15
9
13
27
9
1 2 3 4 5 6 7-12 More than 12
Winery club
Other club

Annual spend per delivery through wine clubs
44
Project Management
CE3 & CF3. How much is your annual spend per delivery with the wine club/subscription service each year?
Base: Wine-drinking Australians that bought wine through an independent subscription service n=157 and through a winery owned
club or subscription service n = 119
%
Compared to those using winery subscription services/wine clubs, respondents using independent
subscriptions are spending around $50 less a year on their subscription with 27% spending $150–$199 and 18%
spending $250–$299.
10
14
18
23
14
18
2
10
16
27
11
18
12
6
Under $100 $100 - $149 $150 - $199 $200 -$249 $250 - $299 $300 or more Not sure
Winery club
Other club
Reasons for buying wine through wine clubs
45
Project Management
CE4 & CF4. What are your reasons for using this channel?
Base: Wine-drinking Australians that bought wine through an independent subscription service n=157 and through a winery owned
club or subscription service n = 119
%
Compared to those using winery subscription services/wine clubs, a higher proportion of respondents using
independent subscriptions find this channel convenient and offers better value for money and range. Given the
nature of the service, wines are not exclusive like they are to a winery. Other reasons for buying wine through this
channel included supporting small independent wineries through subscriptions like Naked Wines.
45
42
33
31
29
28
32
29
28 28
Convenience Better value for money Better range Price transparency I like having the hassle
removed from selecting
wines
I like being offered
exclusive deals
Other club Winery club
26
20
18
15
2
3
26
11
1
I like getting personalised
and knowledgeable
advice on wines to select
Provide curated offers Wines I want not
available elsewhere
I trust this channel more
than others
Don't know Other

Reason for joining and level of customisation
46
Project Management
CE6 & CF7. Do you prefer being able to choose your own wines or have them chosen for you?
CF9, What made you choose this service – e.g. instead of a winery’s own wine club?
Base: Wine-drinking Australians that bought wine through an independent subscription service n=157 and through a winery owned club or
subscription service n = 119
Responses were very similar for both types
of subscriptions services when it comes to
being able to choose own wines or taking
set packs
Preference for customisation (%) Reasons for using independent subscription service over winery owned
# Recommended
# Advertising/marketing
# Good deals, discounts, specials
# Used coupons/discount code/voucher
# Better price
# Better service/experience
# Prefer the range, variety to choose from
# Support several businesses
#Better value and quality
# Easy/convenient/I just like it
# I know what I’m getting
# Use rewards points
# Delivery faster / convenient times
15
28
39
55
15
25
42
52
I have no preference
either way
I like to have wines chosen
for me – set packs
I like to have set packs but
be able to customise them
if I want to
I like to choose my own
wines
Other club
Winery club
Many chose this channel for varied reasons. Some of these
were because they were able to use reward points, had
access to a bigger range of wines, and they were able
support several independent wineries.

Areas for improvement for independent subscription
services
47
Project Management
CE8 & CF10. What could be put in place to improve this channel for purchasing wine?
Base: Wine-drinking Australians that bought wine through an independent subscription service n=157 and through a winery owned
club or subscription service n = 119
%
For 52% of respondents that have purchased wine from an independent wine club or subscription service in 2019 and
2020, free delivery would improve the service the most. Following this, more deals appeal to 39%.
38% would like to see extras and treats included in delivery, compared with 34% when it came to wine subscriptions direct
from wineries, showing a point of difference in expectation from the channel of wine purchasing. A bigger range is also
desired by 34% from an independent wine subscription.
46
35
34
33
34
28
27
23
4
2
52
39
38
34
28
24
19
17
4
3
Free delivery More deals Extras/treats
included in
delivery
Bigger range Easier
ordering
process
Faster
delivery
timings
More reliable
delivery
timings
More
information to
help me
choose which
wine to buy
Don’t know /
unsure
Other
Winery club Other club

Online
WINERY WEBSITE SHOPPING CART
48

Average quantity purchased through winery website
49
Project Management
You indicated that you have purchased wine online – through a cellar door / winery’s own website. The following questions are
focused on this channel. [S/R]
CG1. On average, how many bottles do you purchase per transaction through this channel?
Base: Wine-drinking Australians that bought online on a winery web shop in 2019-2020 n=196 (18-34 n=90, 35-54 n=82, 55+ n=24*)
%
Significance two tailed test of difference by segment
[ / significantly less/more than the total sample]
There is a relatively even mix between respondents using this channel to buy in smaller quantities (i.e. 2 to 4
bottles) as well as half a dozen and up to a dozen. Those aged 55 and above were significantly more likely to
buy more than a dozen bottles at a time. Those aged 35–64 years on average purchase 4.65 bottles, 1 bottle
more than those aged 18–34 years.
8
16
18
16
8
13
15
6
10
23
20
19
9
13
3
2
6
11
16
17
10
16
18
6
4
8
17
4
46
17
1 2 3 4 5 6 7-12 More than 12
Total 18-34 35-54 55+
Mean
3.58
Mean
4.65
Sample size
too small
Mean
4.28

Average price spent per bottle through winery website
50
Project Management
You indicated that you have purchased wine online – through a cellar door / winery’s own website. The following questions are
focused on this channel. [S/R]
CG2. What is the average price you pay per bottle through the winery’s online shopping cart?
Base: Wine-drinking Australians that bought online on a winery web store in 2019–2020 n=196 (18-34 n=90, 35-54 n=82, 55+ n=24*)
%
Almost a half (45%) tended to spend between $20–$30 per bottle through the winery shopping cart. Half(51%) of
this was made up of 18–34 years and 69% have a household income before taxes of $80,000 or more. Those aged
55 years plus are more likely to purchase cheaper bottles of wine (i.e. less than $20) online compared to the total.
5
12
19
23
22
9 9
2
14
18
28
22
7
9
21
13
29
17 17
4
0
<$10 $10 - $14.99 $15 - $19.99 $20 - $24.99 $25 - $29.99 $30 - $49.99 $50 or more
TOTAL 18-34 35-54 55+

Reasons for buying wine through winery website
51
Project Management
You indicated that you have purchased wine online – through a cellar door / winery’s own website. The following questions are
focused on this channel. [M/R]
CG3. What are your reasons for using this channel?
Base: Wine-drinking Australians that bought online on a winery web store in 2019–2020 n=196
%
While a third use the channel because it is convenient another 30% started buying directly from the winery on
their website because of the disruptions caused by COVID-19.
35
30
28
26
24
23
22
Convenience I started using this
because of COVID-19
restrictions
Special offers Better value for money Offer free delivery Easy ordering process Wines I want not
available elsewhere
20
19 19
17
16 16
2
Discounts on volume Better range I like buying directly
with the winery
Good reviews that
help me make a
decision on what to
buy
Price transparency I trust this channel
more than others
Don’t know / unsure

Areas for improvement for purchasing through winery
website
52
Project Management
You indicated that you have purchased wine online – through a cellar door / winery’s own website. The following questions are
focused on this channel. [M/R]
CG5. What could be put in place to improve this channel for purchasing wine?
Base: Wine-drinking Australians that bought online on a winery web store in 2019–2020 n=196
%
Free delivery, more deals and receiving extras/treats were all considered ways to improve this channel. Wineries could
also provide the content on their sites with more information to help customers make a decision on which wine to buy
and potentially review the consumer purchase journey with 14% feeling that they need assistance with using the website.
47
39
31
28
25
23
22
21
14
3
1
Free delivery More deals Extras/treats
included in
delivery
Faster
delivery
timings
More reliable
delivery
timings
Easier
ordering
process
More
information
to help me
choose
which wine
to buy
Bigger range Assistance
with using
the website
Don’t know /
unsure
Other

Online
ONLINE RETAILERS COMPARED TO
WINERY WEBSITES
53

Average quantity purchased online
54
Project Management
CG1 & CH1. On average, how many bottles do you purchase per transaction through this channel?
Base: Wine-drinking Australians that bought wine through online retailers in 2019-2020 n=340 and through winery website n=196
%
When respondents purchase wine online through an online retailer that isn’t a winery, 38% buy half a dozen to a
dozen wines, and another 20% purchase more than a dozen bottles at once. The average quantity of bottles
ordered by wine drinkers surveyed is 9.6, 5 more bottles than through the winery website.
8
16
18
16
8
13
15
6
6
11
13
7
5
13
25
20
1 2 3 4 5 6 7-12 >12
Winery website
Online retailer site

Average price spent per bottle online
55
Project Management
CG2. What is the average price you pay per bottle through the winery’s online shopping cart?
CH2. What is the average price you pay per bottle through an online retailer website?
Base: Wine-drinking Australians that bought wine through online retailers in 2019-2020 n=340 and through winery website n=196
%
Compared to a winery website, respondents tend to spend less per bottle through an online retailer.
5
12
19
23
22
9 9
11
25
27
15
12
4
6
<$10 $10 - $14.99 $15 - $19.99 $20 - $24.99 $25 - $29.99 $30 - $49.99 $50 or more
Winery website
Online retailer site

Reasons for buying wine online
56
Project Management
CG3 & CH3. What are your reasons for using this channel?
Base: Wine-drinking Australians that bought wine through online retailers in 2019-2020 n=340 and through winery website n=196
%
Compared to winery websites, respondents buying wine online from retailers, rated nearly all of the reasons
for using the channel higher, especially on convenience, special offers and better value for money. There
was also a higher proportion that use this channel to get discounts on volume which could be contributing to
the lower average spend per bottle.
35
28
26
23
30
24
19
54
41
36
34
32
28
26
Convenience Special offers Better value for
money
Easy ordering
process
I started using this
because of COVID-
19 restrictions
Offer free delivery Better range
Winery website
Online retailer
20
16
17 17
22
1
2
25
22
17
14
12
2
1
Discount on volume Price transparency Good reviews that
help me make a
decision on what to
buy
I trust this channel
more than others
Wines I want not
available
elsewhere
Other
Don’t know /
unsure

Areas for improvement for purchasing online
57
Project Management
CG5 & CH5. What could be put in place to improve this channel more?
Base: Wine-drinking Australians that bought wine through online retailers in 2019-2020 n=340 and through winery website n=196
%
Areas for improvement through online retailer websites were very similar to winery websites with free delivery, more deals
and including extras/treats in deliveries.
Respondents however feel that online retailers have faster and more reliable delivery timings along with easier ordering
process, resulting in a smaller proportion wanting assistance with using the website.
47
39
31
21
28
22
25
23
14
3
1
51
37
33
23
22
21
18
15
9
7
2
Free delivery More deals Extras/treats
included in
delivery
Bigger
range
Faster
delivery
timings
More
information
to help me
choose
which wine
to buy
More
reliable
delivery
timings
Easier
ordering
process
Assistance
with using
the website
Don’t know
/ unsure
Other
Winery website Online retailer

Buying wine online an in-depth look
58
Project Management
Base: In-depth interviews of Australian wine drinkers that have purchased wine online over the last 3-6 months n=20
Key highlights:
• Dan Murphy’s and BWS were the most commonly used sites
• Other sites were wine.qantas.com, winedirect.com.au, Cellar Masters (recently joined with Dan Murphy’s), Liquorland, and Naked
Wines
• Some use auction sites for bidding and direct purchase such as Grey’s online, eBay and Amazon
• Numerous sources were used to find the sites including emails, sign ups, friends and social media
• Major retailers were used as they were the cheapest, fastest and would provide delivery
• Time for delivery was not a factor and all were happy for if they wanted to buy 1 or 2, then they could go to the shop to pick up.
• Location of bottle shop was a factor in purchasing online due to ‘click and collect’ feature which would influence their purchase
decision. Majority used this service.
• Searches on sites were split by varietal/vintage and discounts.
• Apart from those familiar with the wine industry, all said they found that they purchased more when going online. This was to get the
discount or bundle with free delivery.
• All agreed that it was very easy to find the wine they were after.
• Price matching on other webpages occurred.
• Majority indicated that the online experience couldn’t be improved, but some mentioned more discounts, more emails on special
releases etc.
• One elderly regular user purchased wine after abandoning the online shopping cart when Qantas Wine called within 10 minutes to
ask why they did not go through with the purchase. The caller established a rapport by discussing what they liked to buy, offering a
better price, free wine and free delivery.
Winery websites specifically:
• Only 1–2 said they would buy from winery website. All others said they wouldn’t because of price, delivery fees, and how long it
would take to arrive.
• Those that knew what wine they were after and couldn’t find online would go to the winery, however this was only a small proportion

Barriers to buying online
59

Exploring the barriers to buying wine online – lack of
confidence or other reasons
60
Project Management
D1. How confident are you in general using the internet to make online purchases?
D2. Since you indicated that you haven’t purchased wine online and don’t intend to, have you bought other products/services online before?
D3. You indicated that you have used the internet to make purchases online. Is there a reason why you have not purchased wine online?
D5. You indicated that you haven’t purchased anything online before. What are the main reasons behind that?
Whilst several barriers were identified for not using online channels for wine
purchases made by those that had used these channels at some point since
2019, 47% indicated that they had not bought wine online at all.
For those that did not buy wine online, more than two thirds (70%) still felt
confident making purchases online. With such a high level of overall
confidence, it is not surprising that 86% have used the internet to buy other
products online.
The reasons provided for not buying wine include:
• Quicker and easier to buy in person, prefer to buy in person
• Just don’t want to
• Buying online is perceived to be expensive
• Some don’t feel they drink enough and don’t want to be locked into
receiving a specified amount of bottles, especially to get free delivery
• Many don’t trust delivery, most are concerned about damaged bottles
• Lack of wine knowledge
• Getting information on where to purchase
• Couldn’t get the wine wanted
Of the 12% that have not purchased anything it is mostly because they do not
trust providing personal details and credit card details and prefer to see the
product and go to the store.
Confidence in online purchases
(%)
44
41
32
29
11
12
7
9
4
7
2
2
Total n=1007 Did not use any online
channel n=475
Very confident, I
use it all the time
Somewhat
confident
Neutral
Not really
confident
Not at all
confident
DK/NA
On average, around a third of respondents are buying wine
through an online channel. And this is significantly lower than
buying in person at a bottle shop at 96% with many
preferring this channel given its convenience and liking the
ability to see the bottles and browse when making a
selection.
Reasons why people don’t buy wine online

Issues with buying online in general
61
Project Management
D6. If you have difficulty purchasing something online, what are you most likely to do?
Base: Wine-drinking Australians not confident with purchasing wine online that have bought other products online n=220
36
33
23
8
Give up
Contact the organisation
Ask family/ friends for help
Other
Likely outcome if difficulties occur purchasing online
n=220 (%)
Another potential barrier to explore is when customers
do not experience a seamless user experience whilst
buying online.
Over a third (36%) of respondents indicated that they
would give up on purchasing online if they found it
difficult to buy online.
More than half (56%) however would reach out for help
by either contacting the organisation or asking friends
or family.
Other reasons included trying again later or going to a
different website.

Reasons that could convert consumers to buy wine online
62
Project Management
D4. What would help you to consider buying wine online in the future? N=389
Almost half (42%) of the respondents suggested that they would never consider buying wine online
But some would consider if…
• Their circumstances changed, for example if bottle shops were closed because of lockdowns
• Special deals, promotions, or larger incentives were offered
• Better prices were offered, in particular cheaper prices and free shipping
• Same day shipping and reliable delivery times were provided
• More choices were available i.e. items they would like to purchase, based on personal preference
• Exclusive wines were provided online that they could not get from a retailer
• A more flexible return policy on breakages or spoilages was provided
• Quality and satisfaction guarantees were provided.
• Smaller samples could be provided to allow the consumer to taste before purchasing
• Delivery concerns were addressed including secure packaging, transparent parcel tracking system, and ability to
choose timing of delivery
• Websites were advertised directing consumers where to go to buy wine online as there is a lot of competition in the
market which is overwhelming.
• They were purchasing for the purpose of gift giving or for a special occasion.
• They already know what their favourite wine is or if they know the brand and the taste (having tried before)
• Different payment options are available
• They have the ability to compare prices.

Methodology
63

Data handling
64
Project Management
Statistical significance – 5% at 95 per cent level of confidence
All tests for statistical significance have been undertaken at the 95 per cent level of confidence, and unless otherwise noted, any notation of a ‘difference’ between
subgroups means that the difference discussed is significant at the 95 per cent level of confidence. When reporting significant differences in segments, (+x%; x%)
represents the difference in % above total sample, and % of total sample respectively.
A green circle or blue square around a value denotes that the result is significantly lower or greater (respectively) than that of the total sample for that question. E.g.
Charts have been shown by segments to demonstrate where significant differences lie. Where the sample sizes are small, charts may not be shown.
Treatment of means
Where responses are scale variables, for example 1 to 5 where 1 is disagree strongly and 5 is agree strongly, the mean is also calculated with the removal of don’t know.
Rounding of figures – may result in anomalies of +/- 1%
All results have been rounded to the nearest whole percentage figure and anomalies of about +/- 1% may occur in charts i.e. total percentages for each bar add to
99%, or 100% or 101% due to rounding error.
Net figures are also rounded – which may also result in anomalies
Net results are also rounded after summing the separate proportions rather than simply summing two rounded figures (e.g. ‘% total agree’). For this reason, anomalies of
about 1% sometimes occur between net results and rounded results shown in charts. For example, a proportion of 33.3% ‘agree’ rounds to 33%, and a proportion of 12.4%
‘strongly agree’ rounds to 12%. However, when combined to derive the total agree (i.e. agree plus strongly agree), 33.3% plus 12.4% equals 45.7%, which would be
rounded to 46%. In this case, the results would be shown in a chart as 33% agree and 12% strongly agree, but the proportion reported as ‘total agree’ would be 46%.

Method
Data collection was conducted using both qualitative and quantitative surveys
Phase 1
Quantitative surveys conducted in August 2021 n = 1007
A quota was determined to ensure coverage was consistent with the proportion of regular Australian wine drinkers consistent with Wine Intelligence Australia
market landscape report.
For the five channels where there was a ‘deep dive’, to reduce respondent burden, programming was applied to the survey to ensure that responses were
reasonably spread and minimum sample targets reached.
Phase 2
In depth interviews with respondents recruited through the quantitative survey were conducted in October 2021 n = 20. Interviews on average went for around
30 minutes and were recorded.
Phase 3
In depth interviews with wineries to identify successes and best practice identified over the last 2 years. Interviews were conducted in October/ November 2021
n = 8. Results of these interviews are provided separate to this report.
65
Project Management
