
Produced by:
RKG Associates Inc. for MSHDA
March 2019

CONTENTS
ACKNOWLEDGEMENTS .................................................................................................................................................... 5
EXECUTIVE SUMMARY ...................................................................................................................................................... 9
Project Purpose ............................................................................................................................................................... 9
Key Themes .................................................................................................................................................................... 9
Key Findings ................................................................................................................................................................. 10
Recommendations to Advance Homeownership .................................................................................................... 11
INTRODUCTION ................................................................................................................................................................ 12
Project Purpose ............................................................................................................................................................. 12
Defining Affordability ................................................................................................................................................. 15
OVERARCHING THEMES ................................................................................................................................................ 16
Population, Wages and Purchasing Power .............................................................................................................. 16
Housing Inventory ....................................................................................................................................................... 19
Development Costs ...................................................................................................................................................... 22
Barriers to Homeownership ....................................................................................................................................... 24
CASE STUDIES .................................................................................................................................................................... 26
Urban Affordability – Grand Rapids ......................................................................................................................... 26
Urban with Economic Challenges - Saginaw ........................................................................................................... 33
Aging Suburb - Westland ........................................................................................................................................... 40
Small Town Rural - Alpena ........................................................................................................................................ 46
STRATEGIES TO ADVANCE HOMEOWNERSHIP OPPORTUNITIES ..................................................................... 52
Finance Tools ................................................................................................................................................................ 54
Rehabilitation and Preservation Tools ...................................................................................................................... 58
Land Use and Zoning Tools ....................................................................................................................................... 62
Economic Development Tools .................................................................................................................................... 65
DATA SOURCES AND METHODOLOGY...................................................................................................................... 69

ACKNOWLEDGEMENTS
Michigan State Housing Development Authority
Laurie Cummings, Project Manager
Gary Heidel, Acting Executive Director
Mary Townley, Director, Homeownership
David Allen, Manager, Office of Market Research
Michigan Homeownership Study Advisory Committee
Katharine Czarnecki, Michigan Economic Development Corporation
Shanna Draheim, Michigan Municipal League
Kathie Feldpausch, Michigan Realtors
Luke Forrest, Michigan Municipal League
Patricia Herndon, Michigan Bankers Association
Larry Merrill, Michigan Townships Association
Sandra Pearson, Habitat for Humanity of Michigan
Jamie Schriner, formerly of The Community and Economic Development Association of Michigan
Lee Schwartz, Michigan Homebuilders Association
Michael Selden, Michigan Townships Association
Charlotte Smith, Local Initiative Support Corporation
Troy Villanueva, The Community and Economic Development Association of Michigan
Special Thanks To:
The Michigan Realtors, particularly Kathie Feldpausch, who helped the research team connect with
the leaders of each regional MLS in Michigan to obtain sales data that was integral to this study. We
would also like to thank each of the MLS region leaders across the state of Michigan who provided
current and historic sales data to the team.
The staff in Grand Rapids, Saginaw, Westland, and Alpena who provided us with a wealth of
information on their communities and helped highlight specific housing and economic challenges for
our case studies.
Each of the 80+ interviewees that took time to speak with us and discuss the challenges and
opportunities facing the communities, businesses, and people of the State of Michigan.
FOR ADDITIONAL INFORMATION, PLEASE CONTACT:
Laurie Cummings, Michigan State Housing Development Authority
CummingsL@michigan.gov, (517)-373-6744
735 E. Michigan Avenue, Lansing, Michigan 48909
A MESSAGE FROM THE ADVISORY COMMITTEE
Dear Reader,
The supply of affordable homes for sale in Michigan is not meeting demand, and the share of
Michigan citizens who own a home is falling as a result. The Michigan State Housing
Development Authority (MSHDA) commissioned the Michigan Homeownership Study to
investigate the scope and causes of the problem and suggest some ways to address it.
As members of the Advisory Committee for this effort, we are pleased to have helped create the
first-ever statewide affordable homeownership study of this type in Michigan. The Advisory
Committee provided guidance and input into the study and helped researchers access data and
information that could not have been accessed otherwise.
While the Michigan Homeownership Study Advisory Committee represents highly diverse interests
in the homeownership arena, all of us have a stake in finding solutions to the state’s lack of
affordable for-sale homes. Homeownership strengthens communities, enables families to build
equity, and makes important contributions to the economy. It is the sincere wish of the Advisory
Committee members that the information in this document will result in action from
policymakers, local governments, nonprofits, and others in the housing industry. This problem
will not go away on its own.
Sincerely,
Shanna Draheim, Michigan Municipal League
Luke Forrest, Michigan Municipal League
Kathie Feldpausch, Michigan Realtors®
Patricia Herndon, Michigan Bankers Association
Larry Merrill, Michigan Townships Association
Katharine Czarnecki, Michigan Economic Development Corporation
Sandra Pearson, Habitat for Humanity of Michigan
Jamie Schriner, formerly of The Community and Economic Development Association of Michigan
Lee Schwartz, Michigan Homebuilders Association
Michael Selden, Michigan Townships Association
Charlotte Smith, Local Initiative Support Corporation
Troy Villanueva, The Community and Economic Development Association of Michigan

MICHIGAN HOMEOWNERSHIP STUDY 9
EXECUTIVE SUMMARY
Project Purpose
Home prices across parts of Michigan have risen significantly over the last decade, and generally,
supply has not kept pace with demand. Housing affordability and price security are critical
components for creating places where residents can live comfortably without feeling stretched
financially. As housing prices rise alongside most other monthly expenses, more and more households
are having a tough time adjusting to the rising cost of living. The goal of the Michigan
Homeownership Study is to analyze and identify the needs and gaps in the homeownership market
across Michigan.
This report is organized in two complementary pieces: the Michigan Homeownership Study and its
companion document the Michigan Homeownership Study: Key Trends and Measures by Prosperity
Region. Used in tandem, these reports present a multi-level analysis that can help inform policy-
makers at the state, regional, and local levels about the historical, current, and future challenges in the
for-sale housing market. The companion document is a compilation of state and regional analyses
relating to demographics, socioeconomics, and the for-sale housing market. The Michigan
Homeownership Study document utilizes knowledge gained from the companion document and
investigates case study communities, categorizes challenges thematically, and provides
recommendations to advance homeownership opportunities.
Key Themes
Homeownership continues to be a goal of many Michigan residents, but the pathways of achieving
this goal are becoming more difficult. Michigan’s population is projected to increase, meaning new
homes will need to be built in hot markets and rehabilitation of older homes will need to be financed
to support the aggregate growth in households across the state. The cost of building or renovating
housing is a major driver of price increases as material costs, land values, and permitting times have
increased in many locations, making it more challenging for builders to offer an affordable product to
potential buyers.
Statewide sales prices for single-family homes rose by 71 percent between 2012 and 2017 with the
median sales price of a single-family home being $156,560. This is significantly less than the median
sales prices of a newly built home which is $307,970. Similarly, the statewide condominium market
experienced price increases of 73 percent over the last six years. In 2017, the median sales price of a
condominium statewide was $161,710 while the median sale price of a new condominium was
$276,550. That is a 71 percent price differential between existing and new units. The upward pricing
trend is one of the most significant barriers to entry for households across the state.
In addition to housing prices outpacing wage growth in some parts of the state, homebuyers are also
challenged by increasing levels of personal debt, diminished savings, and stricter lending
requirements by financial institutions due to the housing crisis. Purchasing power constraints limit
the ability of households to buy new homes or undertake major renovations to existing homes.
Younger householders who carry large student loan debt coupled with rapid price escalations in

MICHIGAN HOMEOWNERSHIP STUDY 10
housing markets located in urban job centers make homeownership difficult to attain and result in
greater numbers of renter households.
Michigan has a wide variety of community types each with their own challenges when it comes to
furthering homeownership opportunities. Growing urban communities face challenges of rising home
values and displacement while economically-challenged urban communities are dealing with
population decline and vacancy issues. Prospering suburbs are facing new growth pressures and
struggling with how best to repurpose land to meet today’s housing demands. Rural communities
struggle to retain younger residents to fill jobs and purchase homes, yet some see increases in seasonal
population and a loss of year-round housing stock to the second home market.
Key Findings
The following are some key findings from the homeownership study:
• Michigan’s ownership housing stock is older, and units may not have the layout, systems, or
amenities today’s homebuyers are looking for.
• Many vacant ownership units have not been maintained over time and will require substantial
rehabilitation.
• Communities with housing capacity may have declining population and fewer economic
opportunities that will attract new residents.
• Communities with housing demand as well as supply shortages are seeing prices escalate creating
an affordability issue for existing residents and those looking to locate there.
• Zoning and other regulatory barriers hold back or prolong the development process resulting in
fewer units created and higher price points.
• New employment opportunities or expansions may not be aligned with housing production or
rehabilitation to meet the demand from new employees.
• The combination of stricter lending practices due to the financial crisis of the early 2000’s, growing
debt loads from student loans and other borrowing, and wages not keeping pace with costs are
making it more difficult to purchase a home.
• Financial resources for housing programs are shrinking, forcing all levels of government to do
more with less.

MICHIGAN HOMEOWNERSHIP STUDY 11
Recommendations to Advance Homeownership
To address some of the identified issues related to homeownership, recommendations were crafted
based on the findings from the state, regional, and case study analysis. Recommendations are grouped
under four categories, each addressing a larger-scale issue impacting homeownership in Michigan.
• Finance Tools. Access to capital, whether for an individual buyer or a developer, is critical to
ensuring home construction and home purchases. Whether providing down payment
assistance for a first time homebuyers, or incentives to developers, different markets require
different finance tools. Recommendations found under this category offer ways to address
financing gaps and bolster existing programs.
• Rehabilitation & Preservation Tools. Across some parts of Michigan, communities and
regions are facing high vacancy rates, deferred maintenance, and homes that are not ready to
re-enter the market. Buyers in weaker market areas are finding it difficult to pull together
financing to both purchase a home and complete the necessary rehab due to lending criteria
and the difficulty of finding sales comps in the area. Oftentimes, the cost to rehab a unit may
be higher than the actual purchase price. Recommendations found in under this category
relate to rehabilitation funding and neighborhood stabilization/preservation tools.
• Land Use & Zoning Tools. Land use, zoning, and permitting are local tools that communities
have direct control over and impact the type of homeownership units that can be built, the
location of those units, and the time it takes to build them. Changes in regulations can help
with predictability of approvals, speed up delivery of units, and lower developer risk.
• Economic Development Tools. Housing and jobs are inextricably linked and aligning
employment opportunities with affordable housing is an important step to attracting and
retaining employees. The recommendations provide opportunities for the public sector and
private sector to act in unison to help businesses thrive and employees find housing they can
afford.

MICHIGAN HOMEOWNERSHIP STUDY 12
INTRODUCTION
Across Michigan, and nationally, home prices have risen significantly over the last decade. The
recovery from the Great Recession coupled with a low-interest rate environment has led to a general
uptick in homebuying. In many markets supply has not kept pace with demand, which is only
expected to increase over time. Circumstances have occurred in which home values have risen faster
rate than wages in many communities, leaving families and individuals priced out of the for-sale
marketplace.
Housing affordability and price security are critical components for creating places where residents
can live comfortably without feeling stretched financially. As housing prices rise alongside most other
monthly expenses, more and more households are having a tough time adjusting to the rising cost of
living. This creates a situation where households become cost burdened and are forced to spend more
than the recommended 30 percent of their monthly income on housing-related costs. For many
households, this can create a ripple effect where other monthly expenses are scaled back or cut out
completely. Food, healthcare and wellness, transportation, and child care are some of the basic
household needs that can go unmet in the face of rising housing costs.
Understanding the economic landscape both in the marketplace and across demographic groups can
help policymakers identify needs and align and direct the requisite resources towards priority areas.
Across Michigan, economic opportunity varies as do incomes; rural and urban communities may have
different needs, but a central commonality is that housing is a fundamental need which also defines a
community – a collection of households living area. Ensuring that housing is available and affordable
to all income levels is critical for growing and sustaining communities across the state.
This study, which was commissioned by MSHDA, provides information on homeownership
challenges statewide and by Michigan Prosperity Region. MSHDA has also provided directly a more
geographically detailed examination of Michigan Housing Markets through its ‘Statewide Housing
Needs Assessment.’ This data/mapping tool, which contains measures of local housing affordability
for 380+ specific housing markets in Michigan, will be available on the MSHDA web site in coming
months found at https://www.michigan.gov/mshda.
The Michigan Homeownership Study provides
context for this data tool, and can help the reader understand the larger issues that help drive the
small-area data and maps.
Project Purpose
Home prices across parts of Michigan have risen significantly over the last decade, and generally,
supply has not kept pace with demand. Additionally, new construction has trended toward rental
units at the upper end of the market segment to cover rising construction costs. Some of the supply of
for-sale housing is at risk of becoming subsumed into the rental market as investors are purchasing
single-family homes and converting them to rental units. The goal of the Michigan Homeownership
Study is to analyze, identify, and prioritize needs and gaps in the for-sale housing market. This study,
convened by MSHDA and conducted with the assistance of an Advisory Committee made up of key
stakeholders, aims to paint a regional and statewide picture of the housing landscape through
rigorous quantitative and qualitative data analysis and synthesis. The results will help affordable

MICHIGAN HOMEOWNERSHIP STUDY 13
housing industry decision makers adjust, add, or reconfigure existing housing programs to match the
needs of current and prospective home buyers across Michigan.
ROLE OF REPORT
This report is organized in two complementary pieces: the Michigan Homeownership Study and its
companion document the Michigan Homeownership Study: Key Trends and Measures by Prosperity
Region. The Michigan Homeownership Study document utilizes knowledge gained from extensive
data analysis and presents a series of thematic challenges, four municipal case studies, and a series of
strategies state, regional, and local leaders can use to advance homeownership opportunities.
Strategies are categorized by theme and identify potential challenges and opportunities for effecting
change. For each strategy we have identified which of the case study communities may benefit from
those policy changes and programs. The Michigan Homeownership Study document is intended to
be used by officials at all levels of government as an information and communication tool.
The companion document is a compilation of state and regional analyses relating to demographics,
socioeconomics, and housing. It identifies data points and highlights key findings by Prosperity
Region and statewide. The purpose of the companion document is to allow policy makers at the state
and regional level to understand the historical, current, and future challenges to the region related to
owner-occupied housing. The quantification of issues, especially those related to housing supply and
demand, are important for imparting regional change. The role of the companion document is to act
as a tool to educate leaders about the issues at the state and regional level. Please note that the terms
“affordable”, “obtainable” and “workforce” housing are generally used interchangeable throughout
the document to describe housing that is within the economic reach of households with about average
or below average incomes.
FRAMING OF THE ANALYSIS
Strategies in the document are
informed by a multi-level analysis of
demographic, socioeconomic, and
housing trends. The top-level
analysis involves looking at
Michigan in aggregate to understand
general trends and to provide a point
of reference for the regional analysis.
The second level of analysis is
conducted at the Prosperity Region
level. Prosperity Regions were
established and defined in 2013 to
foster greater regional cooperation
by leveraging existing resources and
opportunities. For this study, we
modified two of the Prosperity
Regions (Regions 2 and 10) to provide greater clarity on housing conditions in Detroit and Traverse
Figure 1: Map of Modified Prosperity Regions
MICHIGAN HOMEOWNERSHIP STUDY 14
City. The third level of analysis is the case studies which looks at four communities that could serve
as examples for other similar communities across the state.
PROSPERITY REGIONS
In 2013, Michigan defined ten Prosperity Regions which are made up of an agglomeration of counties.
For this study, modifications of two Prosperity Regions were made to provide greater clarity on
housing conditions. Prosperity Region Two was split into urban (Prosperity Region 2A) and rural
components (Prosperity Region 2B). Prosperity Region 10 was separated into the City of Detroit (10A)
and the rest of three county region (10B). This was done to ensure the uniqueness of the city’s housing
market was not lost amongst the regional story.
Conducting the analysis at the Prosperity Region level provided an understanding of the variety of
housing markets and conditions across the state. Regions are dynamic systems and are in part driven
by economic centers. Each region is different, some more urbanized with larger population and
employment centers and others more rural with less population and a different set of housing
challenges. Key takeaways were generated from each regional analysis which helped form the basis
for many of the strategies in this document. The accompanying Michigan Homeownership Study: Key
Trends and Measures by Prosperity Region Report contains the full analysis for each Prosperity
Region as well as a report for Michigan.
CASE STUDIES
To better understand how regional issues were manifesting in local communities, RKG presented the
Advisory Committee with a subset of cities from across Michigan that were representative of different
demographic, economic, and housing conditions. The Committee members selected by majority vote
four communities from this subset for these case studies. The resulting list of communities and their
respective community types chosen include:
• Urban Affordability – Grand Rapids
• Urban with Economic Challenges - Saginaw
• Aging Suburban - Westland
• Small Town Rural - Alpena
The case study analysis represents prototypical community typologies from across the state. The
Urban Affordability typology is applicable to urban communities experiencing significant
construction activity and price escalation, and where development or redevelopment is taking place.
The Urban with Economic Challenges case study highlights the challenges communities face when
the local economy declines, unemployment rises, local spending and tax revenues shrink, and
foreclosures, vacancy, and population loss take hold. The Aging Suburban case study looks at post-
war tract home subdivision communities with ranch-style homes built on a quarter acre lots, but have
not been modernized with upgraded systems or cosmetic changes that appeal to younger buyers in
today’s market. The Small Town Rural typology is intended to reflect geographically isolated
communities with small populations, fewer employment opportunities, and lower median household

MICHIGAN HOMEOWNERSHIP STUDY 15
incomes. Owner-occupied housing in these areas tend to be older and are primarily single-family or
manufactured homes.
Interviews with local officials, housing developers, and advocates, coupled with rigorous data
analysis allowed for an in-depth study. Lessons learned from the case studies were incorporated in
the strategies found at the end of this document.
Defining Affordability
Housing affordability can be defined as the relationship between household income and monthly
housing expenditures. A common measure of affordability is whether housing expenses exceed 30
percent of income. In that circumstance, a household is considered cost burdened and may be limiting
expenditures on other necessary purchases such as healthcare, childcare, education, or transportation.
Households in communities with escalating home prices face particularly acute challenges, as wages
are not keeping up with the rise in housing costs.
There are two common types of affordable housing in the marketplace today: deed restricted
affordable units and naturally-occurring affordable housing based on a community’s market prices.
Both types of affordable housing can serve a variety of needs. The crucial difference is that the market
determines the price of unrestricted affordable units, while a recorded legal instrument and strict
pricing guidelines determine the price of deed restricted units. This study does not differentiate
between deed restricted and unrestricted for-sale units, rather it looks at markets in totality to identify
needs and gaps that policymakers can choose to prioritize.
For this housing study, affordability is examined using Department of Housing and Urban
Development (HUD) Area Median Income (AMI) data which is based on specific geographies. For the
purposes of this study, we used AMI thresholds at the state, metropolitan region, and county levels.
The AMI data helps to inform purchase price affordability and is also used to compare existing supply
and future demand by price segment and household income. To understand the affordable/workforce
housing market, six AMI thresholds were analyzed for each study area:
• 30 percent of AMI
• 50 percent of AMI
• 80 percent of AMI
• 120 percent of AMI
• 200 percent of AMI
• Greater than 200 percent of AMI
The affordability gap between supply and demand is determined by comparing what is affordable at
each income threshold to what is available on the open market. Housing sales prices were collected
from across the state to determine median sales values by region.

MICHIGAN HOMEOWNERSHIP STUDY 16
OVERARCHING THEMES
Michigan’s homeownership market, much like the national market, constantly fluctuates. Ebbing and
flowing with the strength of the economy, shifting buyer preferences, and changes in the lending
environment. Since the Great Recession, many communities across Michigan have rebounded and are
seeing price increases that outpace what many potential homeowners can afford. In other
communities, challenging economic conditions, lower incomes, and a lack of investment in ownership
units have created a depression in the local market. In each community these issues surface in different
ways and require a wide range of tools that can be combined to stabilize the ownership market. Our
analysis of the homeownership market across Michigan and a scan of national trends in
homeownership revealed the following overarching themes.
Population, Wages and Purchasing Power
Homeownership continues to be a goal of many Michigan residents, but the pathways of achieving
this goal are becoming more difficult. Costs to build a new home or rehabilitate an older home
continue to rise, population and job growth in urban centers puts upward pressure on housing prices,
and households are saddled with more debt and fewer savings, making it more difficult to purchase
a home. Michigan’s population is projected to continue to increase, meaning new homes will need to
be built in hot markets and rehabilitation of older homes will need to be financed to support the
continued economic prosperity across the state.
POPULATION AND WAGES
Michigan’s population is projected to grow by 8 percent between now and the year 2045. Although
the trend line for growth over this time period is more stable than what may have been experienced
in previous decades, the state still needs to find ways of accommodating new residents in places they
want to live. The other challenge for Michigan is the ability to support more smaller households,
especially as the senior population continues to grow. More single-person households mean more
housing units, with the number of households projected to grow by 11 percent through the year 2045.

MICHIGAN HOMEOWNERSHIP STUDY 17
Like population and households, the number of jobs is projected to increase as well across Michigan.
Projections through the year 2045 show employment increasing by 4 percent, or 245,000 jobs.
Approximately one-third of those projected jobs are in sectors that tend to pay lower wages on
average. This includes food services, administration and support services, and local government. The
state’s median household income of $50,803 provides enough money to afford a house priced around
$175,000, yet the median sale price for a new single-family home in Michigan is just over $330,000.
New housing is not being built at price points that are affordable to the average Michigan household.
In 2018, food service and hospitality workers earned an average of $23,150 per year, which is enough
to purchase a home valued at $75,000. Not all projected jobs are lower wage earners, though. A third
of all employment growth is expected in the professional and technical services sector, which has an
average wage of more than $100,000.
A.L.I.C.E. POPULATION
Michigan has nearly 3.8 million households, of which 15 percent lived in
poverty and 25 percent are categorized as Asset Limited, Income
Constrained, Employed (ALICE), which refers to working households that
do not earn enough to cover all household needs. ALICE households are
those on the edge of poverty. These households have very little cushion in
their paycheck or savings to cover increases in costs, particularly housing
costs. Every day costs continue to rise, making it more difficult for ALICE
households to afford housing, transportation, food, education, and healthcare. According to a 2017
ALICE report for Michigan, nearly two-thirds of all jobs across the state paid less than $20 per hour,
which is not enough to support a family of four.
1
Over the next five to ten years, low-wage jobs are
1
2017 ALICE Update, United Ways of Michigan.
Figure 2: Michigan Historical and Projected Population, 1970 - 2045
0
2,000,000
4,000,000
6,000,000
8,000,000
10,000,000
12,000,000
1970 1980 1990 2000 2010 2016 2017 2018 2019 2020 2025 2030 2035 2040 2045
Michigan Historical and Projected Population, 1970 - 2045
Source: REMI
Michigan
MICHIGAN HOMEOWNERSHIP STUDY 18
projected to increase at a faster rate than high-wage jobs, making affordable housing for working
households even more critical. When we talk about the workforce and obtainable housing, it is
important to consider housing options for working households that are earning at or below 80
percent of the area median income. This is a very different economic situation than the more
traditional definition of workforce housing for households in the 100 to 140 percent of area median
income range.
LIMITATIONS TO PURCHASING POWER
In addition to housing prices outpacing wage growth across many sectors, home buyers are also
challenged by increased debt, fewer savings, and stricter lending requirements. This is particularly
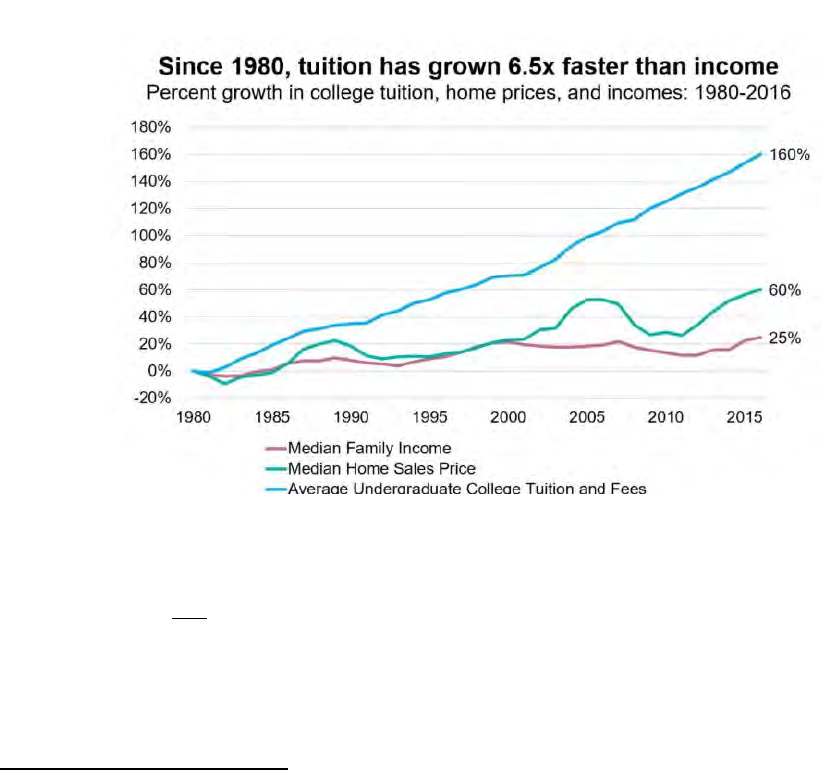
true for younger households looking to enter the homeownership market. A recent study by
researchers at Apartment List estimated that millennial buyers are facing an uphill battle to save
enough money for a down payment with the added debt load of student loans. Since 1980, tuition
rates have grown 6.5 times faster than incomes with average undergraduate tuition rates increasing
160 percent since 1980.
2
The study estimates millennials with college debt will require an average of 12 years to save up for a
20 percent down payment compared to only 7.6 years for graduates without debt. This comes at a
time when tuition and housing prices continue to rise. This generation represents the next big wave
of potential homebuyers and provides a way out for senior households looking to down size. If
purchasing power is limited and renting becomes a longer-term trend, turnover in the ownership
market may be impacted. Finding ways to increase access to quality housing through financial
2
Student Debt and Millennial Homeownership. January 2018. https://www.apartmentlist.com/rentonomics/student-debt-
millennial-homeowership/
Figure 3: National Trend of Wages, Homes Prices, and Tuition

MICHIGAN HOMEOWNERSHIP STUDY 19
assistance, rehabilitation assistance, or deed restricted affordable housing will be important going
forward.
Housing Inventory
The ongoing maintenance and expansion of the housing stock is vital for maintaining healthy
neighborhoods and communities. Over the last seventy years, Michigan experienced both a rapid
growth and decline in households. During the immediate post-war period, job opportunities in the
manufacturing sector were a magnet for household growth. New suburbs were built in communities
across the state to house families leaving urban areas or relocating from other parts of the country.
This period of growth tapered off in the 1980’s, and a long-term decline soon followed due to
structural changes in the economy. During the downturn, losses in households resulted in excess
housing supply and rising vacancy rates. Today, a housing imbalance exists where some communities
are growing and seeing price appreciation, while others are experiencing population loss and declines
in home prices
PUSH TOWARD HIGHER END HOUSING PRODUCT
Housing market momentum tends to build in locations where developers can realize the greatest
financial return and experience minimal risk exposure. One of the findings from this housing study is
that new construction has pivoted towards the upper end of the income spectrum. Developers are
building homes (both single-family and condominiums) at price multiples much greater than what an
average household can afford. Amenities offered include larger sized units, luxury finishes, and
building amenities. Comparatively, the existing housing stock does not offer such features as much of
it was built for working class families at a time when these luxury features were less common.
From a pricing perspective, there is nearly a $100,000 sales price differential between existing and new
homes in Michigan. The price gap between existing and new homes has shrunk over time, as sales
prices for existing homes rose 70 percent since 2012. In many circumstances, purchasing a new home
makes more sense from a homebuyer’s perspective as new homes are move-in ready, require no
upfront rehab work, and come fully equipped with modern appliances and systems. The challenge in
Michigan is how to raise the quality of the existing housing stock to provide affordable
homeownership opportunities that are enticing to new buyers.

MICHIGAN HOMEOWNERSHIP STUDY 20
MISSING MIDDLE
Across Michigan there are three primary housing markets: those below 80 percent of AMI, those
between 80 percent and 120 percent of AMI, and those earning more than 120 percent of AMI. The
graph below presents affordable sales prices across all AMI thresholds in comparison to market
pricing. From the data, households below 80 percent of AMI cannot afford existing homes priced at
or above the median sales value. Conversely, for households with incomes above 120 percent of
AMI, housing choice exists. These households have the option to purchase existing housing units, or
new units, depending on what they can afford.
Figure 4: Sales Price of New Housing Units
$0
$50,000
$100,000
$150,000
$200,000
$250,000
$300,000
$350,000
2012 2013 2014 2015 2016 2017 2018
Sales Price
Median Sales Price Across Michigan, 2012 - 2018
Source: MLS
Existing Single Family New Single Family Existing Condo New Condo

MICHIGAN HOMEOWNERSHIP STUDY 21
Missing middle housing is a potential supply side solution for those households earning between 80
percent and 120 percent of AMI. In many parts of the state, the missing middle market is where
housing options are most limited. Households in this category have the financial means to purchase
existing housing units but not enough income to purchase new housing product. This disconnect
within the marketplace results in greater demand for quality housing product located in desirable
communities or neighborhoods. The increase in overall demand results in price escalations across the
entire housing stock and contributes to the lack of affordability. In many communities, zoning
regulations restrict residential density, particularly in single-family neighborhoods so that new
housing at greater densities are not built.
One way to address the gap in missing middle housing is to increase residential densities, product
diversity, and a range of price points in established neighborhoods. By facilitating the development
of infill developments, communities can add new product types such as duplexes, three-family, and
small multifamily (5-10 units) developments. These lower-priced units can offer an entry point for
households looking to purchase homes and establish roots within a community.
One of the methods to actualize change is to update local zoning ordinances to remove single-family
zoning. Minneapolis recently updated its zoning ordinance across the city to end single-family zoning.
The intent of the update is to allow for greater diversity of housing types within existing
neighborhoods.
3
The change was heralded as a step toward addressing housing affordability and
equity, with greater housing diversity augmenting the supply of housing to meet demand. Similarly,
3
https://www.nytimes.com/2018/12/13/us/minneapolis-single-family-zoning.html
Figure 5: Maximum Purchase Price Based on Median Income in Michigan
$0
$50,000
$100,000
$150,000
$200,000
$250,000
$300,000
$350,000
$400,000
$450,000
30% AMI 50% AMI 80% AMI 120% AMI 200% AMI
Sales Price
Maximum Purchase Price Based on Median Income in Michigan
Source: HUD, MLS
Affordable Single-Family Affordable Condo Existing Single-Family
Existing Condo New Single-Family New Condo

MICHIGAN HOMEOWNERSHIP STUDY 22
about ten years ago Grand Rapids implemented a form-based code across certain parts of the city
which increased housing diversity.
4
The results from Grand Rapids are promising and may offer a
pathway to communities facing issues of price escalation and limited developable land.
REHABILITATION
In aggregate, Michigan has large numbers of homes which are vacant or in need of repair. As a result
of population and household declines during the 1980’s, many communities were left with
neighborhoods or areas experiencing high levels of unemployment and underinvestment in the
housing stock. Over time, some communities were able to rebound from the decline and pivot to
towards revitalization, while others have turned the corner.
Large scale rehabilitation of the housing stock is difficult to execute because it requires a concerted
effort on the part of homeowners, the availability of financing, and coordinated efforts by municipal
officials. Rehabilitation is difficult from the homebuyer side because financial capital is not always
readily available for renovation projects. While some lenders offer construction financing, lending
terms may not be favorable to low- to moderate-income households who are unable to pay the loan
back on top of an existing mortgage. While there are state and local programs which help homeowners
finance rehabilitation costs, these funds are limited.
The location of properties also plays a significant role in home renovation financing. In rural areas
where comparable appraisals are fewer in number, lenders tend to be unwilling to provide funds for
acquisition and renovation. This is due to the risk associated with investing in properties which are
not located in active housing markets, and the general risk-averse nature of lenders today. In markets
with greater real estate activity, lenders are more willing to invest, but mostly with individuals who
can afford to undertake the rehab project. One of the key challenges for low-to moderate-income
households is accessing financing to undertake rehabilitation projects and open up housing choices
that are more affordable than purchasing new homes.
Development Costs
One of the themes that rose to the top during the interviews with housing experts across Michigan
was the cost of building as a driver of price increases. Challenges related to construction industry
jobs, labor shortage, rising wages, and material costs permeated our conversations. Availability of
skilled labor in the construction industry is a major issue in Michigan but also across our nation as
more young people attend college and enter more technical fields. At the same time, material costs,
land values, and permitting times have increased in many locations, adding to the builder’s hard
and soft costs making it more challenging to offer an affordable product to potential buyers.
LABOR AND CONSTRUCTION
One of the contributing factors to the rise in new home prices across parts of Michigan is the
shortage of construction labor. Between 2001 and 2010, Michigan lost just over 89,000 construction
sector jobs as a result of the Great Recession, a major slow down in construction activity, and a shift
of the workforce to other employment sectors. Interviews with housing experts revealed a
4
https://nextcity.org/daily/entry/a-decade-without-single-family-residential-zoning-in-grand-rapids

MICHIGAN HOMEOWNERSHIP STUDY 23
significant migration of construction workers to more prominent markets in the south and
southwest where labor was in-demand and construction was booming. Since 2010, the construction
labor market as started to come back, gaining back about half the jobs that were lost in the previous
decade. That trend is expected to continue, but labor shortages will still prevail as Michigan is not
projected to reach 2001 employment levels even by the year 2028.
In addition to rising labor costs, the National Association of Home Builders (NAHB) has noted
increasing permitting costs and extended approval time periods are also attributing to the rising cost
of housing. Nationally, 25 percent of the cost of a typical home can now be attributed to
development reviews, mitigation studies and reports, site plan revisions, architectural plans, and
permitting fees.
5
These delays flow down into the builders’ bottom line and eventually passed on to
the buyer.
5
Housing Challenges Threaten Our Economic Growth. Home Builders Association of Michigan, June 2017.
Figure 6: Construction Industry Job Change

MICHIGAN HOMEOWNERSHIP STUDY 24
PRODUCT DELIVERY
The increase in costs and challenges with
labor availability have created a situation for
many home builders where it is more cost
effective to build fewer homes per year but
make them larger and more expensive to
make up for losses in volume. In many of
Michigan’s prominent housing markets such
as Traverse City, Grand Rapids, Ann Arbor,
and parts of Downtown Detroit, prices for
new housing units continue to escalate at a
far faster rate than the existing housing stock
creating a situation where new units are no
longer available to most Michigan households.
For example, in Grand Rapids new single-family homes sold in 2018 had an average sales price of
$300,000 compared to existing homes that sold at an average of $153,000. The combination of rising
costs, scarcity of product, and demand to live in Grand Rapids are all causing new homes to sell for
nearly twice the price of an older existing home. The same trends can be seen in the new
condominium development and rehab projects in Downtown Detroit. Condominiums built between
2010 and 2018 had an average sales price of $444,400, which compares to condos built between 1990
and 2010 which sold for an average of $178,500. That equates to a 150 percent higher selling price for
newer condo units. With sales prices for new product continuing to rise, the focus for more
affordable housing options lies within the existing housing stock, which in many cases needs
rehabilitation and upgrades to be saleable in today’s homeownership market.
Barriers to Homeownership
Accessing the home ownership market offers a pathway to building longer-term equity and wealth,
but entering the world of home ownership and finding an asset that has appreciating value is
becoming more challenging. Local regulations, market conditions, and the ability to afford a quality
home are challenges not only in Michigan’s market but in many places across the country.
REGULATORY
Local zoning regulations and permitting processes can add time and risk to the approval and
construction of residential units. Zoning restrictions that limit density, create large lot subdivisions,
and limit product type can upset the supply and demand balance particularly in a market where
housing demand is high. Continued layering of building code regulations, while good practice, can
also lead to increased construction costs that are eventually passed on to the buyer through higher
sale prices. Municipalities should look at their local market, understand their current housing supply,
and tailor zoning regulations to meet the market for both ownership and rental housing options.
LENDING REQUIREMENTS
As a response to the housing market crash and Great Recession, lending requirements for mortgages
were tightened to ensure that lenders were not providing mortgages to buyers who could not afford
New condo building in Detroit. Source: Redfin

MICHIGAN HOMEOWNERSHIP STUDY 25
it. This meant increased down payment amounts, enhanced credit scores, and ensuring loan-to-value
ratios were in line. As we have seen nationally, first time home buyers are coming in with more debt
than ever before between student loans, credit cards, and other accumulated debt obligations. Paying
down debt obligations has led to fewer households with adequate savings to meet down payment
requirements, and challenges with maintaining a qualifying credit score. A 2018 report from the
Federal Reserve showed that 40 percent of adults could not cover a $400 unexpected expense if one
arose.
6
As student loans and housing prices continue to rise, saving more money for a home purchase
will become more difficult.
The other challenge for home buyers in Michigan is the ability to obtain financing for acquisition and
rehabilitation for older homes that need work either due to deferred maintenance or changes to make
the home more livable. In some markets across Michigan it can be challenging for the lender to find
comparable properties that justify an appraisal value that covers both the sale price and rehabilitation
costs for the home. For example, if a buyer purchases a home for $75,000 and must put another $40,000
into rehabilitation, the home may not appraise for $115,000 if there are not comparable properties in
the area. The loan-to-value ratio ends up being too high and leaves the buyer with a financing gap
typically on the rehabilitation side of the loan. If the buyer cannot come up with another source of
financing, it can be very difficult to get a loan. This issue is particularly pertinent to Michigan as there
are many existing homes across the state that could serve as affordable and obtainable ownership
options but need rehabilitation to make them livable and/or marketable to buyers.
MARKET STRENGTH
Investment in new ownership construction and rehabilitation projects are not evenly disbursed across
Michigan. There are markets where construction is booming, and buyers are competing to find
ownership units. There are also markets where home values are declining, and vacancy grows. There
are many factors driving the decisions of developers and buyers which include access to jobs,
transportation connectivity, quality schools and services, natural features, and amenities. There is also
a desire, particularly for younger and older residents, to be in or near activity centers and major cities.
These places offer greater economic opportunity, cultural activity, diversity, housing choice, and retail
and restaurant amenities. Communities that can put forward a competitive package of attributes will
do well, those that cannot may continue to decline. Finding the right strategies to incentivize
investment in softer markets will be important in stemming the loss of population in some markets
and providing employers with the support they need to attract workers.
6
Fed Survey Shows 40 Percent of Adults Still Can’t Cover a $400 Expense. CNBC, May 22, 2018.
https://www.cnbc.com/2018/05/22/fed-survey-40-percent-of-adults-cant-cover-400-emergency-expense.html

MICHIGAN HOMEOWNERSHIP STUDY 26
CASE STUDIES
Opportunities and challenges within the homeownership market are impacted by broader trends that
occur at the national and state level, but it is at the municipal level where change is seen and felt.
Michigan has a wide variety of community types each with their own challenges when it comes to
furthering obtainable homeownership opportunities. Growing urban communities face challenges of
rising home values and displacement while economically-challenged urban communities are dealing
with population decline and vacancy issues. Prospering suburbs are facing new growth pressures and
struggling with how best to repurpose land to meet today’s housing demands. Rural communities
struggle to retain younger residents to fill jobs and purchase homes, yet some see increases in seasonal
population and a loss of year-round housing stock to the second home market.
While each of Michigan’s 1,773 cities, villages, and townships are unique, this document uses a case
study approach to communicate potential challenges and solutions that may be applicable to a broader
range of communities. For example, the City of Ann Arbor may fall into the Urban Affordability
category based on similar demographic, economic, and market trends to that of Grand Rapids. The
same could be said for the City of Royal Oak which could fall into the Aging Suburban category with
similar characteristics to the case study community of Westland. The four case studies highlight trends
and market considerations for each place type and offer some insights on the opportunities and
challenges in the homeownership market.
Urban Affordability – Grand Rapids
In many urban communities across the country, housing affordability has become a major challenge
and is impacting residents and businesses alike. In some locations, the cost of renting or owning a
home far out paces incomes. The mismatch in the marketplace between prices and affordability has
been exacerbated by low costs to borrow money and a building cycle which has pushed developers
to build more units with top of market price points. The Urban Affordability typology is applicable to
urban communities experiencing significant construction activity and price escalation, where
development or redevelopment is taking place along commercial corridors, in areas served by public
transportation, and neighborhoods that provided opportunities for low- and middle-income
households to live affordably.
Credit: Experience Grand Rapids

MICHIGAN HOMEOWNERSHIP STUDY 27
DEMOGRAPHICS
Grand Rapids is a growing city. Over the last ten years, total population grew by 2 percent as
compared to the state’s overall population which did not increase at all.
7
However, what is
particularly telling is that residents ages 25-34 increased by 15 percent over the same period. Driving
some of this change is the fact that Grand Rapids is home to fifteen higher education institutions in
the metro area with a combined 40,000 students. Some of these students may be staying in the city
after school for job opportunities. This population has drawn the interest of developers and investors
and created a market for the new development across the city. Neighborhoods like Downtown and
the West Side have seen new apartments, condos, and mixed-use developments which include stores,
restaurants, and other amenities catering to young professionals and retirees alike.
At the same time, the number of residents ages 55 and older is growing. Between 2011 and 2016, the
City saw an increase of 11 percent in this population cohort. The population changes and economic
opportunities in Grand Rapids have provided the impetus for developers to invest in new multi-
family rental and condo buildings. Market preferences for both younger and older residents are
aligning with interest in managed buildings, no maintenance, elevator access, covered parking, and
neighborhood amenities in walking distance.
INCOMES AND EMPLOYMENT
7
American Community Survey 2007-2011, 2012-2016, Table B01001, 2018
Figure 7: Change in Population by Age
-3%
0%
15%
-3%
-13%
16%
7%
-3%
2%
7%
-5%
-6%
16%
17%
-6%
2%
3%
-10%
-8%
12%
14%
-15%
-10%
-5%
0%
5%
10%
15%
20%
Under 18 18 to 24 years 25 to 34 years 35 to 44 years 45 to 54 years 55 to 64 years 65+ years
Percent
Change in Population, 2011-2016
Source: ACS
Grand Rapids Prosperity Region Four Michigan

MICHIGAN HOMEOWNERSHIP STUDY 28
Even though employment has increased in Grand Rapids, median household income continues to fall
behind the state’s median. In Grand Rapids, the median household income is $42,019 compared to the
state median of $50,803.
8
Since 2011, there has been a shift toward higher income households with
incomes between $75,000 and $100,000 growing by 10 percent. There has also been a decline in the
number of households earning less than $50,000. This could be a combination of upward mobility and
potential displacement of lower-income households from Grand Rapids.
Grand Rapids is a large employment center within Prosperity Region Four with three industry sectors
comprising nearly 50 percent of the total jobs in the city. These industry sectors include: Health Care
and Social Assistance (26 percent), Manufacturing (13 percent), and Administration & Support (10
percent).
9
The largest employer in the area is Spectrum Health with nearly 25,000 employees. This
health system employs a variety of medical professionals and offers competitive wages. Local
manufacturing firms include companies like Steelcase which employs 2,000 workers.
10
Additionally,
there are large manufacturers outside of the city in the nearby communities of Zeeland, Holland, and
Muskegon with corporate headquarters for Herman Miller and Gentex.
8
American Community Survey 2007-2011, 2012-2016, Table B19013, 2018
9
OTM, 2018
10
https://www.steelcase.com/find-us/locations/americas/grand-rapids-michigan/
Figure 8: Change in Household Income
-11%
-4%
-9%
-3%
6%
10%
16%
36%
-8%
-8%
-4%
-3%
3%
4%
17%
36%
-3%
-3%
-2%
-2%
0%
0%
7%
24%
-20%
-10%
0%
10%
20%
30%
40%
Less than
$15,000
$15,000 -
$24,999
$25,000 -
$34,999
$35,000 -
$49,999
$50,000 -
$74,999
$75,000 -
$99,999
$100,000 -
$149,999
$150,000 or
more
Percent
Change in Household Income, 2011-2016
Source: ACS
Grand Rapids Prosperity Region 4 Michigan

MICHIGAN HOMEOWNERSHIP STUDY 29
HOUSING MARKET
Since 2011, the housing market in Grand Rapids has seen a shift in ownership patterns with the share
of owner-occupied homes declining by 6 percent, compared to the region and state at 1 and 3 percent,
respectively.
11
At the same time, renter-occupied housing has increased by 8 percent. Vacant
properties experienced a dramatic decline over the last decade with a decrease of 21 percent. This drop
in vacancy speaks the desirability and strength of the city’s housing market. The overall increase in
rental units a result of a combination of new apartment construction around Grand Rapids, and the
ever-increasing occurrence of single-family homes which were once ownership units being converted
to rental units.
Table 1. Housing Units
Tenure
Grand Rapids Grand Rapids Prosperity Region Four Michigan
2011
2016
Change
% Change
% Change
% Change
Owner-Occupied 42,025 39,655 -2,370 -6% -1% -3%
Renter-Occupied
31,064
33,413
2,349
8%
10%
11%
Vacant
8,471
6,651
-1,820
-21%
-5%
-3%
Total 81,560 79,719 -1,841 -2% 1% 0%
Source: American Community Survey 2007-2011, 2012-2016, Table B25003, 2018
AGE OF STRUCTURE
Grand Rapids has an older housing stock when it comes to ownership units. Nearly 68 percent of
owner-occupied structures were built before 1959, and only 5 percent were built after the year 2000.
12
However, recent trends show that between 2007 and 2016 there was a 25 percent increase in the
number of homes built after 2000. This far outpaces the change experienced across both the region
and state, which had growth of 17 percent and 14 percent, respectively.
OWNER-OCCUPIED HOME PRICES
The median price of a single-family home in Grand Rapids increased 114 percent between 2012 and
2018. This drastic price escalation has had an impact on affordability for existing residents, particularly
for those with incomes below the median. Figure 9 compares the price of new single-family homes
and condominums to those that already existed in the market by year sold. Between 2011 and 2016,
the median sale price for existing owner-occupied units increased to the point where a household
earning the median income could not longer afford a home selling at the city’s median value. New
ownership units entering the market substantially exceed what a household earning the median
income could afford. For example, sale prices for new condominiums jumped 67 percent from 2011 to
2016.
11
American Community Survey 2007-2011, 2012-2016, Table B25003, 2018
12
American Community Survey 2007-2011, 2012-2016, Table B25036, 2018

MICHIGAN HOMEOWNERSHIP STUDY 30
PRICING BY YEAR BUILT
Between 2012 and 2018 there were 19,700 sales with a median price of $145,142.
13
Home sales of
structures built between 1900-1950 were the most numerous, and offer housing at a price point that is
more affordable to homebuyers in Grand Rapids. Although the units may need improvements, the
relatively low price point allows buyers with low to moderate incomes an entry point for
homeownership. Not surprisingly, home prices increase as the age of the home decreases. For
example, the difference in price between a single-family home built between 1990-2010 compared to
one built between 2010-2018 is about 28 percent. Newer homes have updated heating and cooling
systems, modern insulation, and friendler layouts that are generally more attractive than older homes.
The condominum market in Grand Rapids has seen a sharp escalation in pricing, particularly for units
built after 1990. The difference in price between a condomium built between a condominum built
between 1990-2010 and one built between 2010-2018 is about 30 percent.
13
Multiple Listing Service (MLS) Data, Michigan Board of Realtors, RKG Associates, 2018
Figure 9: Median Owner-Occupied Sales Price
$0
$50,000
$100,000
$150,000
$200,000
$250,000
$300,000
$350,000
$400,000
2012 2013 2014 2015 2016 2017 2018
Sales Price
Grand Rapids Median Sales Prices, 2012 - 2018
Source: MLS
Existing Single Family New Single Family Existing Condo New Condo
Home price
affordable to
household at
median income

MICHIGAN HOMEOWNERSHIP STUDY 31
DEVELOPMENT PIPELINE
As was noted earlier, Grand Rapids is seeing a lot of new residential and mixed-use development in
certain neighborhoods across the city. Currently, a majority of the new residential projects are rental
and not homeownership although some new condominiums are going up. In 2018, a new mixed-use
development was completed on the West Side that included a food market concept. Bridge Street
Market is a new 37,000 square foot store that offers fresh and locally sourced artisanal products and
anchors a new mixed-use development. The Hendrik, a new mixed-use building contains 116
apartments and nearly 56,000 square feet of office space.
14
On the homeownership side, the Viridian Place condominium development was recently approved
in Northeast Grand Rapids. This development will include 130 condominium units spread across
twenty-five two-story buildings. Each building will consist of 2, 4, 6 or 8 dwelling units.
15
HOMEOWNERSHIP CHALLENGES IN GRAND RAPIDS
DEMAND FOR RENTAL UNITS
Demand for housing in Grand Rapids has been strong over the last decade, however developers are
building many more rental units than ownership units. Trends in homeownership, affordability, and
the general economics of housing development are driving preferences to build more rental housing.
14
https://www.mlive.com/news/grand-rapids/index.ssf/2018/08/shoppers_thrilled_as_meijer_un.html
15
https://www.mlive.com/news/grand-rapids/index.ssf/2018/04/134-unit_condominium_proposal.html
Figure 10: Median Owner-Occupied Sales Price by Year Built
$68,900
$97,699
$136,500
$158,560
$164,247
$210,304
$205,563
$181,475
$86,920
$108,675
$217,250
$283,350
$0
$50,000
$100,000
$150,000
$200,000
$250,000
$300,000
Before 1900 1900 - 1950 1950 - 1970 1970 - 1990 1990 - 2010 2010 - 2018
Sales Price
Grand Rapids Median Sales Price by Year Built, 2011-2016
Source: MLS
Single Family Condo

MICHIGAN HOMEOWNERSHIP STUDY 32
Condominiums can be more difficult for developers to finance in today’s lending market and can be
more challenging for owners to obtain a mortgage to purchase due to criteria imposed by lenders.
With the development focus shifted toward redevelopment and infill projects, the market for new
homeownership units in Grand Rapids may trail behind rental units for some time.
LACK OF SMALL-SCALE DEVELOPMENT
Incentives for smaller-scale condo and townhome-style units are harder to come by in Grand Rapids.
Housing for the so-called “missing middle”, smaller-scale multi-unit housing types such as duplexes,
fourplexes, bungalow courts, and converted single-family homes, are not being built at the same pace
as larger multi-family structures.
16
In order to encourage this type of development, simplifying the
review process and modifying current site layout and building placement standards has been
proposed. Changes to residential zoning districts in Grand Rapids has provided some opportunities
for developers to build multi-family style housing in existing single-family neighborhoods. While this
proposal would increase overall density within neighborhoods, it would help address housing supply
issues for smaller-scale homeownership opportunities.
FHA APPROVED CONDOMINIUM ASSOCIATIONS
The FHA Spot Loan Approval Process was eliminated in 2010 which restricted lenders from offering
FHA loans on individual condominiums. New regulations require condominium associations to
become certified by HUD for buyers to utilize FHA backed loans. The certification must be renewed
every two years. The result of this process has been a lack of FHA approved condominium complexes
which accept FHA loans. Of all the condominium developments in Grand Rapids, there are only five
complexes totaling 715 units which are currently approved for FHA loans.
16
https://www.grandrapidsmi.gov/Directory/Programs-and-Initiatives/Housing-NOW

MICHIGAN HOMEOWNERSHIP STUDY 33
Urban with Economic Challenges - Saginaw
Communities experience economic ebbs and flows resulting in periods of growth and decline. In some
cases, national trends such as recessions have short-term implications which limit local growth and
cause hardship for the population, but these downturns tend to be temporary and communities
ultimately recover to varying degrees. However, there cases in which communities experience
prolonged economic downturns as a result of structural changes in the local and regional economy.
This situation is more likely to occur in communities centered around a single industry sector that is
declining or a large employer that leaves the area.
The Urban with Economic Challenges case study highlights the challenges communities face when
the local economy declines, unemployment rises, local spending and tax revenues shrink, and
foreclosures, vacancy, and population loss take hold.
DEMOGRAPHICS
The City of Saginaw serves as the case study for an urban community with economic challenges.
Saginaw’s economy relied on the manufacturing industry for decades, but the shift of production to
offshore locations created a period of rapid decline with the City’s population cut in half between 1960
and 2016. A city with a population of nearly 50,000 is facing the challenges of population loss,
economic decline, and a housing stock where one in five units sits vacant.
Demographic trends in Saginaw show the population shrinking and getting older. Between 2011 and
2016, population has declined another 5 percent or 2,633 people.
17
The city experienced a decline
across nearly all age cohorts, except for those ages 55 years and older which saw an increase of 8
percent. The growing senior population is a concern for the City as they have limited housing choices,
may not be able to maintain their single-family home, and do not have much equity in their home as
Saginaw home prices are relatively low.
17
American Community Survey 2007-2011, 2012-2016, Table B01001, 2018
Credit: Saginaw Art Museum

MICHIGAN HOMEOWNERSHIP STUDY 34
One of the most striking findings is that the population between 25 and 34 decreased by 12 percent
versus the region and state which saw increases. Younger residents in Saginaw who leave for college
or job opportunities elsewhere are not returning to the City later in life. The decline in this age cohort
can also make it difficult to attract new employers to the area or retail and service-based businesses
looking for households with expendable income.
INCOMES AND EMPLOYMENT
The median household income in Saginaw is $28,871 which is about half as much as the state’s
median.
18
Between 2011 and 2016, median income fell by 3 percent. Figure 12 shows the change in
household income by category from 2011 to 2016. Households in the highest income bracket decreased
by 39 percent, yet at the same time there was a 39 percent increase in the percent of households within
incomes between $75,000 and $99,999 raisin from 972 households to 1,351 households.
19
Some of the
shifts in income are the result of higher income households leaving the area, while new job
opportunities in the healthcare sector have brought in new upper middle-income households.
18
American Community Survey 2007-2011, 2012-2016, Table B19013, 2018
19
American Community Survey 2007-2011, 2012-2016, Table B19001, 2018
Figure 11: Change in Population by Age
-14%
2%
-12%
-4%
-5%
8%
7%
-8%
-3%
4%
-11%
-10%
9%
12%
-6%
2%
3%
-10%
-8%
12%
14%
-20%
-15%
-10%
-5%
0%
5%
10%
15%
20%
Under 18 18 to 24 years 25 to 34 years 35 to 44 years 45 to 54 years 55 to 64 years 65+ years
Percent
Change in Population, 2011-2016
Source: ACS
Saginaw Prosperity Region 5 Michigan

MICHIGAN HOMEOWNERSHIP STUDY 35
The healthcare and manufacturing sectors continue to dominate Saginaw’s market comprising 59
percent of all jobs.
20
Major employers in the area include Nexteer Automotive, Covenant Healthcare,
St. Mary’s of Michigan, and Morley Companies. These companies alone employ over 12,000.
21
In
nearby Midland, Dow Chemical has its headquarters which serves the region as a major employment
hub.
HOUSING MARKET
Since 2011, the housing market in Saginaw has experienced 2 percent decline in the number of owner-
occupied units, which is similar to that of the region and state. At the same time, the number of renter
households increased by 4 percent. The city’s ownership housing stock is dominated by single-family
structures, comprising nearly 98 percent of all ownership units. Vacant properties are a major issue in
Saginaw, with 20 percent of all housing units listed as vacant. The City has focused its efforts on
reducing vacant and blighted structures through a systematic demolition program which helped
remove 860 vacant homes between 2013 and 2015.
22
20
OTM, 2018
21
https://saginawfuture.com/data-demographics/primary-employers/
22
https://www.mlive.com/news/saginaw/index.ssf/2016/10/saginaw_gets_22_million_to_con.html
Figure 12: Change in Household Income
-4%
-6%
8%
13%
-14%
39%
8%
-39%
-3%
-5%
1%
-3%
-2%
6%
8%
18%
-3%
-3%
-2%
-2%
0%
0%
7%
24%
-50%
-40%
-30%
-20%
-10%
0%
10%
20%
30%
40%
50%
Less than
$15,000
$15,000 -
$24,999
$25,000 -
$34,999
$35,000 -
$49,999
$50,000 -
$74,999
$75,000 -
$99,999
$100,000 -
$149,999
$150,000 or
more
Percent
Change in Household Income, 2011-2016
Source: ACS
Saginaw Prosperity Region 5 Michigan

MICHIGAN HOMEOWNERSHIP STUDY 36
Table 2. Housing Units
Tenure
Saginaw Saginaw Prosperity Region Five Michigan
2011 2016 Change % Change % Change % Change
Owner-Occupied
12,025
11,790
-235
-2%
-2%
-3%
Renter-Occupied 7,378 7,639 261 4% 5% 11%
Vacant
5,357
4,888
-469
-9%
-1%
-3%
Total 24,760 24,317 -443 -2% 0% 0%
Source: American Community Survey 2007-2011, 2012-2016, Table B25003, 2018
AGE OF STRUCTURE
Saginaw has an older housing stock when it comes to ownership units. Nearly 77 percent of owner-
occupied structures were built before 1959, and only 1 percent were built after the year 2000.
23
Between 2011 and 2016 there was a 20 percent decrease in the number of new homes built. The local
market in Saginaw fell far below the region and state, which had growth of 18 percent and 14 percent,
respectively.
OWNER-OCCUPIED HOME PRICES
The median price of a single-family home in Saginaw decreased by 14 percent between 2012 and 2018.
In 2012, the median sales price of a single-family homes was $40,700 and in 2018 the median sales
price decreased to $35,000. Condominium prices also experienced a drop in median sales price, falling
18 percent over the same period. Figure 13 compares the price of new single-family homes and
condominums to those that already existed in the market by year sold.
PRICING BY YEAR BUILT
Between 2012 and 2018 there were 7,700 home sales with a median price of $37,732.
24
Homes sales of
structures built between 1900-1950 were the most numerous with 3,153 and a very low median sales
price of $20,505. This compares to sales of homes built between 1990 and 2010 where the median sales
price was $151,465. While the newer homes built after 1990 are selling for nearly 6.5 times are much
as homes built before 1950, the older units likely need substantial structural and cosmetic upgrades.
The condominum market in Sagniaw has seen a continuation in price escalation, however very few
units are changing hands as compared to single-family homes. In each of the respective year built
categories, prices have nearly doubled as time progressed.
23
American Community Survey 2007-2011, 2012-2016, Table B25036, 2018
24
Multiple Listing Service (MLS) Data, Michigan Board of Realtors, RKG Associates, 2018

MICHIGAN HOMEOWNERSHIP STUDY 37
Figure 13: Median Owner-Occupied Sales Price
$0
$50,000
$100,000
$150,000
$200,000
$250,000
$300,000
$350,000
$400,000
$450,000
2012 2013 2014 2015 2016 2017 2018
Sales Price
Saginaw Median Sales Prices, 2012 - 2018
Source: MLS
Existing Single Family New Single Family Existing Condo New Condo
Home price
affordable to
household at
median income
Figure 14: Median Owner-Occupied Sales Price by Year Built
$12,875
$19,810
$45,540
$86,900
$154,980
$58,300
$15,408
$21,200
$37,800
$65,880
$147,950
$227,277
$0
$50,000
$100,000
$150,000
$200,000
$250,000
Before 1900 1900 - 1950 1950 - 1970 1970 - 1990 1990 - 2010 2010 - 2018
Sales Price
Saginaw Median Sales Price by Year Built, 2011-2016
Source: MLS
Single Family Condo

MICHIGAN HOMEOWNERSHIP STUDY 38
HOMEOWNERSHIP CHALLENGES IN SAGINAW
SHRINKING POPULATION
The city’s loss of residents over time has had a significant impact on the ownership housing market.
Housing vacancy rose rapidly, and the structural integrity of vacant homes declined. Without new
residents moving in, the existing population continues to age in place making it more difficult to
maintain homes and provide city services. Younger residents also help replenish schools, drive
activity, lend more support to local businesses, and can help revitalize the existing housing stock
through rehabilitation and on-going maintenance. The lack of turnover in the ownership market
suggests that the city’s housing stock will continue to decline until a point in time where the number
of units is right-sized for the population.
EXISTING VACANT STRUCTURES AND LOTS
The steady decline in population has resulted in many vacant housing units across Saginaw. As
property taxes go unpaid, the homes eventually become property of the City. Since the housing
market is relatively weak, the City ends up with assets it cannot dispose of. As a result, over the last
five years the city has demolished more than 1,000 housing units which were acquired for delinquent
property tax payments.
Parcels in the City’s possession are typically transferred to the Saginaw County Land Bank for
holding, developing, or disposing/selling. The land bank offers an opportunity for residents or
developers looking for land assemblage. The Land Bank is quite nimble regarding foreclosing and
taking possession of properties on which there are delinquent taxes. Generally, it takes about two and
a half years for the process to complete, with four notices given to the property owner, before legal
action results in a court judgement assigning title to the land bank.
25
The land bank then puts up the
land for public auction to recover delinquent taxes, and if the property is not bought, it then resides
with the land bank. While a useful tool, the land bank owns several parcels of land that do not yet
have an intended use.
LACK OF PRICE APPRECIATION
The general absence of demand for owner-occupied housing and population/employment decline has
resulted in housing units not retaining their values. Saginaw has experienced a prolonged period of
decline where the employment base shrunk, and incomes remained low. As an example, the median
price of a single-family home in Saginaw declined by $5,700 between 2012 and 2018, while sales over
the same period dropped from 1,261 to 825. With demand for housing tapering off, and an already
abundant supply of existing homes, this city is having a difficult time attracting new buyers and
stabilizing the market.
The decline in real estate values also impacts the willingness of homeowners to make structural and
cosmetic updates to their homes. Unless the owner is planning to stay long-term, they may not see
any return on their investment from rehabbing the home. Over time, deferring maintenance and
general cosmetic improvements create a situation where homes are less desirable or worth less on the
25
http://www.saginawcounty.com/Treasurer/PropertyForeclosureTimeLine.aspx
MICHIGAN HOMEOWNERSHIP STUDY 39
market. This cycle repeats itself and creates a downward spiral that can be difficult for current owners
to escape.
NEW CONSTRUCTION OF OWNERSHIP HOUSING INFEASIBLE
Interviews with people familiar with the Saginaw housing market revealed a very limited
development pipeline, particularly on the ownership side. A few new condominium units have been
constructed recently but were priced at the top of the market unaffordable to most Saginaw residents.
The decrease in population, coupled with an oversupply of existing housing has depressed home
values and demand. This has created a situation where constructing and selling new ownership
product is financially infeasible. The cost of acquiring land and building housing has exceeded the
price points at which the market will bear, and the population can afford. Developers have shifted to
building rental units (both market-rate and affordable) and some investors are purchasing single-
family homes and converting them to rental properties.

MICHIGAN HOMEOWNERSHIP STUDY 40
Aging Suburb - Westland
In today’s market, many larger urban cities are seeing redevelopment and revitalization that are
pushing housing prices upward to the point of pricing out many who wish to live there. On the edges
of these urban areas lie post-war suburbs that have an older, more affordable housing stock and are
benefitting from the spillover effects of the urban markets. Households looking for homeownership
opportunities view these suburban locations as an opportunity to gain more space, a yard, off-street
parking, better schools, yet still have access to the jobs and amenities the city offers. In many cases,
the housing stock in these suburban locations may provide more moderately priced housing that
could be improved over time with rising values as the market continues to improve.
Aging Suburbs are often characterized by post-war tract home subdivisions with three bedroom
homes of 1,000 square feet on a quarter acre lot. Many of these ranch-style homes are approaching
sixty years of age and have not been modernized with upgrades systems or cosmetic changes that
appeal to younger buyers in today’s market. This offers an opportunity to purchase a home at a lower
price and renovate over time. There are however challenges in the suburban market that can place
constraints on the for-sale market. These include an aging population with limited downsizing
options, zoning that restricts higher density housing options, and rising affordability challenges as
new construction price points are substantially higher than existing home prices.
DEMOGRAPHICS
The City of Westland serves as a case study for the Aging Suburban community type, as it sits about
thirty miles from Detroit to the east and Ann Arbor to the west. Westland is Michigan’s 10
th
largest
city and home to 82,218 residents. The city was closely associated to the industrial economy of Detroit,
particularly during the Second World War. Many residents of Westland worked on assembly lines
and manufacturing facilities during the War. Westland became a community for which workers from
Detroit could move to, purchase a house, start a family, and still commute to work. Today, Westland
is an affordable option for households looking for a single-family home in a community with good
schools and suburban amenities.
Credit: Wikimedia Commons

MICHIGAN HOMEOWNERSHIP STUDY 41
Demographic trends in Westland show the population is shrinking and getting older. Between 2011
and 2016, population declined by 2 percent or 2,048 people.
26
The city experienced a decline across
nearly all age cohorts, except for those ages 55 years and older which saw an increase of 14 percent.
As a city with an aging population issues around aging in place, downsizing, and on-going home
maintenance will continue to grow. Despite its location and relative affordability, Westland’s
population ages 18-34 declined at a time when both the region and state increased their share. This
indicates younger residents are leaving for post-secondary education, jobs, or moving to a more urban
location.
INCOMES AND EMPLOYMENT
The median household income in Westland is $44,808, as compared to the state median of $50,803.
27
Between 2011 and 2016, the median income fell by 7 percent. There has been a decrease in nearly all
income cohorts under $100,000 per year. One striking data point is that there was a 68 percent increase
in the number of households making over $150,000 per year. This change may correlate with the high
sales prices for new homes being built in Westland, indicating higher income households are moving
into the city and purchasing new higher-value homes.
28
26
American Community Survey 2007-2011, 2012-2016, Table B01001, 2018
27
American Community Survey 2007-2011, 2012-2016, Table B19013, 2018
28
American Community Survey 2007-2011, 2012-2016, Table B19001, 2018
Figure 15: Change in Population by Age
-10%
-3%
1%
-10%
-13%
26%
5%
-5%
5%
3%
-10%
-4%
13%
13%
-6%
2%
3%
-10%
-8%
12%
14%
-20%
-15%
-10%
-5%
0%
5%
10%
15%
20%
25%
30%
Under 18 18 to 24 years 25 to 34 years 35 to 44 years 45 to 54 years 55 to 64 years 65+ years
Percent
Change in Population, 2011-2016
Source: ACS
Westland Prosperity Region 10B Michigan

MICHIGAN HOMEOWNERSHIP STUDY 42
Westland is primarily a bedroom community with a small local economy. Most residents commute
out for work, with only 7 percent of Westland residents working in the city.
29
Westland’s proximity
to nearby manufacturing jobs and the cities of Detroit and Ann Arbor provide ample employment
opportunities within a thirty minute commute distance. Major employment hubs include Ford Motor
Company in Dearborn, General Motors in Detroit, and the University of Michigan in Ann Arbor.
Within Westland itself, the largest three industries make up nearly 60 percent of the total jobs. These
industries are: Retail Trade (26 percent); Health Care and Social Assistance (23 percent), and
Accommodation and Food Services (12 percent).
30
These industry sectors tend to have lower wages
and less benefits.
HOUSING MARKET
Since 2011, the housing market in Westland has shifted from ownership to rental at a faster rate than
that of the region and state. Over this period, the ownership stock in the city shrunk by 10 percent
while renter households increased by 11 percent.
31
The increase in rental units is the result of a
combination of new apartment construction in Westland, as well as the conversion of owner-occupied
units to rentals. The number of vacant units decreased by 41 percent, indicating a tightening of the
market as vacant units are rented or sold.
29
American Community Survey 2007-2011, 2012-2016, Table B08303, 2018
30
OTM, 2018
31
American Community Survey 2007-2011, 2012-2016, Table B25003, 2018
Figure 16: Change in Household Income
-11%
-5%
9%
-2%
-13%
-2%
3%
68%
-1%
-3%
-4%
-1%
-1%
-3%
6%
21%
-3%
-3%
-2%
-2%
0%
0%
7%
24%
-20%
-10%
0%
10%
20%
30%
40%
50%
60%
70%
80%
Less than
$15,000
$15,000 -
$24,999
$25,000 -
$34,999
$35,000 -
$49,999
$50,000 -
$74,999
$75,000 -
$99,999
$100,000 -
$149,999
$150,000 or
more
Percent
Change in Household Income, 2011-2016
Source: ACS
Westland Prosperity Region 10b Michigan

MICHIGAN HOMEOWNERSHIP STUDY 43
AGE OF STRUCTURE
Being a first ring post-war suburb of Detroit, much of Westland’s housing stock is older. Nearly 42
percent of all owner-occupied structures in the city were built before 1959 and only 7 percent were
built after the year 2000.
32
In Westland, the construction of new housing has not kept pace with that
of the Detroit Metro Region. Between 2011 and 2016 there was a 1 percent increase in the number of
new homes built. Westland fell far below the region and state, which had growth of 18 percent and 14
percent, respectively.
OWNER-OCCUPIED HOME PRICES
Between 2012 and 2018, the median price of a single-family home in Westland increased 141 percent
from $58,187 to $140,000.
33
At the same time, the average days on the market dropped from a median
of forty-three days to seven days. The median sale price for a condominium experienced a similar
price increase of 137 percent, and a decrease in days on market from forty-four to seven. Figure 17
compares the price of new single-family homes and condominums to those that already existed in the
market by year sold. In the Westland market there is a price premium of 126 percent placed on the
median sale price for new homes versus existing.
PRICING BY YEAR BUILT
Between 2012 and 2018 there were 8,312 home sales with a median price of $96,995.
34
Homes sales of
structures built between 1950-1970 were by far the most numerous with 4,640 sales and a median sales
price of $87,000. This compares to sales of homes built between 2010 and 2018 where the median sales
price was $218,500. While the number of sales of homes constructed after 2010 are more limited, the
prices are considerably higher.
The condominum market in Westland has seen a sharp escalation in pricing as well, particularly for
units built after 1990. The difference in price between a condomium built between 1970-1990 and that
of a condimium built between 1990-2010 is about 107 percent; and the difference in price between a
condominum built between 1990-2010 and 2010-2018 is about 53 percent.
32
American Community Survey 2007-2011, 2012-2016, Table B25036, 2018
33
MLS, 2018
34
Multiple Listing Service (MLS) Data, Michigan Board of Realtors, RKG Associates, 2018
Table 3. Housing Units
Tenure
Westland
Westland
Prosperity Region 10B
Michigan
2011 2016 Change % Change % Change % Change
Owner-Occupied
22,202
20,065
-2,137
-10%
-4%
-3%
Renter-Occupied 12,753 14,123 1,365 11% 17% 11%
Vacant
4,298
2,545
-1,753
-41%
-16%
-3%
Total
39,258
36,733
-2,525
-6%
0%
0%
Source: American Community Survey 2007-2011, 2012-2016, Table B25003, 2018

MICHIGAN HOMEOWNERSHIP STUDY 44
Figure 17: Median Owner-Occupied Sales Price
$0
$50,000
$100,000
$150,000
$200,000
$250,000
$300,000
$350,000
2012 2013 2014 2015 2016 2017 2018
Sales Price
Westland Median Sales Prices, 2012 - 2018
Source: MLS
Existing Single Family New Single Family Existing Condo New Condo
Home price
affordable to
household at
median income
Figure 18: Median Owner-Occupied Sales Price by Year Built
$84,335
$48,000
$102,820
$116,494
$167,508
$254,611
$0
$42,000
$36,045
$57,750
$119,340
$182,385
$0
$50,000
$100,000
$150,000
$200,000
$250,000
$300,000
Before 1900 1900 - 1950 1950 - 1970 1970 - 1990 1990 - 2010 2010 - 2018
Sales Price
Westland Median Sales Price by Year Built, 2011-2016
Source: MLS
Single-Family Condo
MICHIGAN HOMEOWNERSHIP STUDY 45
DEVELOPMENT PIPELINE
Keeping with the theme of redevelopment and repurposing, the City is looking to encourage the
redevelopment of a 100-acre site which includes the site that held their former city hall. The City is
targeting the site for a mix of uses including up to 700 single-family homes and pads for retail and
restaurants. New homes in this area would likely be priced at the top of the market like the homes
built after 2010 selling in the $250,000 range.
HOMEOWNERSHIP CHALLENGES IN WESTLAND
NEW SINGLE-FAMILY CONSTRUCTION
Westland is a mature suburb growing out of the post-war period with very little greenfield land
available for development. In surrounding communities like Canton and Livonia, tract building
continues to take place with new subdivisions commanding prices well over $300,000 per unit. The
City of Westland has shifted from a focus on built-out and greenfield development to one of infill and
redevelopment. There is also a focus on rehabilitation of the older housing stock to prepare it for the
next generation of homebuyers. As older residents age out of their homes, structural and cosmetic
renovations are needed to make the home attractive to buyers in today’s market.
FHA CERTIFIED CONDOMINIUM DEVELOPMENTS
The FHA Spot Loan Approval Process was eliminated in 2010 which restricted lenders from offering
FHA loans on individual condominiums. New regulations require condominium associations to
become certified by HUD for buyers to utilize FHA backed loans. The certification must be renewed
every two years. The result of this process has been a lack of FHA approved condominium complexes
which accept FHA loans.
NAVIGATING POLITICAL AND REGULATORY CHALLENGES
In addition to financial barriers, political and regulatory challenges can also be difficult to overcome
in suburban communities where concerns over density, traffic, and schools can thwart best efforts to
develop housing and mixed-use projects. Zoning regulations have been set up to purposefully limit
density and separate uses making it difficult to redevelop older buildings and properties that have
exceeded their useful life. Multi-family housing options are ideal for young professionals and seniors
who are not looking for a single-family home but want to live in or remain in the community. Looking
at ways to redevelop or repurpose older shopping centers, publicly-owned buildings or lands, or
integrating additional uses in an office park are examples of where housing options can be expanded
in a largely built-out suburban community.

MICHIGAN HOMEOWNERSHIP STUDY 46
Small Town Rural - Alpena
Large swaths of Michigan are comprised of undeveloped rural lands with small towns and villages
dotting the landscape. To capture the housing challenges and opportunities in these places, the Small
Town Rural typology is intended to reflect geographically isolated communities with small
populations, fewer employment opportunities, and lower median household incomes. Owner-
occupied housing in these areas tend to be older and are primarily single-family or manufactured
homes. Multi-family condominiums are less common in these communities. As part of a larger
national shift towards urban places, many rural communities have not seen population growth, with
some experiencing population decline. The combination of population declines, and few employment
opportunities has created a housing market with affordable prices but homes that need rehabilitation
and renovation.
DEMOGRAPHICS
Alpena is a rural community of about 10,000 residents located on the northeast tip of Michigan along
the shores of Lake Huron. The city is geographically isolated with the nearest interstate connection to
I-75 seventy miles away. Alpena has a long history of manufacturing dating back to the 1800s with
logging and continuing today at its working waterfront. Small businesses, a regional medical center,
and a community college provide much of the employment base in Alpena and the surrounding
region. The city has several parks, trails, and rivers making it an attractive destination during the
summer, especially for those traveling towards Mackinac Island.
Demographic trends in Alpena show the population is shrinking and getting older. Between 2011 and
2016, population declined by 3 percent.
35
Most age cohorts declined over this period except for
residents ages 18 to 24 and 55 to 64. Presently, about 33 percent of the population is over 55 years old.
Part of the challenge for older residents in rural areas is access to transportation and services, and the
ability to find a variety of housing choices that meet your needs financially and are accessible as
mobility becomes more of a challenge over time.
35
American Community Survey 2007-2011, 2012-2016, Table B01001, 2018
Credit: Downtown Alpena Michigan, www.alpenadda.com

MICHIGAN HOMEOWNERSHIP STUDY 47
INCOMES AND EMPLOYMENT
The median household income in Alpena is $35,490, as compared to the state median of $50,803.
36
The
lower household incomes can be attributed to the rural nature of the economy which tends to have
lower average wages for workers. Interestingly, households earning $35,000 to $100,000 increased
across the board in Alpena following the same trend as Prosperity Region 3. The city saw a very large
percentage decrease in the number of households earning at or above $150,000 a year, which
translated into a loss of only forty households.
Alpena is the primary population and employment center Prosperity Region 3 and has a large
employment base relative to its size. Employees come from many surrounding townships, cities, and
counties for work each day. The largest employers in the area are the City of Alpena and Alpena
Medical Center. The hospital was recently acquired by the University of Michigan and an investment
program of nearly $60 million is expected to elevate the hospital to a regional hub.
37
36
American Community Survey 2007-2011, 2012-2016, Table B19013, 2018
37
https://www.mlive.com/news/saginaw/index.ssf/2018/01/59_million_expansion_planned_f.html
Figure 19: Change in Population by Age
-14%
10%
-10%
1%
-9%
11%
0%
-8%
1%
2%
-13%
-11%
10%
16%
-6%
2%
3%
-10%
-8%
12%
14%
-15%
-10%
-5%
0%
5%
10%
15%
20%
Under 18 18 to 24 years 25 to 34 years 35 to 44 years 45 to 54 years 55 to 64 years 65+ years
Percent
Change in Population, 2011-2016
Source: ACS
Alpena Prosperity Region 3 Michigan

MICHIGAN HOMEOWNERSHIP STUDY 48
HOUSING MARKET
Since 2011, the housing market in Alpena has shifted from ownership to rental at a rate twice as fast
as that of the region and state. Over this period, the ownership stock in the city shrunk by 17 percent
while renter households increased by 31 percent.
38
The number of vacant units increased by 57
percent, driven by an increase in units for rent and more seasonal housing added to the market. While
a smaller second home market than places like Traverse City or Holland, Alpena has seen an uptick
in seasonal housing where price points are substantially lower than in other lake front communities.
AGE OF STRUCTURE
Owner-occupied housing in Alpena is skewed toward the older end of the spectrum with 72 percent
of all owner units constructed before 1959. Only 2 percent of owner units were constructed after the
38
American Community Survey 2007-2011, 2012-2016, Table B25003, 2018
Table 4. Housing Units
Tenure
Alpena
Alpena
Prosperity Region 3
Michigan
2011
2016
Change
% Change
% Change
% Change
Owner-Occupied 3,294 2,737 -557 -17% -2% -3%
Renter-Occupied
1,340
1,756
416
31%
15%
11%
Vacant 348 548 200 57% -2% -3%
Total
4,982
5,041
59
1%
0%
0%
Source: American Community Survey 2007-2011, 2012-2016, Table B25003, 2018
Figure 20: Change in Household Income
6%
-17%
-32%
16%
9%
3%
7%
-51%
-5%
-10%
-3%
1%
9%
11%
16%
10%
-3%
-3%
-2%
-2%
0%
0%
7%
24%
-60%
-50%
-40%
-30%
-20%
-10%
0%
10%
20%
30%
Less than
$15,000
$15,000 -
$24,999
$25,000 -
$34,999
$35,000 -
$49,999
$50,000 -
$74,999
$75,000 -
$99,999
$100,000 -
$149,999
$150,000 or
more
Percent
Change in Household Income, 2011-2016
Source: ACS
Alpena Prosperity Region 3 Michigan

MICHIGAN HOMEOWNERSHIP STUDY 49
year 2000.
39
With population decline and a rise in vacancy, older structures may become less desirable
in Alpena and fall into disrepair if owners fail to maintain them over time.
OWNER-OCCUPIED HOME PRICES
The median sale price for owner-occupied homes in Alpena remained relatively stable between 2012
and 2018, increasing only 12 percent over a period of six years to $89,500. Unlike the other case study
communities, Alpena had very few (if any) sales of new homes to use as a comparison to existing
single-family and condominiums. The lack of new owner-occupied housing was confirmed through
conversations with City staff who indicated much of the new housing construction has taken place
outside the city limits in the surrounding townships. There is a soft market for new construction of
ownership units in the city limits, rather what exists are opportuntites for rehabilitation of older
existing structures.
PRICING BY YEAR BUILT
Between 2012 and 2018 there were 2,050 home sales with a median price of $96,808.
40
Homes sales of
structures built between 1950-1970 were the most numerous with 345 sales and a median sales price
of $82,500. Home prices escalate quickly with newer homes as the median sale price for homes built
between 1990 and 2010 doubles to $166,750. While only six homes built after 2010 sold over the last
six years, the median price point of those sales was nearly $208,000.
The condominum market in Alpena had very few sales between 2012 and 2018, with an average of
eleven sales per year. However, prices for newer condos built between 1990 and 2010 are commanding
an 85 percent price premium over condos built in earlier decades. Interestingly, condos in the Alpena
market on average are selling for $10,000 more than single-family homes. This is due to the fact that
most of the condos are newer than the average single-family home, and tend to be located in structures
with two to four units. The condo units tend to be larger and include newer amenities and layouts
than some of the older single-family homes in Alpena.
39
American Community Survey 2007-2011, 2012-2016, Table B25036, 2018
40
Multiple Listing Service (MLS) Data, Michigan Board of Realtors, RKG Associates, 2018

MICHIGAN HOMEOWNERSHIP STUDY 50
Figure 21: Median Owner-Occupied Sales Price
$0
$20,000
$40,000
$60,000
$80,000
$100,000
$120,000
$140,000
$160,000
2012 2013 2014 2015 2016 2017 2018
Sales Price
Alpena Median Sales Prices, 2012 - 2018
Source: MLS
Existing Single Family New Single Family Existing Condo New Condo
Home price
affordable to
household at
median income
Figure 22: Median Owner-Occupied Sales Price by Year Built
$101,661
$60,420
$82,500
$102,225
$159,650
$207,925
$0
$0 $0
$94,000
$173,850
$0
$0
$50,000
$100,000
$150,000
$200,000
$250,000
Before 1900 1900 - 1950 1950 - 1970 1970 - 1990 1990 - 2010 2010 - 2018
Sales Price
Alpena Median Sales Price by Year Built, 2011-2016
Source: MLS
Single Family Condo
MICHIGAN HOMEOWNERSHIP STUDY 51
HOMEOWNERSHIP CHALLENGES IN ALPENA
OLDER HOUSING STOCK
Based on the median household income of $35,490 and a median sales price of $89,500, owner-
occupied housing in Alpena is generally affordable to those households earning at or above median
income. The biggest issue Alpena faces is the abundance of older homes and the long-term
maintenance and potential rehabilitation associated with them. As was noted earlier, 72 percent of
owner-occupied units in Alpena were constructed more than sixty years ago. Depending on the
condition of the property, some renovations can be bank financed, while others require capital from
the homeowners themselves. Rehabilitation dollars are available from organizations such as MSHDA,
but only a finite amount of funding is available.
LACK OF AFFORDABLE NEW PRODUCT
Housing development in Alpena is centered more around rehabilitation of existing structures rather
than building new. New housing that is being constructed in the Alpena area tends to occur in the
township surrounding the city. These areas have large tracts of land for developers to build larger
homes on larger lots. As a result, the city is not seeing much in the way of new housing and those that
are constructed tend to be listed at price points well above what would be affordable to the those at
or below the median household income. Recent new housing construction has trended toward rental
developments with some utilizing tax credit financing and funding from state partners such as MEDC.
MICHIGAN HOMEOWNERSHIP STUDY 52
STRATEGIES TO ADVANCE HOMEOWNERSHIP OPPORTUNITIES
The challenges Michigan faces in providing residents with affordable homeownership opportunities
are varied and complex depending on the location and the strength and depth of the market. Based
on RKG’s assessment of Michigan’s existing homeownership stock, the state does not have enough
units today to support the future growth in households through the year 2045. The existing housing
stock faces the following challenges:
• Michigan’s ownership housing stock is older, and units may not have the layout, systems, or
amenities today’s homebuyers are looking for.
• Many vacant ownership units have not been maintained over time and will require
substantial rehabilitation.
• Communities with housing capacity may have declining population and fewer economic
opportunities that will attract new residents.
• Communities with housing demand as well as supply shortages are seeing prices escalate,
thereby creating an affordability issue for existing residents and those looking to locate there.
• Zoning and other regulatory barriers hold back or prolong the development process resulting
in fewer units created and higher price points.
• New employment opportunities or expansions may not be aligned with housing production
or rehabilitation to meet the demand from new employees.
• The combination of stricter lending practices necessitated by the housing crisis, growing debt
loads from student loans and other borrowing, and wages not keeping pace with costs are
making it more difficult to purchase a home.
• Financial resources for housing programs are shrinking, forcing all levels of government to
do more with less.
To address housing issues today and into the future, RKG has compiled a set of strategies, each
informed by the data analysis performed at the state and Prosperity Region levels, the more than
eighty individual interviews with housing professionals across Michigan, four local case studies, and
an assessment of existing housing programs. The strategies presented are a mix of tools and actions
that span geographies from the state down to local municipalities. These strategies are intended to be
a toolkit which can be mixed and matched based on market conditions, available funding, and the
overall goals of the organization or municipality implementing them. For ease of use, we have
identified the case study community type(s) that could benefit from each strategy. In some instances,
a strategy may be applicable to all four community types and could be applied state-wide.
The strategies and actions are grouped under four categories, each addressing a larger-scale issue
impacting homeownership in Michigan:
• Finance Tools. Access to capital, whether for an individual buyer or a developer, is critical to
ensuring home starts and home purchases can happen. Whether it is providing down payment

MICHIGAN HOMEOWNERSHIP STUDY 53
assistance for a first-time home buyer or tax credits to help with a development’s capital
stack
41
, different markets require different finance tools. These strategies address gaps in
financing and ways to enhance or restructure existing programs.
• Rehabilitation & Preservation Tools. Across parts of Michigan, communities and regions are
facing high vacancy rates, deferred maintenance, and homes that are not ready to re-enter the
market. Buyers in weaker market areas are finding it difficult to pull together financing to both
purchase a home and complete the necessary rehab due to lending criteria and the difficulty
of finding sales comps in the area. Oftentimes, the cost to rehab a unit may be higher than the
actual purchase price. Strategies that provide rehabilitation funding and neighborhood
stabilization/preservation tools can help bring existing ownership units back on the market.
• Land Use & Zoning Tools. Land use, zoning, and permitting are local tools that communities
have direct control over and impact the type of homeownership units that can be built, the
location of those units, and the time it takes to build them. Adjusting these regulations can
help with predictability of approvals, speedup delivery of units, and lower developer risk.
• Economic Development Tools. Housing and jobs are inextricably linked and aligning
employment opportunities with affordable housing is an important step to attracting and
retaining employees. These strategies provide opportunities for the public sector and private
sector to act in unison to help businesses thrive and employees find housing they can afford.
To increase the effectiveness of the tools, we suggest a layering of programs and funding sources to
provide a maximum level of benefit to homeowners. In additional to financial tools, the layered
approach could also incorporate additional programs such as economic development and
infrastructure grants, rehabilitation assistance, and demolition programs to increase the impact in
more challenging markets across Michigan. The layering of programs and subsidies could also be
structured in a way that helps low- to moderate-income households access high-opportunity areas
across the state where homeownership prices have far outpaced affordability. In these cases, financial
assistance programs may be most effective and layering down payment assistance, low-interest rate
loans, and/or rehabilitation assistance to qualified homebuyers could help to open access to a wider
range of communities for low- to moderate-income households.
Finally, homeownership tools must be selected in the context of the entire housing market to be
effective. Homeownership is not the best housing option for all households, so a local housing strategy
must pair these tools with options for safe and adequate rental housing. In some communities,
targeted increases in the supply of rental housing may be an effective tool for increasing affordable
homeownership opportunities, such as by creating neighborhood-based senior apartments that allow
residents to age-in-place within their communities, freeing up larger homes for new homeowners.
41
Capital stack refers to the variety of funding and finance sources used by a developer to fund a project.

MICHIGAN HOMEOWNERSHIP STUDY 54
FINANCE TOOLS
Access to capital, whether for an individual buyer or a developer, is critical to ensuring
home starts and home purchases can happen. Whether it is providing down payment
assistance for a first time home buyer or tax credits to help with a development’s capital
stack, different markets require different finance tools. These strategies address gaps in
financing and ways to enhance or restructure existing programs.
Strategy 1: Down Payment Assistance
Strategy
Down payment assistance programs are one of the best ways to
provide financial assistance to first time homebuyers. Organizations
involved in assisting homebuyers, non-profits, and municipalities
should look for ways to create new down payment assistance
programs in locations that are not currently well-served, expand
existing programs, and look for ways to increase assistance amounts
for buyers in higher priced markets. Down payment amounts should
be tailored to the market being served and tied back to the goals of the
organization offering the assistance. It may be necessary to provide
higher down payment amounts in locations where housing costs are
much higher.
Advantages
Saving for a down payment can be a major obstacle for first time
homebuyers looking to purchase a home. Down payment assistance
provides the financial boost for buyers in communities facing high
housing prices and to lower-income households needing more
assistance.
Challenges
Identify funding sources to support new programs, expand existing
programs, or offer higher down payment amounts in more expensive
markets. Potentially setting someone up for failure if other services
like credit counseling, budgeting, and home maintenance assistance
are not included. It is important to recognize that some households
may not be in a financial position for homeownership.
Action Steps
Help organizations that work across the housing spectrum and
municipalities identify down payment assistance needs in their
markets. Ensure asset limitations are appropriately set so
householders have enough savings to cover basic maintenance if an
issue occurs. Identify ways down payment assistance programs could
be created or expanded to provide additional resources to first time
homebuyers across Michigan.
Applicability
All Community Types.

MICHIGAN HOMEOWNERSHIP STUDY 55
Strategy 2: Low Interest Rate Mortgage
Strategy
It is important to recognize that low interest rate mortgages are a tool
to help homebuyers secure a mortgage at rates below the market
average, thereby allowing the buyer to afford more house or have a
lower monthly payment. Policymakers and funders should look for
ways to expand these programs where possible and find additional
outlets for marketing these products to potential homebuyers who
qualify.
Advantages
Provides a mortgage financing tool for homebuyers with a favorable
interest rate to lower monthly costs or provide more purchasing
power. This tool is helpful in communities with escalating housing
prices, and households not experiencing similar wage growth.
Enables more households to become homebuyers.
Challenges
Awareness of the program among lenders and participation in the
program among homebuyers across Michigan.
Action Steps
Organizations involved in encouraging homeownership should look
for ways to encourage additional low interest rate programs to
expand the availability for qualified buyers.
Applicability
All
C
ommunity Types and Qualified Borrowers.

MICHIGAN HOMEOWNERSHIP STUDY 56
Strategy 3: Land Disposition Strategy
Strategy
Vacant lots and structures are major issues in economically-
challenged municipalities. In some cases, land banks exist but are
unsure of best practices for disposition of assets. In other cases, a
land bank may not exist but could be helpful. Organizations involved in
helping with the disposition of land should look for ways to provide
direct technical assistance to municipalities and land banks to help
them understand market potential, development feasibility, and
creation of disposition strategy.
Advantages
Provides communities funding for technical assistance on landbank
asset disposition to increase neighborhood development and expand
tax base. Help landbanks reduce holdings.
Challenges
Land disposition plans and local market realities may be at odds.
Technical assistance would be most helpful in communities where the
market has begun to turn the corner.
Action Steps
Identifying communities with concentrations of landbank holdings.
Look for experts in the area who could provide technical assistance.
Coordinate with Michigan Land Bank Fast Track Authority. Secure
funding source(s) to pay for technical assistance.
Applicability
Targeted to low-income communities with significant landbank
holdings.

MICHIGAN HOMEOWNERSHIP STUDY 57
Strategy 4: Infrastructure Grants
Strategy
In markets where homeownership projects are on the cusp of being
financially-feasible, it can be important to look for ways to provide
funding to help offset infrastructure costs for transportation projects,
site work, utilities, soft cost loans/grants, etc. Funding assistance for
these types of expenditures can sometimes mean the difference
between a project that gets out of the ground and one that does not.
Organizations involved in funding homeownership projects,
foundations, and municipalities should find ways to assist or share in
the cost of these expenditures where possible to increase financial
feasibility.
Advantages
Upgrades in infrastructure and neighborhood amenities adds value to
homes. Upgrades could also help spark reinvestment in the larger
homeownership market. Helps developers and builders offset
development costs.
Challenges
Funding limitations. Infrastructure development is long-term and
requires strategic planning.
Action Steps
Identify potential funding sources or new programs that could be used
to assist with these development expenditures.
Applicability
All Community Types.

MICHIGAN HOMEOWNERSHIP STUDY 58
REHABILITATION AND PRESERVATION TOOLS
Across parts of Michigan, communities and regions are facing high vacancy rates,
deferred maintenance, and homes that are not ready to re-enter the market. Buyers in
weaker market areas are finding it difficult to pull together financing to both purchase a
home and complete the necessary rehab, due to lending criteria and the difficulty of
finding sales comps in the area. Oftentimes, the cost to rehab a unit may be higher than
the actual purchase price. Strategies that provide rehabilitation funding and
neighborhood stabilization/preservation tools can help bring existing ownership units
back on the market.
Strategy 1: Rehabilitation Loan Program
Strategy
Accessing rehabilitation funding for existing homeowners can be
challenging, especially in markets where the cost of home repairs may
exceed the value of the home. These funds are needed to ensure the existing
housing stock does not fall further into a state of disrepair. Funding for these
repairs is critical and housing organizations, non-profits, and municipalities
should identify ways to create programs and pathways for existing
homeowners who need rehab dollars.
Advantages
Rehabilitation loans allow homeowners to reinvest in their homes to ensure
long-term value of the home. Program fills funding gap for low-income
homeowners who lack capital to finance upgrades.
Challenges
Requires long-term deployment of capital on the part of the funding entity.
Increases portfolio risk for the lender.
Action Steps
Identify new programs and resources that could be deployed by non-profits,
organizations engaged in furthering homeownership, foundations, or
municipalities. Identify target areas or neighborhoods where rehabilitation
is most needed to stabilize the market.
Applicability
Concentrate program in neighborhoods/areas with most need. Use program
to boost comparables and help stabilize values.
Rehab Loan Program Example
Minnesota Housing offers a rehab loan program to
existing homeowners that provides up to $27,000 on a
15 year loan for safety, habitability, energy efficiency,
or accessibility improvements. The owner must
occupy the unit and be current on their taxes and
mortgage. Loans are forgiven if the owner does not
sell, transfer title, or cease to occupy the property
during the loan term.
For more information visit Minnesota Housing
.
Image: cob.org

MICHIGAN HOMEOWNERSHIP STUDY 59
Strategy 2: Rehabilitation Gap Financing
Strategy
A primary challenge in some of Michigan’s housing markets is the inability to
obtain financing for both the purchase and rehabilitation of an existing home.
Homes that are affordable to low- and moderate-income households may
need rehabilitation, but the cost of rehab and acquisition together could
greater than the home is worth. In these cases, lenders are reluctant to fund
both acquisition and rehab. Gap financing solutions should be identified to
provide capital to homebuyers willing to purchase and rehabilitate homes in
locations where comparable properties do not exist today. Organizations
involved in furthering homeownership, non-profits, foundations, and
lenders should identify sources of flexible funding that could be used in
combination with a mortgage to help close the funding gap.
Advantages
Consolidates financing to a single loan, rather than having both a traditional
loan and separate construction loan, minimizing fees. Directs rehabilitation
dollars to areas where rehabilitation of the existing housing stock can open
up opportunities for more affordable homes.
Challenges
Loan guarantees increase portfolio risk. Lenders may not be amenable to
such an arrangement without additional financial subsidy. Finding a funding
source flexible enough to protect lenders from risks. Also, the availability of
skilled trades to complete the rehab work within program guidelines can be
an obstacle; this has proven to be a challenge for the Detroit Home Mortgage
program, which helps address the appraisal gap in purchase/rehab
financing.
Action Steps
Housing organizations and non-profits should work with lenders to identify
funding gaps in target areas. Identify a variety of funding sources that could
be used to bridge the gap between the value of the home and the cost of
acquisition and rehabilitation.
Applicability
All Communities.
Rehabilitation Gap Financing Program
One of the challenges and barriers in Michigan’s homeownership market is the fact that many older
homes have not been consistently maintained over time and require rehabilitation before a new owner
can move in. The difficulty with acquisition and rehab in some areas of Michigan is there are a lack of
comparable properties that provide lenders with the confidence that the cost of rehabbing the home
will result in an appraisal at or above the combined cost of the acquisition and rehab loan. To assist
homebuyers who are willing to take on the challenges of rehabilitation, organizations involved in
furthering homeownership, non-profits, foundations, and lenders should identify sources of flexible
funding that could be used in combination with a mortgage to help close the funding gap. This could
come in the form of a grant through a philanthropic organization with a mission of investing in
neighborhoods with high levels of vacancy or dilapidation. The grant could be used to finance the
funding gap between what the lender can provide and the cost of acquisition/rehab.

MICHIGAN HOMEOWNERSHIP STUDY 60
Strategy 3: Neighborhood Development Program
Strategy
Foundations or other housing organizations could work closely with
municipalities to identify key neighborhood improvements that could help
stabilize or increase homeownership prices. Through a neighborhood
development program, matching funds could be made available for creating
more livable communities through investment in neighborhood amenities
such as sidewalks, schools, and public facilities. The program could be
competitive across municipalities, and may encourage municipalities to put
more funding in as a match for local projects..
Advantages
Communities lead by investing in particular neighborhoods. Funding from
this program augments total dollars spent in each community. Communities
are accountable for planning and delivering projects. Investment in
neighborhoods increases local property values and local interest in the
community.
Challenges
Equitable distribution of funding across all areas of need. Some of the
hardest-hit communities may receive a disproportionate share of funding.
Action Steps
Create programmatic language and neighborhood development evaluation
criteria. Secure funding source(s) to implement the program.
Applicability
All Community Types.
Community Infrastructure Program Example
Maryland’s Sustainable Communities Act of
2010 established a shared geographic
designation to promote efficient use of scarce
State resources based on local sustainability
and revitalization strategies. The Sustainable
Communities program consolidated
geographically targeted resources for historic
preservation, housing and economic
development under a single designation. The
designation places special emphasis on
infrastructure improvements, multimodal
transportation and development that
strengthens existing communities.
For more information visit Maryland
Sustainable Communities Act.
Image: dhcd.maryland.gov

MICHIGAN HOMEOWNERSHIP STUDY 61
Strategy 4: Demolition Fund
Strategy
In economically-challenged locations across Michigan, municipalities
face vacant homes and blighted structures which drive down property
values. Selective demolition has been underway in many places, but
more work is needed. Demolition funds or programs would provide
added financial assistance to municipalities to implement specific
blight remediation initiatives. Funding for these types of programs
could be provided to municipalities on a matching basis to stretch
funds further.
Advantages
Enables local communities to determine and prioritize areas needing
blight remediation through demolition. Helps address immediate
solution of vacant and abandoned homes that are beyond repair.
Removal of blighted properties increases remaining home values.
Challenges
Safe demolition of properties has significant monetary and
environmental costs. Demolition is first step towards redevelopment,
which is a long-term process. Would require long-term funding
sources to guarantee availability of program and funding.
Action Steps
Organizations engaged in advancing homeownership, non-profits,
foundations, and municipalities should work together to create new
demolition funding programs. These entities should work together to
understand funding needs and best sources for the programs.
Applicability
Urban with Economic Challenges, Small Town Rural.

MICHIGAN HOMEOWNERSHIP STUDY 62
LAND USE AND ZONING TOOLS
Land use, zoning, and permitting are local tools that communities have direct control over
and impact the type of homeownership units that can be built, the location of those units,
and the time it takes to build them. Adjusting these regulations can help with predictability
of approvals, speed up delivery of units, and lower developer risk.
Strategy 1: Diversifying Product Types
Strategy
Offering a variety of homeownership product types in a city or
township provides options for households with various needs,
desires, and income levels. Organizations engaged in advancing
homeownership should work to encourage municipalities to
update/change zoning to allow for a wider range of housing types that
could include duplexes, 3-4 unit buildings, multi-family
condominiums.
Advantages
Provides a variety of housing types at different price points. Offers a
housing product to residents in different life stages. Provides denser
housing options to help offset land costs.
Challenges
Density could be met with resident opposition. Introducing different
product types into single-family zones could be challenging. Doesn’t
necessarily address affordability issues.
Action Steps
Identify products that would be appropriate in different community
types. Offer model zoning language that could be modified and
adopted locally, particularly for housing types not common in every
community, such as fee-simple townhomes. Provide financial
incentives or a robust technical assistance fund to help offset cost of
writing/adopting zoning. This could take the form of a state sponsored
technical assistance program to support these types of changes at the
local level.
Applicability
All Community Types.

MICHIGAN HOMEOWNERSHIP STUDY 63
Strategy 2: Zoning Code Reform
Strategy
Encourage municipalities to update/change zoning to focus on
allowable uses and design that is context-sensitive instead of use and
density measures.
Advantages
Integrates a variety of housing types into the community’s
development fabric and neighborhoods. Provides developers with
flexibility to meet market demands. Creates a more predictable
process for developer and municipality.
Challenges
Requires re-education on zoning. Residents may not want other
housing types in traditional single-family districts. Can be expensive
to create new zoning codes.
Action Steps
Organizations engaged in helping municipalities understand zoning
changes could produce educational material on zoning code reforms.
Sponsor an educational conference or speaker tour around the state
on high-impact incremental changes to zoning codes. Create a
technical assistance fund for municipalities to help offset costs of
production and adoption of code reforms.
Applicability
All Community Types.
Zoning Code Reform Example
Recognizing that many Michigan communities have
unique qualities and challenges, yet similar economic
and cultural forces. The Michigan Municipal League,
Congress for the New Urbanism, and MEDC developed
this guide to help communities implement
incremental changes to their local codes. The areas of
reform cover form, use, frontage, parking, and
streetscape and are intended to help with challenges
related to downtowns, main streets, and
neighborhoods adjacent to these two commercial
districts. The suggested code reforms are intended to
help reduce or remove barriers to development while
ensuring the character of the place remains intact.
These low-cost high-impact code reforms are the first
steps in revamping old and outdated zoning codes in
Michigan.
For more information on the code reforms refer to The
Project for Code Reform.
Image: MML

MICHIGAN HOMEOWNERSHIP STUDY 64
42
Cluster zoning is a zoning method in which development density is determined for a specified area, rather than on a lot-
by-lot basis. Cluster zoning is specifically enabled in the Michigan Zoning Enabling Act, under MCL 125.3503.
43
Incentive zoning is a relaxation of zoning restrictions on developers in exchange for public benefits like building a desired
public improvement or building in a low-income area.
Strategy 3: Cluster/Reduced Minimum Lot Sizes
Strategy
Encourage municipalities to adopt cluster zoning or reduce minimum lot
sizes for subdivisions.
42
Advantages
More efficient use of land. Reduces infrastructure costs. Promotes open
space. Could include small density bonus for developer.
Challenges
Fears of density and homes “too close together”. Ensuring minimum
acreage for cluster development matches availability of land.
Action Steps
Organizations engaged in helping municipalities change zoning could
produce educational material on benefits of cluster development and/or
reduced minimum lot sizes. Create a funding pool to help municipalities
develop and adopt cluster zoning tools. Prioritize places that layer cluster
zoning with expedited permitting.
Applicability
Focus on Aging Suburban and Small Town Rural.
Strategy 4: Incentive Zoning and Density Bonus
Strategy
Encourage municipalities to adopt incentive zoning provisions in return for
affordable housing or amenities.
43
Advantages
Provides additional housing units to spread development costs across.
Gives municipalities incentive to negotiate for affordable housing.
Challenges
Fears of density and traffic. Ensuring density bonus could actually be
accommodated on the parcel of land.
Action Steps
Produce educational materials on best practices and examples of incentive
zoning and density bonus programs. Show how these tools can help with
financial feasibility of development.
Applicability
Urban Affordability and Aging Suburban.

MICHIGAN HOMEOWNERSHIP STUDY 65
ECONOMIC DEVELOPMENT TOOLS
Housing and jobs are inextricably linked and aligning employment opportunities with
obtainable workforce housing is an important step to attracting and retaining employees.
These strategies provide opportunities for the public sector and private sector to act in
unison to help businesses thrive and employees find housing they can afford.
Housing and jobs are inextricably linked and aligning employment opportunities with
Strategy 1: Employer-Funded Housing Fund
Strategy
It can be challenging for smaller employers, particularly those
engaged in seasonal work or tourism to cover housing costs for
employees. One option could be to create a housing fund paid into by a
group of smaller employers that could be used to help offset some
portion of housing costs for employees. This fund could possibly be
matched by a housing organization, non-profit, or foundation working
to advance homeownership opportunities.
Advantages
Provides housing subsidy for workers who most need it. Allows
workers to live closer to jobs, thereby reducing transportation costs.
Challenges
Getting employers to levy a fee on themselves.
Action Steps
Bring smaller businesses together to create a pool of capital that
would help fund an employee housing program. This could be
particularly effective in tourism-based economies where housing
costs quickly outpace wages for hospitality workers. This program
could be evaluated for serving both seasonal and year-round
workers.
Applicability
All Communities.

MICHIGAN HOMEOWNERSHIP STUDY 66
Strategy 2: Employer Location Incentives
Strategy
Where employers choose to locate can bring positive impacts to a
community, particularly if employees live and do business in the
community. If housing options are not available for employees, it can
force longer commutes or serve as a disincentive for business
investment. Incentivizing employers to locate in areas where housing
is available is a strategy that could help revitalize older
neighborhoods and bring economic benefits to more challenged
markets.
Advantages
Incent employers to locate where housing is available, and jobs are
needed. New investment from employees can bolster neighborhoods,
potentially encourage others to invest in the housing stock as well.
Challenges
Employers make location decisions based on a wide range of factors.
Some employers may not pay their employees enough for them to
afford homeownership.
Action Steps
Organizations focused on advancing homeownership, non-profits,
municipalities, foundations, and economic development organizations
could partner to design a program that would offer financial
assistance to employees locating in targeted areas where housing is
available. Funding sources would need to be identified for these
programs. A broad marketing program would be needed and shared
with potential employers looking to locate or expand in Michigan.
Applicability
Focused on Urban with Economic Challenges and Small Town Rural.

MICHIGAN HOMEOWNERSHIP STUDY 67
Strategy 3: Trade Worker Training Program
Strategy
Many construction trade jobs became vacated in Michigan after the Great
Recession making it difficult for builders and homeowners to find qualified
trade workers for residential projects. A trade worker training program
could help encourage residents to enter the profession, receive training, and
provide an incentive bonus for remaining in the profession for a set amount
of time.
Advantages
Helps to fill a critical need in the construction industry. Offers job
opportunities for those not pursuing a college education, or who are
unemployed/underemployed. Builds a workforce to help create more
homeownership opportunities.
Challenges
Finding enough people to go into trade programs. Creating the connections
between trainers and employers.
Action Steps
Organizations focused on economic development, education, and workforce
development could partner to create a program that partners schools and
training facilities with employers and offers students incentives such as free
or reduced tuition, a bonus that kicks in after five years of work, or an
account set up to help subsidize down payment on a home.
Applicability
All Communities.
Trade Worker Training Example
WorkSource DeKalb, in DeKalb County, Georgia provides workforce investment activities to
increase employment, retention and earnings of participants. Employment and trainings are
targeted at filling industry-specific needs which currently includes building trades and
construction. Residents seeking enhanced skills and training can gain access to education
programs through WorkSource, but only for the occupations in need. As the economy shifts,
WorkSource also changes industry sector trainings and eligibilities to keep the workforce
current and marketable in today’s economy.
For more information on DeKalb County’s workforce programs visit WorkSource DeKalb.
Images: mantec.org

MICHIGAN HOMEOWNERSHIP STUDY 68
Strategy 4: Anchor Institution Partnership Program
Strategy
Anchor institutions such as colleges, universities, and hospitals play an
important role in bringing jobs and people to communities. Recognizing that
not all workers can afford housing where their employer is located, a
program could be established that provides housing assistance to
employees who qualify. A partnership could be formed between economic
development organizations, housing organizations, and anchor institutions
to develop a program that provides some form of housing subsidy for lower
wage workers.
Advantages
Provides housing cost subsidy for workers who most need it. Provides
incentives for employees to invest in neighborhoods close to anchor
institutions.
Challenges
Finding anchor institutions that are willing to participate and administer the
program.
Action Steps
A partnership would need to be identified between various economic
development and housing organizations where anchor institutions exist. A
program could be developed that offers a housing subsidy to employees that
fall below the prevailing wage for the industry’s Standard Occupation Code
(SOC). If an employee falls below the wage line, he or she is eligible for the
subsidy. Funding sources would need to be identified to capitalize the
program.
Applicability
All Communities.
Employer Assisted Housing Example
The Employer-Assisted Housing Program assists full-
time benefits-eligible University of Chicago and
University of Chicago Medicine employees with their
home purchase in the neighboring communities. The
program provides up to $10,000 in down payment
assistance. Rental reimbursement up to $2,400 is also
available for new renters in portions of nearby
neighborhoods. Through this program, the University
strengthens its connections to surrounding
neighborhoods, retains valuable employees, and
helps staff optimize their work-life balance. Income
restrictions do apply to households earning over a
certain amount.
For more information on the program visit the
University’s website.
Image: University of Chicago, and NPR.
MICHIGAN HOMEOWNERSHIP STUDY 69
DATA SOURCES AND METHODOLOGY
The data used for the housing analysis comes from a variety of both public and private sources. Basic
demographic data comes sources such as the U.S. Census Bureau American Community Survey
(ACS). This resource is publicly available data that is both transparent and reproducible. Housing data
used for the study includes data from the ACS, U.S. Department of Housing and Urban Development
(HUD), Regional Economic Models Inc. (REMI), and the Michigan Association of Realtors. The
housing data is used in the analysis to understand the baseline conditions of the State and Prosperity
Regions, and to provide context for understanding needs and gaps.
Information about employment and wages was obtained from the Census Bureau data resource
Longitudinal Employer-Household Dynamics Quarter Workforce Indicators, which provides data
related to wages and employment sectors. This data is helpful in framing the socioeconomic
circumstances of the State and Prosperity Regions.
Projections data comes from the industry standard proprietary source REMI. This data provides
projection data to the year 2045 in five-year increments. The projections provide a reasonable forecast
of population, household, and employment. This information can help the State match future
demographic changes with policy goals.
To supplement hard data and provide a better understanding of the nuances found across the state,
qualitative data was obtained. This information was obtained via interviews with stakeholders and
officials. The individuals interviewed included state officials and policy makers, developers, real
estate brokers, affordable housing advocates, and community groups. These interviews are a method
of obtaining data that is real-time and hyper-local to Michigan and is critical for understanding the
greatest needs.
Aside from a rigorous quantitative analysis, thematic mapping was conducted to visualize existing
demographic and housing conditions for specific variables. The visual representation of the data
provides the necessary context to understand the Prosperity Regions.
