
Studio360
powered by
Smartware Studio
TM
Reporting Guide
Version 5.4.2
May 2024
Smartware Technologies
910 Niagara Falls Blvd.
Tonawanda, NY 14223
Sales and Support
(716) 213-2222
www.smartwaretech.com
Page 2 Smartware Studio Reporting Guide
All material is Copyright © 2018-2022 Smartware Technologies Group, LLC. All rights
reserved.
Microsoft is a registered trademark and Visio is a trademark of Microsoft Corporation. TAC,
Invensys and I/A Series are registered trademarks of Schneider Electric. Designer Suite and
Smartware Studio are trademarks of Smartware Technologies Group, LLC.
Smartware Studio Reporting Guide Page 3
Table of Contents
1. INTRODUCTION / ABOUT THIS GUIDE ....................................................................... 5
2. OVERVIEW OF REPORTS ............................................................................................ 7
Excel Reports ....................................................................................................................................... 7
Excel File Format ........................................................................................................................ 7
Multi-Page Workbook Reports .................................................................................................... 7
Macros in Excel Reports .............................................................................................................. 8
Word Reports ....................................................................................................................................... 8
Word File Format ........................................................................................................................ 8
Report Groups ...................................................................................................................................... 9
Parameters for Report Groups .................................................................................................... 9
Email Reports ......................................................................................................................................10
Report Folders .....................................................................................................................................10
Location of Report Files .............................................................................................................11
Creating Custom Reports ...........................................................................................................12
Distributing Custom Reports ......................................................................................................12
Hiding Reports from a Report List .............................................................................................13
3. THE REPORTS TAB ................................................................................................... 15
Report Options ....................................................................................................................................15
Show Reports ..............................................................................................................................15
Save Reports ...............................................................................................................................15
Generate PDF Reports ...............................................................................................................16
Run Reports Individually ............................................................................................................16
Send Reports to Printer ..............................................................................................................16
Show File Extensions ..................................................................................................................16
Other Common Controls .....................................................................................................................16
View Data Sources......................................................................................................................16
Open Report Template Folder ....................................................................................................16
Use Flexcel and Flexword ..........................................................................................................17
Estimating Options ..............................................................................................................................17
Including Material based on ‘Show On Bom’ ............................................................................17
Selecting Systems for Reports .....................................................................................................18
Designer Options .................................................................................................................................19
Select Files or Systems ...............................................................................................................19
SmartStruxure I/O Door Labels ..................................................................................................19
Exclude Existing Parts ................................................................................................................20
Run Reports Separately for Each File ........................................................................................20
4. DATA SOURCES AND FIELD CODES ......................................................................... 21
Data Sources ........................................................................................................................................21
View Data Sources......................................................................................................................22
The Globals and Header Data Sources .......................................................................................23
Expression Evaluator ...........................................................................................................................23
Field Codes ..........................................................................................................................................24
Format of the Field Codes ..........................................................................................................24
Viewing the Estimate and Designer Property Field Codes .........................................................25
Expressions ..........................................................................................................................................26
Excel Formulas vs. Studio Expressions ......................................................................................26
Page 4 Smartware Studio Reporting Guide
Custom Sorts, Filters, and Queries ......................................................................................................27
5. EXCEL REPORT TEMPLATE FORMAT ..................................................................... 29
Report Sections ....................................................................................................................................30
The Control Column ...................................................................................................................30
Section Attributes ........................................................................................................................30
Specifying the Data Source for a Section ...................................................................................31
Header Section ...........................................................................................................................31
Nested Sections ...........................................................................................................................32
Data Features .......................................................................................................................................33
Using Formulas ..........................................................................................................................33
Grouping.....................................................................................................................................35
Two-Level Grouping ...................................................................................................................36
Aggregate Formulas ...................................................................................................................37
Grand Totals ...............................................................................................................................38
Forward References ...................................................................................................................38
Sorting the Rows in a Detail Section ..........................................................................................39
Formatting Features .............................................................................................................................39
Autosizing Columns ....................................................................................................................39
Repeat Headers on Each Page ...................................................................................................39
Adding Filters .............................................................................................................................39
Hiding Rows Conditionally.........................................................................................................40
Hiding Columns Conditionally ...................................................................................................41
Setting the Tab Name ..................................................................................................................41
Setting the Tab Name ..................................................................................................................42
Using Images and Logos ............................................................................................................43
Sorting and Querying with Custom Data Sources ...............................................................................44
Filtering and Sorting Existing Data Sources ..............................................................................44
Creating a Custom Database Query ...........................................................................................45
6. WORD REPORT TEMPLATE FORMAT ...................................................................... 47
Field Codes ..........................................................................................................................................49
Required Field Codes .................................................................................................................50
Converting and Formatting Values ............................................................................................51
Embedding Excel Reports (as Tables) .................................................................................................51
Table Width ................................................................................................................................53
Font Percentage .........................................................................................................................54
Repeating Header Rows .............................................................................................................56
Bullet Lists (including Estimate Proposal Items) ................................................................................58
Proposal Items Property .............................................................................................................61
7. EMAIL REPORT TEMPLATE FORMAT ...................................................................... 64
Parameters for Email Reports ..............................................................................................................64
To ................................................................................................................................................64
CC ...............................................................................................................................................64
BCC ............................................................................................................................................64
Subject ........................................................................................................................................64
Body ............................................................................................................................................64
IsHtml .........................................................................................................................................65
ReportAttachments......................................................................................................................66
GenerateReportAttachmentsIndividually ....................................................................................66
GenerateReportAttachementsAsPdf............................................................................................66

Smartware Studio Reporting Guide Page 5
1. Introduction / About This Guide
Smartware Studio (also known as Studio360) is a versatile environment for use in all
aspects of project development, engineering, estimating and document storage. This
Guide will discuss the common Reporting features available in the Estimate, Design,
Management, and Enterprise Management modules and features of Studio, including:
• How to Customize Existing Reports
• How to Create Custom Reports
• How to Distribute Reports to Other Users in your Company
For complete information about Smartware Studio, please refer to the following guides
installed with the software and available from our web site at www.smartwaretech.com.
• Smartware Studio User's Guide
• Smartware Studio Designer Module User's Guide
• Smartware Studio Estimating Module User's Guide
• Smartware Expression Language Guide
Smartware Studio Reporting Guide Page 7
2. Overview of Reports
Reports are documents generated by Studio showing any type data from Estimates,
Design projects, and other modules. The reports are created as Excel spreadsheets and
Word documents by using template documents that contain special fields and metadata to
specify the data to pull into the report. This makes it very easy create custom reports by
simply copying an existing report template and making some changes.
This chapter will discuss some key elements common to reports in general.
Excel Reports
Most reports, especially those with numbers, are generated using an Excel report
template.
• Excel reports are well suited for showing tabular data, including data from
multiple reports.
• Data can be easily aggregated and summed, as well as grouped into multiple
sections or pages.
• Excel reports can contain calculations using both Excel formulas and the
Smartware Expression language.
• Many reports start as Excel workbooks that are being maintained by hand. These
are well suited to conversion to a Studio report template.
For complete detail on the format of the codes and metadata used to create Excel report,
refer to the later chapter on the .
Excel File Format
For best performance and the ability to generate reports without requiring Excel to be
installed, your Excel report templates should be saved as .xlsx files instead of .xls files. If
the file requires macros, the .xlsm format should be used.
Multi-Page Workbook Reports
Excel reports are run individually. While you can run multiple reports at the same time,
either by selecting them or using a Report Group file, the end result is the combining of
the individually created reports.
There are times when you want to migrate a detailed, multiple tab workbook where data
entered in the first tab (or two) carries forward into the later tabs, either for heading
information of calculation values.
Page 8 Smartware Studio Reporting Guide
Studio reports support a format to handle many of these cases. If the name of the report
includes the phrase “(Workbook)”) – including the parentheses – it will run in this mode:
• The report will be run by itself. A copy of the complete template workbook will
be made, and data will be generated into the first tab.
• Links to the first tab from other tabs should be preserved in most cases.
Macros in Excel Reports
For the sake of performance, macros are supported but only to a limited extent. If an
Excel report template contains macro code in the associated Sheet object in the Visual
Basic Project, that code will be copied into the output report as well.
• At this time, this feature only works properly when the report with macros is run
first or alone.
Word Reports
Word report templates are best suited for creating mail-merge style form letters, cover
sheets, transmittals, and contract documents.
• Word reports can contain calculations using the Smartware Expression language.
• Many documents start as Word templates that are being copied and filled in.
These are well suited to conversion to a Studio report document.
• You can insert an Excel report as a formatted table into a Word report.
Word File Format
For best performance and the ability to generate reports without requiring Word to be
installed, your Word report templates should be saved as .docx files instead of .doc files.
If the file requires macros, the .docm format should be used.
Smartware Studio Reporting Guide Page 9
Report Groups
You can create a third type of report template file – Report Groups - that are essentially a
list of other reports to run as a group.
The format of the file is a simple Xml file:
<Reports>
<Report>Estimate Summary.xlsx</Report>
<Report>Material List (By Manufacturer).xlsx</Report>
<Report>Labor Hours (By System).xlsx</Report>
</Reports>
• You can create these files a text file. Change the file extension to.xml, as in
My Estimate Reports.xml
• Each <Report> tag should contain the full file name (but not folder) of the report
to run.
• You can only reference other reports stored in the same folder as the .xml file.
If you want to hide the individual reports that make up the group from the user’s selection
list, see the later section on .
Parameters for Report Groups
You can add parameters to Report Groups to have some extra functionality. All of these
will be set in the Report Group Header following the format below:
<Reports MyParameterName="MyParameterValue">
<Report>Estimate Summary.xlsx</Report>
<Report>Material List (By Manufacturer).xlsx</Report>
<Report>Labor Hours (By System).xlsx</Report>
</Reports>
The parameter value always has to be in quotation marks, even if it is a numeric value.
FileName
By default, the output report file name will be the name of the report group followed by a
timestamp. You can use the FileName property if you would like to set a custom file
name for your group. If there are multiple types of reports in the group, it will give each
report the name of the group.
MergeIntoOneWorksheet
Set MergeIntoOneWorksheet="True" if you would like to combine all the spreadsheets in
a report workbook into one sheet. If set, this will simply place each sheet directly below
the prior one. This is false by default.
Page 10 Smartware Studio Reporting Guide
HeaderRowsToIgnoreWhenMergingIntoOneSheet
If you are merging all of the worksheets from one workbook into one sheet using the
MergeIntoOneWorksheet property, you can tell it to skip a certain number of rows when
copying subsequent sheets. This would mostly be useful if you would like to remove
redundant headers. If you have four rows that you would like to skip, you can set:
HeaderRowsToIgnoreWhenMergingIntoOneSheet="4"
This is set to false by default and will do nothing if MergeIntoOneWorksheet is set to
false.
KeepReportsInGroupTogether
If you select the "Run Reports Individually" option, this will generate each document in a
report group as its own file and save them separately. If you would like to keep all files
from a Report Group together in one document you can set:
KeepReportsInGroupTogether="True"
In this case, if you have a Report Group with two excel reports, and also select three
individual reports, it will generate 4 workbooks: Each individual report from outside the
group, and one workbook representing the Report Group.
Email Reports
You can use the reporting engine to generate email templates. This will be a file in the
report template folder with a .email extension. It can fill in field codes and also reference
other reports to use as attachments. Once generated, it will create and open an email in
your drafts folder.
Report Folders
The report templates for a specific purpose are usually stored together in a single folder.
Examples include Designer reports, Estimate reports, or the reports for a list of Jobs in
the Management module.

Smartware Studio Reporting Guide Page 11
In many cases you will select from the list of reports using the Report Selector:
In other cases, you might select the report from a drop-down list:
Location of Report Files
Reports are generally stored in sub-folders of the Studio Application Data folder (which
is often C:\ProgramData\Smartware Studio\)
• Estimating reports are stored in [APPDATA]\Reports\Estimating.
• Designer reports or [APPDATA]\Reports\Design.
• Management module reports are stored in sub-folders in
[APPDATA]\\Reports\Management, such as
[APPDATA]\\Reports\Management\Vehicles
Page 12 Smartware Studio Reporting Guide
If needed, the APPDATA folder can be found from the TOOLS→OPTIONS→LOCAL FILES
tab.
Creating Custom Reports
In Studio you can create new reports by copying existing reports and modifying them as
you need. When you create a custom report template, you should create it in the same
folder as the other reports for the feature. If you are modifying an existing report, copy it
first and rename it.
• Do NOT modify the standard reports and overwrite the originals with your
changes. Your changes will be lost with the next update to Smartware Studio.
Always work with a renamed copy of a standard report.
Once stored in the folder, the report will automatically appear in the appropriate report
list.
Refer to the later chapters for detailed information on the structure and data fields used in
the report templates.
Distributing Custom Reports
You can easily share your custom reports with the other users in your Company by
copying them to the appropriate distribution folder on your server. Depending on your IT
configuration, only certain users may have permission to write to this folder.
• The first time Studio is run each day on a workstation it starts the Background
Updater, which will copy any updated report template to that workstation. A user
can get the updates immediately by going to TOOLS→CHECK FOR UPDATES.
If the shared server folder on your file server is:
\\OurServer\Smartware Studio Data
Then the distribution folders for reports start with:
\\OurServer\Smartware Studio Data\Resources\Reports
And the folder for custom Estimate reports is:
\\OurServer\Smartware Studio Data\Resources\Reports\Estimating\
You may have to create this sub-folder on your server by hand.
Smartware Studio Reporting Guide Page 13
Hiding Reports from a Report List
You can specify a list of reports that you do not want to be shown in the report list. This
is most often used:
• For reports in a Report Group that you do not want to be selectable individually
outside of the group.
• To hide standard reports that you have customized, so you no longer want the
original report to be shown.
To hide the reports from a list:
• Create a text file in the appropriate Reports sub-folder and name it something that
ends with “hide.txt” (i.e., Reports to Hide.txt).
• In that file, list the names of the files (with file extensions) that you do not want to
be shown, with each file name on a separate line.
• This file can be copied into the Company or Enterprise folder and distributed to
all users.

Smartware Studio Reporting Guide Page 15
3. The Reports Tab
The Reports tab is used in multiple places to let you run custom reports. While the
reports are different, as are some of the options, the Reports tab works essentially the
same in each context.
• You check the reports you want to run and click RUN SELECTED REPORTS.
Report Options
The common options for running reports include:
Show Reports
Opens the reports once they have been generated.
Save Reports
Saves the reports to the Files tab for the current node or record.
Page 16 Smartware Studio Reporting Guide
Generate PDF Reports
Generates a PDF version of the all the reports run. Word and Excel reports will be
merged into one PDF. If Run Reports Individually is checked, each report will become a
separate PDF file. Otherwise, the result will be a single PDF file.
Run Reports Individually
Creates separate output documents (.xlsx, .docx, or .pdf) from each report instead of
combining like document types together into single documents.
Note that this separation includes reports that are selected together using a Report Group.
Send Reports to Printer
Sends the reports to the printer after they have been run. Depending on your Windows
printer settings, this could be either an unprompted printing, or a window will open to
select the printer to use.
Show File Extensions
Toggles whether or not the file extensions of the reports in the list are visible.
Other Common Controls
There are some additional controls at the bottom of the Report Tab that are helpful to
people creating or customizing reports.
View Data Sources
This button allows you to view the data sources that are used in the reports. This can be
very helpful when you are creating or customizing reports and need to find the names of
the appropriate table and data field.
For more on this feature refer the later chapter on .
Open Report Template Folder
Clicking this link will open the folder that contains the report templates for the feature on
your machine. Refer to the previous chapter and section on for more details.
• If you have any custom reports, you can add them to this folder. To refresh the
list of reports in the tab, simply click on a different tab then return to the Reports
tab.

Smartware Studio Reporting Guide Page 17
Use Flexcel and Flexword
Flexcel is an updated engine that creates Excel reports in memory rather than using the
installed version of Excel. This means that you can create Excel reports in Studio
without having Excel installed on your machine, though you will still need Excel (or an
Excel file viewer) to view these. This engine also works significantly faster than the
older method.
Likewise, the Flexword engine optimizes how Word reports are created without using the
Word application.
Since these are newer feature, you can turn these engines off in case there are any
undiscovered issues with them. Uncheck the USE FLEXCEL or USE FLEXWORD if
necessary. If you come across a compatibility issue with any report, built-in or custom,
please contact Smartware Technologies so it can be addressed.
NOTE: While the Flexcel Engine is capable of handling templates with the .xls
extensions, it occasionally does have issues generating these reports. It is highly
recommended that all Excel templates use either the .xlsx or .xlsm file formats.
NOTE: The Flexword Engine requires your report templates to be saved using the .docx
or .docm file formats. Reports run from .doc files will still use the old reporting engine
using Word, which will not support newer features as they are developed.
Estimating Options
These options are specific to reports run from an Estimate’s Reports tab.
Including Material based on ‘Show On Bom’
By default, all material in an estimate is included in any relevant reports. If you’d like to
take the BOM status of a part into account in the reports, you change the option in the
Include Material if Show On Bom is False.

Page 18 Smartware Studio Reporting Guide
Selecting Systems for Reports
If you’d like to run a report only taking only certain Systems into account, you can
choose the SELECT BY SYSTEM option:
Click SELECT SYSTEMS to choose the systems you want the reports to include:

Smartware Studio Reporting Guide Page 19
Designer Options
These options are specific to reports run from a Design Project’s Reports tab.
Select Files or Systems
You can select specific systems and areas to include in reports, as well as specific
Designer drawings.
SmartStruxure I/O Door Labels
There is a specialty report designed for use with Schneider Electric SmartStruxure
(EcoStruxure) I/O controllers connected to an Automation Server (AS). It generates a
Word report with a table of the software tags sized to fit onto the door of the controller to
label the physical connections.
For an I/O device configured as follows:

Page 20 Smartware Studio Reporting Guide
This report will be generated:
Exclude Existing Parts
In the Options area you can select EXCLUDE PARTS MARKED ‘IS EXISTING’. This excludes
all parts that are either already at the site or already owned when designing the project.
This is helpful for any reports that are focused on which parts are needed to purchase.
To denote a part as Existing, check the IS EXISTING box in the Part Properties form when
editing the Visio drawing:
Run Reports Separately for Each File
If you check RUN REPORTS SEPARATELY FOR EACH FILE, each selected report will be run
multiple times, one for each drawing file (or the files explicitly selected). In each report,
only the parts, points, and system data from each file is included in the corresponding
report.
Smartware Studio Reporting Guide Page 21
4. Data Sources and Field Codes
When creating custom or customized reports, you will need to work with the underlying
Data Sources that Studio makes available for the reports. The data that is available varies
for the different Studio projects and features (Estimate, Designer, Management), and how
you get at this data varies between Excel and Word reports, but there are elements that
they all have in common.
The Data Sources are the set of tables available from the module, such as Parts. The
Field Codes are references to this data that you put in the report templates, such as
<PartNumber>. When the report is run, the field codes are replaced with the values from
the data sources.
Data Sources
The Data Sources are all presented as database-style tables. Some of them are actual
tables of data, and some of them consist of a single row in a table, effectively making
them closer to an object or structure (in programming terms).
For Estimates, the data sources include:
• Tables of data such as Parts, Points, LaborCodes, and Subcontracts.
• A Header table (single row) with the properties the user entered on the Properties
tab of the Estimate node (e.g, QuoteNumber, ContractorGeneral)
• A Globals table, which includes hundreds of specific values from the estimate
calculations (e.g., ContractAmount, CostEscalationLabor).
For Designer, there are:
• Tables of aggregated data such as PartsByPartNumber
• A Header table (single row) with the properties the user entered on the Properties
tab of the Designer node (e.g, ProjectNumber, ContractorGeneral)
For Management data, the data sources vary from form to form:
• On the Job List form, there is a table of Jobs.
• On the Job Add/Edit form, there are a number of tables relating to the various tabs
and sub-tabs (e.g., the Tracking Dates, Contractors, Change Orders, etc.)

Page 22 Smartware Studio Reporting Guide
View Data Sources
To view and browse the available data sources for a set of report, go to the Reports tab
and click the VIEW DATA SOURCES button on the bottom.
You will see a list of all the available data sources, such as with this Estimate:
Select the ones you want to see and click LOAD DATA SOURCES. Each data source will be
shown on a separate tab:

Smartware Studio Reporting Guide Page 23
The Globals and Header Data Sources
The Globals and Header data values are often available in a report without explicitly
referring to the table, as in <ContractAmount>, which is the same as using
<Globals.ContractAmount>.
If you need to reference a field from one of these sources explicitly, you can still use the
format <Header.FieldName> or <Globals.FieldName> in the cell or document.
Use the VIEW DATA SOURCES tool for a complete list of the values available:
Expression Evaluator
The expression evaluator is a simple tool that allows you to test and evaluate field codes
and expressions outside of a report.
Refer to the sections, Data Sources as well as Format of the Field Codes, for more
details on viewing data sources and how to properly format field codes, respectively.
Page 24 Smartware Studio Reporting Guide
Field Codes
Field Codes are entered as placeholders in the report template by enclosing them in angle
brackets, such as <PartNumber> or <Price> or <Globals.ContractAmount>. The fields
that are available depend on the Studio module.
You put the Field Codes into your report template:
• As part of an Excel report, a field code will be the entire value of a cell.
• As part of a Word report, a field code can be included within the text of the
document. This includes the header and footer, as well as table cells, but may not
work in text boxes or other advanced Word features.
When the report is run the Field Code is removed and replaced with the value for that
field. However, all formatting in the cell or in the paragraph remains the same. This
includes font, style (bold, italic, underline), size, color, and alignment, as well as numeric
and date formats for Excel cells. When you design a report a good practice is to put a
sample value into the cell, format it appropriately and then replace it with the field code.
Format of the Field Codes
The field code is the text between the angle brackets. It often refers to a single value
from a single row in a data source table, but it can also be a more complex expression
using the Smartware Expressions Language.
<Column Name>
In many cases it can just be the name of a field, as in <QuoteNumber>. That field may
be:
• Part of the Estimate’s or Designer project’s properties
• For Management Add/Edit forms, a field of the record being edited
• For most reports, a field in the single-row Header or Globals table
• For Excel reports, a value from the current row of the data source for the section.
<Table.ColumnName>
Another format is to specify the name of the data source along with the field, such as
<Globals.TotalDirectCost>. This is most often used with the Header or Globals table,
where there is only one row of data, but otherwise it refers to the value in the first row of
the table.

Smartware Studio Reporting Guide Page 25
<Table[Row].ColumnName>
A third method is to reference a specific row of a data source table, as in
<LaborCodes[PM].AdjustedHours>. In this example, the field code refers to a specific
row in the LaborCodes table – the one where the LaborCode column is equal to “PM” –
and to retrieve the value of that row’s AdjustedHours column.
When you use the VIEW DATA SOURCES tool, it will note if the table row can be specified
using this type of syntax:
Viewing the Estimate and Designer Property Field Codes
The Header data source contains, amongst other values, almost all of the properties that
can be viewed on the Properties tabs of an Estimate or Design node. The field code
name is not always obvious from the friendly name shown on the screen, but if you select
VIEW→PROPERTY NAMES from the main menu, the field codes (also called property
names) will be shown in brackets on the screen.
Page 26 Smartware Studio Reporting Guide
Expressions
In addition to single values, you can also form expressions to combine or compare values,
and use them as the field code:
<=IF(ContractAmount > 50000, "Signature Required, "No Signature Required") >
<=FormatNumber(ContractAmount, "C2")
<=LastName & ", " & FirstName>
Note that for reports in Word, any expressions using the > operator (such as the first
example) will need to put a period in front of the operator in order to work. So doing the
first example expression would be:
<=IF(ContractAmount .> 50000, "Signature Required", "No Signature Required")>
These expressions use the Smartware Expression Language, a reference for which can be
found on the HELP→ABOUT SMARTWARE STUDIO menu.
The last example can also be written with a special $ format as:
<=$"{LastName}, {FirstName}">
Where the field code values of LastName and FirstName will be populated with the
values from a project, formatted the way it is written. For instance, to format a site’s
City, State and Zip, you could do the following:
<=$"{SiteCity}, {SiteState} {SiteZip}">
The function described in that guide in the Table Function section can be applied to the
data sources available in the report
COLUMNTOTAL(LaborCodes, "TotalHours",
"ISONEOF(LaborCode, 'SOFT', 'ENG', 'GRAPH')")
Excel Formulas vs. Studio Expressions
You can use both Excel formulas and Studio expressions to accomplish similar tasks.
The main differences are:
• Excel formulas operate on other cells in a report. If those other values are not
already in the report, they are often added in hidden columns. A Studio formula
can operate on any of the available values in the data sources without the extra
cells.

Smartware Studio Reporting Guide Page 27
• Excel formulas remain formulas in the generated report. Studio formulas are
evaluated and replaced with the result.
For example, you can create two separate cells with <NetCost> and <Quantity> and a
third column to multiply them using an Excel formula (= D7*C7), or you can use
<=NetCost * Quantity> as a field code in a single Excel cell:
When the report is run, the two Cost Per System columns will have the same values, but
if you change a value in the Net Cost or Quantity column only the first Cost per System
will update.
Custom Sorts, Filters, and Queries
If you need to create custom queries with custom sorting and filtering, you can define
them as part of an Excel Report. Refer to the section on Sorting and Querying with
Custom Data Sources in the later chapter on the Excel Report Template Format.
Smartware Studio Reporting Guide Page 29
5. Excel Report Template Format
An Excel Report Template is an Excel worksheet with field codes added to indicate
where data will be inserted when the report is run.
A simple template will often contain a Detail section, which is generated once for each
row in a Data Source, as well as a Header and maybe a Footer section above and below
the detail. There are also facilities for grouping, sorting, section breaks, formulas, and
aggregates such as totals.
Here is a sample report template:
And here is a sample report created from that template:

Page 30 Smartware Studio Reporting Guide
Report Sections
A report will generally consist of three sections: a set of Header rows, a single Detail
row, and a set of Footer rows. When the report is run, the header section will appear
once, while the detail row will be repeated for each record in the data source.
Here is a sample template that generates a basic list of parts in an Estimate:
The Control Column
You can explicitly define the sections by including a control column, as shown in the
example template above in column A. If cell A1 contains an <H> tag, the entire first
column is assumed to contain section control information for the report and will be
removed when the report is generated. You can use the following tags:
<H> Begin Header section
<D> Begin Detail section
<F> Begin Footer section
<X> Begin Extra Information section
After a section begins, it is assumed to continue until the next different tag or the end of
the worksheet.
If a control column is not defined, the detail row is assumed to be the last row in the sheet
that contains a field code. All rows above it are assumed to be the header, and all rows
below it are assumed to be the footer.
Section Attributes
You can set various attributes in the sections of a report by including them in the section
tag using a format such as:
<D Filter=Auto>
Smartware Studio Reporting Guide Page 31
Specifying the Data Source for a Section
The DataSource tag specifies which data source to use in a section. It will usually go in
the <H> and <D> sections of a report.
<H DataSource=Parts>
<D DataSource=Parts>
If a DataSource is not explicitly specified in the <H> tag, the values for field codes that
appear in the header are taken from the Header or Globals table, or the first output record
of the Detail section. Therefore, you can leave out this tag from an <H> section if you are
only using fields in Header or Globals.
Header Section
The Header section usually contains values from Globals or Header, as well as the
heading text for the values in the Detail section. You can also specify other options.
RepeatOnPage
The RepeatOnPage attribute causes the data in the heading section to be repeated at the
top of each printed page in the report. This is useful for reports intended to be printed
that may contains multiple pages of records.
<H RepeatOnPage=True>
AutosizeColumns
The AutosizeColumns attribute causes the columns in the report to be resized to fit their
values. This can be useful for printed reports.
<H AutosizeColumns=True>
AutosizeRows
The AutosizeRows attribute causes the rows in the report to be resized to fit their values.
This can be needed for cells with multiple lines of text to be visible by default
<H AutosizeRows=True>

Page 32 Smartware Studio Reporting Guide
Nested Sections
For more complicated reports, you may need more than one Detail section to bring in
data from more than one data source. A good example is the Estimate Summary report:
For a report like this, there will still be <H>, <F>, and <X> sections, but instead of the <D>
section you include one or more groups of nested H/D/F sections (such as <H1>, <D1>,
and <F1>).
• Each group of sections can have its own Data Source.
• The <Dx> section is optional. A group containing just <Hx> and <Fx> sections is
often used to bring in values from the Globals and Header data sources.
• The amount or number of blank rows between the footer and <Dx> section will be
reflected in the generated report.
• Nested sections must be numbered in order without gaps.

Smartware Studio Reporting Guide Page 33
Data Features
There are a number of data-related features available in the report format to provide more
sophisticated capabilities.
Using Formulas
There are two similar, yet separate ways to use formulas in your reports to create custom
values.
• Add an Excel Formula to a cell in the report template that operates on other
generated values in the report.
• Use expressions in the Field Codes.
Using Excel Formulas
You can use any formula that you would normally use in Excel and reference cells
containing the <fieldcode> fields as parameters. One thing to realize is that since the
cells contain text in the template, the result of the formula will often be an error until the
report is run.
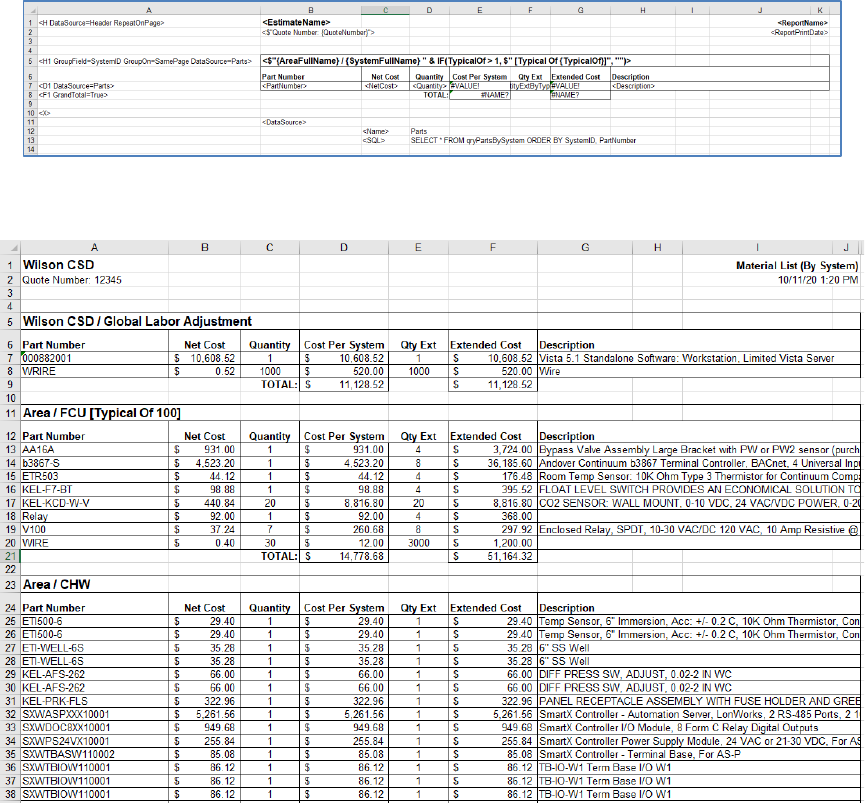
For example, in the Material List (by Area) report sample shown below, you can see that
the detail section (row 7) contains <NetCost> and <QuantityExtR> fields in columns C
and F. Column G contains the product of these, with a formula of “C7*F7”.
Since the text values of <NetCost> and <QuantityExtR> cannot be converted to numbers
until the report is generated, Excel returns a #VALUE! error as illustrated below.

Page 34 Smartware Studio Reporting Guide
However, when the report is run and the field codes are replaced with numbers, the
formula will be recalculated and produce the Extended Cost we were looking for.
• You can see that not only was the Extended Cost calculated, but also that the
formula still exists within the cell after the report is generated. This allows the
final generated report to be used as a live worksheet, giving you real-time updates
as you change values, i.e., if you were to change the Qty Ext of the Net Cost
values, the Extended Cost will update.
Note: The cell identifiers have changed in the generated report. This is because the
Control Column (column A) has been removed, resulting in a shift of columns. Also, the
cell number will change depending on the amount of data that will be populating the
report.
Using Expression Language Formulas
There is also an expression language in the Studio reports with many other specially
designed functions. Please refer to the Smartware Expression Language Reference guide
under the HELP→ABOUT SMARTWARE STUDIO / STUDIO360 menu.
<= IF(ContractAmount > 50000, "Signature Required", "No Signature Required")>
<= FormatNumber(ContractAmount, "C2")
<= LastName & ", " & FirstName>
Note that for reports in Word, any expressions using the > operator (such as the first
example) will need to put a period in front of the operator in order to work. So doing the
first example expression would be:
<=IF(ContractAmount .> 50000, "Signature Required", "No Signature Required")>
Refer to the section Expressions in the previous chapter.

Smartware Studio Reporting Guide Page 35
Grouping
You can break up groups of records into multiple pages by using the following header tag
attributes:
<H GroupField=fieldcode GroupOn=SamePageOrSheets>
In the output report, each time the value of the <fieldcode> field changes between two
records, a new group section or worksheet tab is created with a separate output report.
The value of <fieldcode> is used for the name of the worksheet on its tab.
Generally speaking, the output needs to be sorted on the <fieldcode> field to properly
group on it.
You can group into separate tabs or multiple sets of rows on a single tab:
groupon=Sheets Each group goes on a separate worksheet page
groupon=SamePage The detail and footer sections of each group repeat on
the same page (the header is suppressed after the first
time)
When you group on Sheets, the name of the tab will by default be the value of the
<fieldcode> field. You can override this by setting the separate GroupTabNameField
parameter to a different field code.
<H GroupField=SystemID GroupOn=Sheets
GroupTabNameField=SystemName>
Page 36 Smartware Studio Reporting Guide
Grouping on SamePage will keep all data on the same page:
Two-Level Grouping
In addition to the ability to break up groups of records into multiple worksheet tabs as
detailed above, you can also specify two-level grouping. Specifically, this is only needed
if you wish to group your data on different sheets by one field, and within each sheet
based on a different field. This is accomplished by using the OuterGroupField attribute.
<H OuterGroupField=fieldcode2>
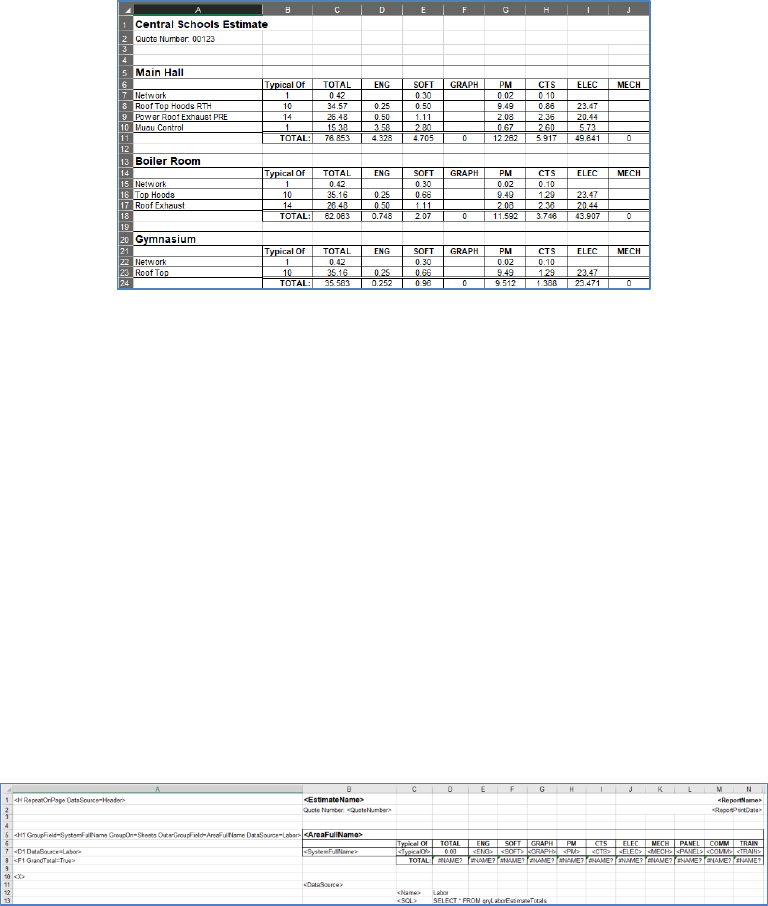
For example, using the Labor Hours (by System) report, you can group by the
AreaFullName onto a separate sheet and the SystemFullName field within each sheet
using the header attributes below.
<H GroupField=SystemFullName GroupOn=Sheets
OuterGroupField=AreaFullName DataSource=Parts>

Smartware Studio Reporting Guide Page 37
The example takes the list of labor hours and splits them across spreadsheets based on the
area name. It then groups the labor hours on each sheet based on the system name:
Here you can see that each area in the Estimate has been separated across tabs (Main
Hall, Boiler Room, Gymnasium), as well as separated within each tab based on the
system name (2 – Roof Top Hoods RTH, 3 – Power Roof Exhaust PRE, 4 – MUAU).
If the heading is multiple rows and you want some of them to only appear once on a
sheet, with the first sub-group, you can use the additional parameter to specify how many
rows to omit the second time on a sheet:
<H HeaderRowsToSkipOnSamePageGroup=n>
Aggregate Formulas
To produce totals and other formulas based on the aggregate of multiple rows in the
output report, use the following special notation around the cell reference in the formula:
AGG(cellref)
When the report is run, the reference to the cell is expanded to become the range of cells
for that column in all the output records.
Page 38 Smartware Studio Reporting Guide
For example, in the template above cell G8 in the footer contains the formula
“=SUM(AGG(G7))”. If the report is run with 10 records, they will end up occupying
rows 21 to 30 in the output report. The phrase “AGG(G7)” in the formula will be
expanded to “G7:G16”, and the resulting formula will be “=SUM(G7:G16)”, which will
properly evaluate to the sum of the values in that column for each row.
It doesn’t matter whether the value in G7 was an Excel formula or a field code. Nor are
you restricted to the SUM function, as any Excel function will work (e.g.,
“=AVG(AGG(G7))”, or even “=SUM(AGG(G7)) / COUNT(AGG(G7))”. The only
restrictions are that the aggregate formula be in the footer section (which requires the use
of the Control Column), and that the cell reference be a cell in the detail section.
Aggregates with Multiple Row Detail Sections
If the detail section spans more than one row, the aggregate function will attempt to
properly build the formula by creating a list of the appropriate cells. For example, if the
detail section of a report template occupied rows 30 to 32, and the output report contained
5 records, a reference such as “=SUM(AGG(F30))” would be translated into
“=SUM(F30,F33,F36,F39,F42)”, which would evaluate properly. In Excel,
however, most functions are limited to 32 parameters, so if there are more than 32
records in the generated report, there is no choice but to translate the cell reference into
the entire column (i.e., “=SUM(F30:F126)”). This will only be a problem if the detail
section contains other numeric values in the same column of its other rows (i.e., cells F31
or F32). As long as those cells are blank or contain only text, the formula will still
evaluate properly.
Grand Totals
By adding the GrandTotal attribute to the footer, the footer section is repeated one final
time, with a Sum() function added for all fields that contained an AGG function in the
footer.
<F GrandTotal=True>
Forward References
In a typical report with all three sections, there is a specific case that needs an additional
function. To have a cell in the Header section reference a cell in the footer (e.g., a total),
add the GET function around the reference:
=GET(cellref)
This function tells the report engine to update the formula to correctly reference the
footer row after all the detail rows are added and the row numbers change.
Smartware Studio Reporting Guide Page 39
Sorting the Rows in a Detail Section
You can sort the data in a Detail section by using the SortBy attribute:
<D SortBy=field>
You can specify multiple property names simply by separating them with a comma:
<D Sort By=field1, field2, …>
Formatting Features
While much of the formatting in your report templates is done while editing them in
Excel, there are some additional capabilities of the report engine that can handle common
needs.
Autosizing Columns
The AutosizeColumns attribute, specified in the Header tag, causes the columns in the
report to be resized to fit their values. This can be useful for printed reports.
<H AutosizeColumns=True>
You can also use the attribute AutoFitColumns in the same way.
<H AutoFitColumns=True>
Repeat Headers on Each Page
The RepeatOnPage attribute causes the data in the heading section to be repeated at the
top of each printed page in the report. This is useful for reports intended to be printed
that may contains multiple pages of records.
<H RepeatOnPage=True>
Adding Filters
You can have Excel’s AutoFilters added to your detail columns by including the
following attribute in the detail tag:
<D Filter=Auto>

Page 40 Smartware Studio Reporting Guide
This will allow you to filter the output rows based on different criteria in each column,
using drop down list boxes added to the column headings.
Hiding Rows Conditionally
Sometimes a report contains rows that you do not want displayed in every case, such as
when a value is zero. For example, consider this section of the Estimate Summary
template:
Rows 20 to 23 will show values, such as Allowance for Cost Escalation and Shift
Differential, that may not be commonly used. To prevent these excess rows from
cluttering up the report, it would be better to simply hide them when the associated value
is zero.
To add this behavior, start by adding two additional columns at the right end of the
template and put two specific field codes (<HideRowIfZero> and
<HideRowIfZeroValue>) in a row above where you want to start hiding rows:
Then in any row that you want to conditionally hide, put HideRowIfZero (no brackets) in
the first of these columns and a field code or expression to evaluate in the cell next to it.
In the example above, the Allowance for Cost Escalation will be hidden if the value of
<CostEscalationLabor> is zero.
In this example output, both the Allowance for Cost Escalation and Shift Differential
rows (number 27 and 28) are hidden automatically:

Smartware Studio Reporting Guide Page 41
Hiding Columns Conditionally
If you have a report that contains a large number of columns, some or most of which will
usually be empty, you can flag the columns to automatically be hidden if all the values
are zero or blank.
Numeric Columns
To conditionally hide a column containing a numeric field, set the value in the first row
of the column to be DINNZV (Delete If No Non-Zero Values). This hides the column if
every row has a value of 0 (or blank) in the column’s output.
In this example, the Estimate's Point Counts (for Individual Systems) report has a column
for every point type, many of which are rarely used. In this case, if for all the systems in
this report the DI count was zero, column E in the output would be hidden.
Boolean Columns
To conditionally hide a column containing a Boolean (True or False) field, set the cell in
the first row of the column to be DINXV (Delete If No 'X' Values). This checks the
column for a cell with a value of "X". If none are found, the column is hidden.
If necessary, you can use an existing Boolean column to generate a column of X or blank
values to display and hide by using an expression like:
<IF(ShowOnBom, 'X', '')>
Setting the Tab Name
<X>
<ReportProperties>
<TabName> tabname
See the iPortal report

Page 42 Smartware Studio Reporting Guide
Setting the Tab Name
If you would like to specify or customize the names of the Worksheet tabs, you can do so
by adding the following format outlined below to the <X> data section of the report. This
option, however, is not available for grouped or multi-level grouped reports.
<X>
<ReportProperties>
<TabName> tabname
The example below illustrates how you would use this in a report.
• The <X> tag, indicating of the beginning of the extra information section, is
required for this format to work correctly.
• Any blank rows between the footer <F1> and <X> will be included in the footer in
the generated report.
• The <ReportProperties> field code must go in the column one to the right from
<X>.
• The <TabName> field code must go one row down and one column over from the
<ReportProperties> field code.
• The “Custom Name” or name you would like the tab to be called, must be put in
the same row and one column over from the <TabName> field code.
• There cannot be any blank rows between the <X> tag and the
<ReportProperties> tag.

Smartware Studio Reporting Guide Page 43
If your report contains additional information in the <X> section, you can simply add the
<ReportProperties> field code format below it, using the same rules outlined above.
There must also be no blank rows between sections.
Using Images and Logos
You can any image or logo into your Excel templates, making it easy to fully customize
your Estimate or Design reports for a company or customer.
In the case that a report has or is grouped on multiple tabs, you should verify that the
image is repeated properly on each individual tab. If not, you should check the image
properties in Excel.
• Select and right-click the image → SIZE AND PROPERTIES (or FORMAT PICTURE)
→ PROPERTIES.
• Select the MOVE BUT DON’T SIZE WITH CELLS radio button.
• Check the PRINT OBJECT checkbox.
• Check the LOCKED checkbox.
Page 44 Smartware Studio Reporting Guide
Sorting and Querying with Custom Data Sources
If there is data you would like that is not in the current report data source options, you
may be able to add it yourself as a custom <DataSource> entry in the <X> section of the
report. Once defined, you can reference that Data Source from within the report as you
would others.
There are two types of custom Data Sources:
• One that filters or sorts an existing Data Source
• One that performs a SQL-style query on the underlying Estimate Cache Database
or Designer Project Database, both of which are Microsoft Access databases
created from the Estimate or Designer project data and used by reports.
Filtering and Sorting Existing Data Sources
When creating a new data source based on an existing one, the entry in the <X> section
will look like this:
<X>
<DataSource>
<Name> PartsOver100
<FROM> Parts
<WHERE> ListPrice > 100
<ORDER BY> PartNumber
<RESET ROW NUMBERS> True
In the above format:
• <X> indicates the extra information section of the report template.
• <DataSource> specifies that you are creating custom data source for the template.
• <Name> identifies the custom name you choose to call the data source.
• <FROM> identifies which existing data source that the data will be retrieved from.
• <WHERE> allows you to filter the results based on basic conditions and
expression.
• <ORDER BY> allows you to sort any result set in ascending or descending order.
• It is not required to use both <WHERE> and <ORDER BY>.
Smartware Studio Reporting Guide Page 45
• <RESET ROW NUMBERS> will update the _RowNumber column in the
data source to take into account the current filtering or ordering. If you
do not use the <WHERE> or <ORDER BY> clauses, or the Row Number
column, this is not necessary.
Creating the above format mean that the report can use this data by including the
following tag in the data section just as you would with a normal data source:
<D DataSource = PartsOver100>
Creating a Custom Database Query
Each time you run a report for an Estimate or Design project, its relevant data is copied
into a Microsoft Access database file that the reporting engine uses to get data for the
Data Sources. The built-in Data Sources exposed in the View Data Sources tab are a
combination of:
• Tables queried from this database
• The results of existing queries defined in the database
• A combination of tables, queries, and custom code that produce a new data source
If you are familiar with Microsoft Access queries you can define a new Data Source in
your report that runs almost any type of query against the database. Here is the same
example as the previous section, but as a direct query:
<X>
<DataSource>
<Name> PartsOver100
<SQL> SELECT * FROM Parts WHERE ListPrice > 100
ORDER BY PartNumber
This format represents all parts that have a list price of more than $100 sorted by Part
Number, where:
• <X> indicates the extra information section of the report template.
• <DataSource> specifies a custom data source for the template.
• <Name> is the custom name you choose to call the data source.
• <SQL> is the specified query to retrieve the data.
Just as the above format, creating this custom data source means that the report can use
this data by including the following tag in the data section:
Page 46 Smartware Studio Reporting Guide
<D DataSource=PartsOver100>
To open the database (which requires you to have Microsoft Access installed), right-click
the Estimate or Designer project node and select OPEN FOLDER IN FILE EXPLORER and
open the _~Cache Database.mdb (Estimate) or _~Project Database.mdb (Designer) file.
Many of the built-in reports use this format to define their queries, so you can refer to
those examples.

Smartware Studio Reporting Guide Page 47
6. Word Report Template Format
Similar to Excel reports, you can also create reports based on Word documents by simply
taking an existing document and adding field codes to indicate where data will be
inserted when the report is run.
However, Word reports differ as they do not have the complete spreadsheet and cell data
manipulation capabilities that exists in Excel. Instead, Word reports are best used for
generating proposals, customized cover sheets, letters, and other more formatted
documents. You can even embed existing Excel reports to use as tables in the document.
For example, here is a sample proposal Word report template:

Page 48 Smartware Studio Reporting Guide
And here is the result after generating the above template:

Smartware Studio Reporting Guide Page 49
Field Codes
Word report field codes work much those in Excel. If you would like a value from an
Estimate or Designer project to display in a Word report, you enter the field code as
follows:
<FieldCode>
When the report is run, the field codes in brackets are replaced with the values from the
data sources:
For full details on the different formats of field codes, how to access the field code
names, and the expressions available to use in the field codes, refer to the earlier Field
Codes section in the Data Sources and Field Codes chapter.

Page 50 Smartware Studio Reporting Guide
Required Field Codes
Because field codes will evaluate to being blank if no value is found for that item, you
might not be able to notice if a required value is missing. As an option, you can force a
field value to check for this by specifying the following instead:
<*FieldCode>
This still evaluates to the value for the field code, but if no value is found for that item, in
which it will result in the field code name itself – in this case "<FieldCode>".
For example, the left image below shows both regular field codes as well as a required
field code (<*OfficeFax>). After the report is generated, the resulting image on the right
filled in the field codes with the data that was available. Specifically, there was a value
found for all properties besides <OfficeAddress2> and <*OfficeFax>. Because the
<*OfficeFax> code was required but blank, it resulted in the field code name itself,
<OfficeFax>, whereas the normal or non-required field, <OfficeAddress2>, was removed
completely.

Smartware Studio Reporting Guide Page 51
Converting and Formatting Values
The expression language available to Field Codes is capable of converting between
different value types under most circumstances. To explicitly convert or format values
from one type to another, you can the functions described in the Expression Language
Guide in the sections for Numeric Formatting Functions, Date Formatting Functions,
and Conversion Functions.
Some useful examples include FormatNumber and FormatDate:
Embedding Excel Reports (as Tables)
Although you cannot define a table of data in a Word report directly, you can embed the
results of running an Excel report into your Word report as a table.
[ExcelReport Name=Report to Run.xlsx]
For example, to embed the Material List (By System) report within a Word report
template, use:
[ExcelReport Name= Material List (By System).xls]

Page 52 Smartware Studio Reporting Guide
When the Word report is run, it will also run the Labor Hours (By System) report as an
Excel report. It will then copy the results from that Excel report into the Word report as a
formatted table.
NOTE: This feature is only available in Word Reports that have the .docx or .docm file
extension.
In order to better customize and adjust the embedded Excel report, there are several
additional parameters that can be added to the above format. Each added parameter is
separated by semicolons and can be used together, such as:
[ExcelReport Name=Report to Run.xlsx; TableWidth=7.5; FontPercentage=50;
RepeatHeaderRows=2]
These parameters are described in the next sections.
You can also consider creating a customized version of the Excel report that includes less
columns to use as the embedded report.

Smartware Studio Reporting Guide Page 53
Table Width
The TableWidth parameter sets a specific width for the output Excel table in the format
of inches. If this is not specified or set correctly, it will default to the page width, which
for a new Word document is typically 8.5 inches. This parameter is formatted as follows:
[ExcelReport Name=Report to Run.xlsx; TableWidth=7.5]
For example, when generating the Customer Pricing (By System) report without explicitly
specifying the TableWidth parameter it does not expand to the entire page width, leaving
extra white space in the page margin:

Page 54 Smartware Studio Reporting Guide
If we explicitly set the width of the table to 7.5 inches, it fills more of the area:
Font Percentage
Since Excel tables can be quite large, they can have problems looking good in the
constraints of a word document. The FontPercentage field allows you to reduce the font
size for the table by a percentage. This still allows for the contrast between font sizes
while reducing the size to a more manageable level. The format is as follows:
[ExcelReport Name=Report to Run.xlsx; FontPercentage=n]

Smartware Studio Reporting Guide Page 55
For example, when embedding the Labor Hours (By System) Excel template into a Word
document without specifying the FontPercentage parameter, it doesn't fit perfectly with
respect to the font sizes.

Page 56 Smartware Studio Reporting Guide
However, when specifying the FontPercentage parameter, you can adjust and best fit the
embedded table. This is illustrated below where the example shows the font size of the
embedded Excel table being reduced by 50%.
Repeating Header Rows
Since Excel tables can become quite long, depending on the amount of data, they will
often extend beyond a single page. The RepeatHeaderRows parameter allows you to
choose how many header rows of your Excel table you would like to repeat on each
extended page, if any:
[ExcelReport Name=Report to Run.xlsx; RepeatHeaderRows=n]
Where n represents the number of Excel rows you wish to repeat.

Smartware Studio Reporting Guide Page 57
For example, when attempting to embed the Material List (By Area) Excel report, you
can see below that the header section includes a total of eight rows, including the blank
rows.
Therefore, if you wanted to include all eight header rows on each page that the Excel
table extends on, you can choose to have n equal to 8:

Page 58 Smartware Studio Reporting Guide
Alternatively, if you would rather not have the repeated header rows on each page, you
can set n to 0, or simply leave it out. The image below shows the default behavior if you
do:
Bullet Lists (including Estimate Proposal Items)
The List feature is a special format that is used to generate bulleted lists in Word reports,
such as proposals.
The main use of this feature is to generate a tree of bullets based on an the Systems and
Areas in the estimate. The Systems and Area nodes have a property called Proposal
Items, which is text to use for the corresponding bullet item in the output. If the Proposal
Item field is empty, the name of the System or Area will be used instead.
This report will be used as the example in this chapter.
The basic format of the [List] tag is:
[List DataSource=ProposalItems; StyleName=PI #;StyleByLevel=True]
where:
• The [List] tag indicates where in the Word template the bulleted list will be
inserted.
• The DataSource tag indicates which data source is being used.
• The StyleName parameter (PI #) is a format string that specifies the different
named Word styles to use for the different levels in the bullet list. The # in the
string is replaced with the number of the level (so PI 1, PI 2, PI 3, etc.).
• The StyleByLevel=True parameter makes each node's Style index the same as its
level in the Estimate's tree. This is usually the behavior you want unless you are
using the specific Alpha formats.

Smartware Studio Reporting Guide Page 59
It is important to note that the actual styles need to be defined with these names in the
Word template document. It is up to the person creating the template to ensure that the
increasing styles have an increasing indent level in order to create the proper nested
effect.
For helpful examples of the List format and how it is used, you can reference the Systems
Bullet List.docx Word Report template available for Estimates:

Page 60 Smartware Studio Reporting Guide
Here, at the top of the Systems Bullet List template, there is a helpful description of how
the list feature works. Under this are several samples of the bullet list styles and how you
may go about formatting them for a template proposal. The resulting two-page Word
document generated from these examples is shown below.

Smartware Studio Reporting Guide Page 61
Proposal Items Property
The ProposalItems property found on the Properties tab of both the Area and Systems
nodes is designed specifically for the use with the bulleted list feature and proposal
documents.
By default, without explicitly adding any proposal items, a generated bullet list will
populate each bullet with the names of the project’s nodes. For example, the Project
view shown in the left image below will generate the resulting image on the right.

Page 62 Smartware Studio Reporting Guide
However, if you wish to add additional proposal items or customize the names shown on
a generated Word report, you can do so by adding items to the Proposal Items property
for Areas and Systems. This is demonstrated below:
This will result in the following, reflecting the Proposal Item added in the above image:

Smartware Studio Reporting Guide Page 63
You can also add multiple Proposal Items within a single Area or System simply by using
the | or bar character. Including this will cause any added item after the bar character to
be added to a new bullet or line:
To edit all of the Proposal Items fields at once:
• Right-click on the Estimate or Area node
• Select PROPERTY SHEETS AND REPORTS
• Check the ALSO SHOW PROPERTIES FROM CHILD ITEMS
• For REPORT NAME, select Systems and Areas
Page 64 Smartware Studio Reporting Guide
7. Email Report Template Format
The .email format is a text file broken up into sections. As a note, any field codes that are
used have to be wrapped in braces. So unlike other reports, <JobNumber> will not work,
but {JobNumber} will.
Parameters for Email Reports
You will set the parameters for reports by using the format FieldName : FieldValue. Each
parameter has to be on a new line of the template. The value can either be a set piece of
text, a field code, or an expression (for information on how to use expressions, refer to
the Smartware Expression Language Reporting Guide).
To
This sets the list of who will be in the “To” line of the Email. To include multiple email
addresses, put a semicolon in between each address.
CC
This sets the list of who will be in the “CC” line of the Email. To include multiple email
addresses, put a semicolon in between each address.
BCC
This sets the list of who will be in the BCC line of the Email. To include multiple email
addresses, put a semicolon in between each address.
Subject
This sets the subject line of the email.
Body
This sets the body of the email. This must be the last parameter of the template. All
text after the Body parameter will be assumed to be part of the email body.

Smartware Studio Reporting Guide Page 65
IsHtml
This should be set as True or False. If true, the body will be read as coded with HTML. If
false, it will be read as plaintext. It this parameter is not given, it will be assumed to be
false. For example, the following template will bring up the following email:
But changing it to HTML will bring up:

Page 66 Smartware Studio Reporting Guide
To use HTML to make a line break after each word, you would use the HTML line break
tag, or <br />.
ReportAttachments
This will generate reports off of the record you are currently in and attach them to the
email. Only the template file name is needed, not the full path. To include multiple
templates, separate them with a semicolon (;).
GenerateReportAttachmentsIndividually
This can be set to true or false. If true, each report will be in its own file, otherwise Excel
reports will be on individual tabs in the same workbook, and word reports will be stitched
together. This mirrors the “Run Reports Individually” checkbox in the report engine. If
this parameter is not set, it will default to false.
GenerateReportAttachementsAsPdf
This can be set to true or false. If true, the reports will all be saved as PDFs before being
attached to the email. If this parameter is not set, it will default to false.
